R E S E A R C H
Open Access
Diplotyper: diplotype-based association analysis
Sunshin Kim
1, KyungChae Park
2, Chol Shin
3, Nam H Cho
4, Jeong-Jae Ko
1, InSong Koh
5*, KyuBum Kwack
1*From Second Annual Translational Bioinformatics Conference (TBC 2012)
Jeju Island, Korea. 13-16 October 2012
Abstract
Background: It was previously reported that an association analysis based on haplotype clusters increased power over single-locus tests, and that another association test based on diplotype trend regression analysis
outperformed other, more common association approaches. We suggest a novel algorithm to combine haplotype cluster- and diplotype-based analyses.
Methods: Diplotyper combines a novel algorithm designed to cluster haplotypes of interest from a given set of haplotypes with two existing tools: Haploview, for analyses of linkage disequilibrium blocks and haplotypes, and PLINK, to generate all possible diplotypes from given genotypes of samples and calculate linear or logistic regression. In addition, procedures for generating all possible diplotypes from the haplotype clusters and transforming these diplotypes into PLINK formats were implemented.
Results: Diplotyper is a fully automated tool for performing association analysis based on diplotypes in a population. Diplotyper was tested through association analysis of hepatic lipase (LIPC) gene polymorphisms or diplotypes and levels of high-density lipoprotein (HDL) cholesterol.
Conclusions: Diplotyper is useful for identifying more precise and distinct signals over single-locus tests.
Background
Causal mutations for health conditions with genetic bases can be identified through finding associations with haplo-types, a form of correlation known as linkage disequili-brium (LD) [1]. Investigating significant haplotype structure has become a routine research activity. The Haploview tool provides computation of LD and popula-tion haplotype patterns from genotype data [2]. The PLINK tool set [3] accomplishes diverse functions includ-ing a module carryinclud-ing out Expectation-Maximization (EM) algorithm [4]. PLINK focuses on fast calculations with large datasets. WHAP was developed to perform haplotype-based association analysis in population and family samples using single nucleotide polymorphism (SNP) data [5]. An additional software tool was elabo-rated for carrying out haplotype association analysis in unrelated individuals [6]. To provide a detailed genome
structure, a recloning system [7] was developed to obtain the sequences of 20 haplotypes from a chimpanzee and a gorilla, across human leukocyte antigen (HLA) genes.
Meanwhile, rare haplotypes have been investigated to identify their roles in influencing disease susceptibility. Experimental data showed that two rare haplotypes of parathyroid hormone-related peptide receptor type 1 and vitamin D receptor genes, with frequencies of 1.1% and 2.9%, respectively, were significantly associated with osteo-porosis phenotypes (P = 4.2 × 10⁻⁶
and P = 1.6 × 10⁻⁴, respectively) [8]. Recently, haplotypes in the regulatory regions of the HLA-G gene were examined to recognize possible associations with the implantation outcome in couples undergoing assisted reproduction treatments (ART). The results revealed a complete absence of some haplotypes in couples undergoing ART [9].
Notably, Durrant et al. proposed a novel approach to investigate associations between diseases and haplotype clusters in a logistic regression framework through cla-distic analysis of SNP haplotypes. Substantial increases in power over single-locus tests were demonstrated by the simulation study. Their empirical data showed that a
* Correspondence: [email protected]; [email protected]
1
Department of Biomedical Science, College of Life Science, CHA University, Seongnam, Korea
5
Department of Physiology, College of Medicine, Hanyang University, Seoul, Korea
Full list of author information is available at the end of the article
© 2013 Kim et al.; licensee BioMed Central Ltd. This is an open access article distributed under the terms of the Creative Commons Attribution License (http://creativecommons.org/licenses/by/2.0), which permits unrestricted use, distribution, and reproduction in any medium, provided the original work is properly cited.
haplotype cluster that consisted of two haplotypes had the strongest effect on Cystic Fibrosis (OR = 96.8) [10]. Luo et al. used a novel analysis, diplotype trend regres-sion (DTR) analysis, to investigate associations between certain diplotypes of alcohol dehydrogenase and aldehyde dehydrogenase genes, and alcohol dependence. They demonstrated that DTR outperformed other conven-tional association methods [11]. Both articles indicated that our new algorithm might provide a synergistic effect through combining analyses based on both haplotype clusters and diplotypes.
Here, we propose a novel method to investigate asso-ciations between diplotypes and diseases. We define a haplotype cluster as a set of haplotypes. We also define a diplotype as a haplotype cluster pair, the definition of which is extended from a haplotype pair. The first step of our method uses the Haploview tool to generate all possi-ble haplotypes. Second, all possipossi-ble haplotype pairs (diplotypes) from SNP genotypes of all samples are gen-erated by PLINK. Third, all possible haplotype clusters are generated by our clustering algorithm from the hap-lotypes produced in the first step. Fourth, the patterns of all possible diplotypes are generated from those haplo-type clusters. Fifth, to calculate regression by PLINK, the diplotypes of the samples are transformed into AA, AB, or BB formats according to the diplotype patterns pro-duced in the fourth step. Finally, PLINK was used with a regression model to obtain the association results. All of these procedures are performed automatically by the software we developed, named Diplotyper, which was implemented in Python 2.7.
We applied this method to an association study between high-density lipoprotein cholesterol (HDL-C) and the hepatic lipase (HL) gene. HL is involved in lipo-protein metabolism through its bridging function, which facilitates the interaction between lipoproteins and lipo-protein receptors, and its activity plays an important role in plasma lipoprotein metabolism and the atherosclerotic process [12]. HL plays an important role in both reverse cholesterol transport and non-cholesterol-dependent mechanisms involved with HDL [13,14]. Changes in HL activity can be associated with alterations in lipoprotein composition, which may contribute to the development of atherosclerosis [12,14]. Low HDL-C levels are risk fac-tors for coronary heart and cardiovascular diseases [15,16]. Extensive research has provided evidence that increasing HDL-C levels can reduce the risk of cardiovas-cular disease [17-20]. The risk of developing coronary heart disease can be determined by the levels of HDL-C [21]. In particular, a recent report, based on the Korea National Health and Nutrition Examination Surveys I, II, III and IV, shows a growing prevalence of dyslipidemia and hypertriglyceridemia in Korea during the last decade [22].
LIPC encodes hepatic triglyceride lipase, which is expressed mainly in the liver and is located on 15q21-q23, where it spans 171 kb and comprises nine exons and eight introns. Two SNPs [-514C > T (rs1800588) and -250G > A (rs2070895)] in the promoter region are in almost per-fect LD (R2= 0.97) [23,24] and both the promoter SNP (rs1800588) and the intronic SNP (rs261332) has strong LD (R2= 0.92) in HapMap CEU (Caucasians of European descent from Utah) database [25,26]. The intronic SNPs rs261332 [26] and rs11858164 [27], and the promoter SNPs rs1532085 [28] and rs10468017 [29], were associated with HDL-C levels in genome-wide association studies. The promoter SNP rs1800588 showed an increase in HDL-C of 0.04 mmol/l in the CT group and 0.09 mmol/l in the TT group, compared with the CC carriers [30]. The promoter SNP rs2070895 showed a highly significant association with a 0.057 mmol/l increase in HDL-C per A allele (P = 8 × 10⁻¹⁰
) [24]. We investigated possible asso-ciations betweenLIPC SNPs or diplotypes and HDL-C levels in a Korean population consisting of 7,536 individuals.
Methods
Algorithm
A haplotype cluster is defined as a set of haplotypes. A diplotype is defined as a haplotype cluster pair, the defini-tion of which is extended from a haplotype pair. The diplotype is a homozygous diplotype or a heterozygous diplotype. LD blocks based on Gabriel et al. [31] or the Four Gamete algorithm [32] or the Solid Spine method (2), along with the haplotypes generated by EM algorithm, were used.
The first step produces LD blocks and any haplotypes for these LD blocks adjusting a threshold frequency, using Haploview tool.
The second step produces all possible haplotype pairs from SNP genotypes of samples employing PLINK, which implements the EM algorithm.
The third step starts with a set of haplotypes, H = {H1, ..., Hn}, which is obtained in the first step. Another set,
HS = {{H1}, ..., {Hn}}, consists of subsets with a single
element ofH. Repeat frequency is initialized to 0. The procedure in this step is as follows.
Procedure: If the length of the HS subset is greater than the repeat frequency and none of the elements of the HS subset are equal to any element of H, and the last element ofHS subset is less than each element of H, each element of H is added to HS subset. In this way, HS is updated and the repeat frequency increases by one. The procedure is repeated until the repeat fre-quency plus one is equal to the total number of H ele-ments. Table 1 represents an example of the input and output data (haplotype clusters) in the case ofH = {A, B, C, D}.
The fourth step produces the patterns of all possible diplotypes from the results of the third step. Table 2 represents an example of the output data in this step. The“*” in “{A}/*” indicates a set of all haplotypes except the“A“ haplotype. Therefore, the set includes not only the haplotypes with frequencies greater than a threshold, but also those with frequencies below a threshold.
In the final step, the diplotypes from samples are transformed into AA, AB, or BB formats according to the patterns of the diplotypes generated in the fourth step. For example, the diplotypes, “{A}/*”, consist of three possible diplotypes, “{A}{A}”, “{A}*”, or “**”, just as the SNP alleles (A/B) comprise three genotypes (AA, AB, or BB). That is, input formats for PLINK can be made from the diplotypes of samples in a population. At this point, linear or logistic regression analysis can be carried out by PLINK.
Software
Diplotyper is freely available on the website http://code. google.com/p/diplotyper/downloads/list.
Subjects
The population data used in the present study was pro-vided by the Korea Association Resource (KARE) project from the Korean Genome Epidemiology Study (KoGES), which is conducted by the Korean National Institute of Health (KNIH). A cross-sectional analysis of samples from urban and rural communities in Korea was con-ducted. The populations [33] were recruited from rural (Ansung) and urban (Ansan) communities in South Korea that were part of the KoGES, established in 2001. A total of 5,018 subjects from the Ansung community and 5,020 subjects from the Ansan community partici-pated in the present study. The age of the participants ranged from 40 to 69 years. A total of 8842 subjects remained after selection of samples for quality control purposes [33]. However, an additional 1,306 subjects who were undergoing treatment for hypertension, dia-betes, myocardial infarction or hyperlipidemia were excluded from the study since therapy for these condi-tions could change HDL-C levels. A detailed list of the
characteristics of the study participants is shown in Table 3.
Genotyping
AllLIPC 38 intronic SNPs available to the research com-munity through the KARE project from KoGES were ana-lyzed. The study protocol was approved by the Institutional Review Board of KNIH. The genotyping of the samples from the Ansung and Ansan cohorts was per-formed using the Affymetrix Genome-Wide Human SNP Array 5.0 (Affymetrix Inc., Santa Clara, CA, USA). The Bayesian Robust Linear Model with the Mahalanobis distance genotype-calling algorithm was used with the Affymetrix SNP array 5.0. The SNPs were filtered if any of the following criteria were met: i) a call rate lower than 95%, ii) a minor allele frequency (MAF) lower than 0.05, or iii) a significant deviation from the Hardy-Weinberg equilibrium (HWE) lower than 1 × 10⁻⁶.
Biochemical measures
Biochemical data from the KoGES were obtained through the KARE project. Blood samples were collected from the participants after at least eight hours of over-night fasting. HDL-C concentrations were measured with the Advia 1650 analyzer (Siemens, Tarrytown, NY, USA) for the Ansung and Ansan cohorts.
Statistical analyses
To examine possible associations betweenLIPC SNPs or diplotypes and HDL-C levels, linear regression analyses were conducted with adjustments for area, age, gender and body mass index (BMI). An additive model was assumed for this study. Log transformation was applied to HDL-C values to normalize their distribution. Associa-tions were evaluated as significant at a level of 0.05 after Bonferroni correction for multiple testing. This conserva-tive (Bonferroni) adjustment requiredP values of 2.23 × 10⁻⁴in HDL-C before correction, since testing of 224 independent hypotheses (38 single-locus and 186 diplo-type tests) for HDL-C was assumed. To determine the effects of SNPs and diplotypes, untransformed HDL-C concentrations were used. Statistical analyses were Table 1 Haplotype clusters.
Input H = {A, B, C, D}, HS = {{A}, {B}, {C}, {D}}, repeat frequency = 0
Output HS = {{A}, {B}, {C}, {D}, {A, B}, {A, C}, {A, D}, {B, C}, {B, D}, {C, D}, {A, B, C}, {A, B, D}, {A, C, D}, {B, C, D}, {A, B, C, D}}
Example of the input and output data (haplotype clusters) when H = {A, B, C, D}.
Table 2 Patterns of all possible diplotypes.
Output {A}/*, {B}/*, {C}/*, {D}/*, {A, B}/*, {A, C}/*, {A, D}/*, {B, C}/*, {B, D}/*, {C, D}/*, {A, B, C}/*, {A, B, D}/*, {A, C, D}/*, {B, C, D}/*, {A, B, C, D}/*
{A}/{B}, {A}/{C}, {A}/{D}, {B}/{C}, {B}/{D}, {C}/{D}, {A}/{B, C}, {A}/{B, D}, {A}/{C, D}, {B}/{A, C}, {B}/{A, D}, {B}/{C, D}, {C}/{A, B}, {C}/{A, D}, {C}/{B, D}, {D}/{A, B}, {D}/{A, C}, {D}/{B, C}, {A}/{B, C, D}, {B}/{A, C, D}, {C}/{A, B, D}, {D}/{A, B, C}, {A, B}/{C, D}, {A, C}/{B, D}, {A, D}/{B, C}
performed using PLINK version 1.07 (http://pngu.mgh. harvard.edu/~purcell/plink) and Python (version 2.7.1; Python Software Foundation, Wolfeboro Falls, NH).
Results
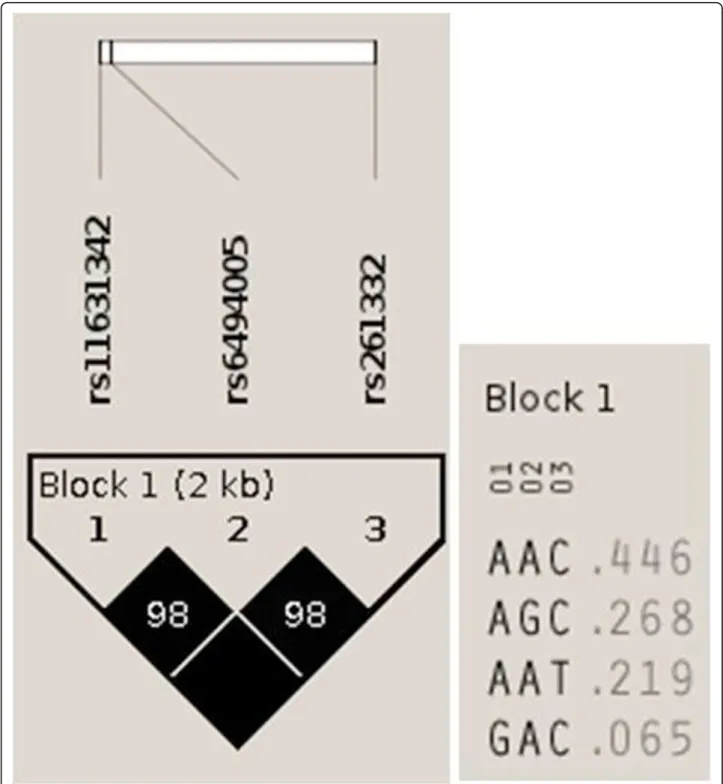
The total number of tests of association in the additive model were 224 for HDL-C (data not shown). As shown in Table 4, out of allLIPC 38 intronic SNPs available to the research community through the KARE project, only three SNPs were selected, since these were the only ones with strong associations with HDL-C that were able to withstand Bonferroni correction (P < 2.23 × 10⁻⁴, see Methods), on the basis of their diplotypes as well as their SNP genotypes. The SNP rs261332 had the strongest association (P value = 3.03 × 10⁻¹²
) with HDL-C levels. Figure 1 shows the LD block and the haplotypes for this block that exhibited frequencies of greater than the 1% threshold.
Table 5 represents the results of the Diplotyper tool, which indicate very diverse associations between diplo-types and HDL-C levels. The top 10 results out of the 40 diplotypes (data not shown) in block 1, in terms of P value, are shown. The abbreviation b1 means block 1, H12 means the twelfth haplotype cluster, and OH12(*) repre-sents all other haplotypes (including haplotypes below 1% frequency), except the H12 haplotype cluster; b1_H12 is a minor haplotype cluster and b1_OH12(*) a major haplo-type cluster. The number of one homozygous diplohaplo-type (a b1_H12 pair) was 612, the number of a heterozygous diplotype (b1_H12 and b1_OH12(*)) was 3,064, and the number of another homozygous diplotype (a b1_OH12(*)
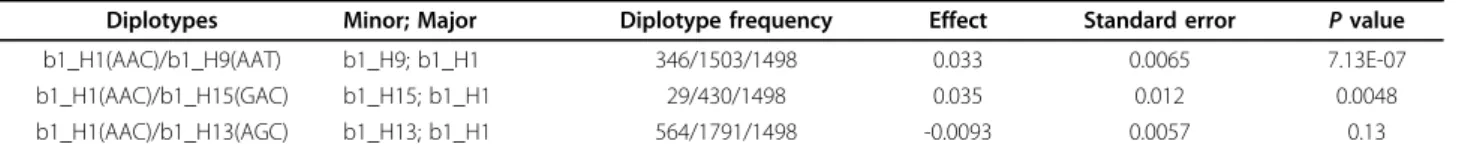
pair) was 3,858. The strongest association with HDL-C levels showed a P value of 9.09 × 10⁻¹⁹and was much stronger than theP value of the single SNP rs261332. Figure 2 shows the genealogical tree visualized from HapStar tool [34]. The haplotypes (AAT or GAC) were associated with higher HDL-C levels and the haplotypes (AAC or AGC) were associated with lower HDL-C levels. The association of AAC / AAT or GAC (different in bold) with HDL-C levels was statistically significant, but the asso-ciation of AAC/AGC (different in bold) with HDL-C levels was not statistically significant in (Table 6, Figure 1, 2).
HL plays a key role in the interconversion between two HDL subspecies and the indirect pathway of hepatic cho-lesterol uptake in reverse chocho-lesterol transport with invol-vement of HDL [13,14]. HDL-C levels are used clinically to evaluate the risk of developing cardiovascular disease [21]. The two SNPs (rs1800588 and rs2070895) in the pro-moter region are in almost perfect linkage disequilibrium (R2= 0.97) [24], and both the promoter SNP (rs1800588) and the intronic SNP (rs261332) show strong LD (R2= 0.92). The rs2070895 SNP showed a highly significant association, with a 0.057 mmol/l increase per A allele (P = 8 × 10⁻¹⁰) [24]. In the present study, the rs261332 showed a significant association (P = 3.03 × 10⁻¹²), with a 0.035 mmol/l increase per T allele. The rs11631342 also showed a significant association (P = 5.66 × 10⁻⁶), with a 0.037 mmol/l increase per G allele. The diplotypes b1_H12 (AAT-or-GAC)/b1_OH12(*) (Table 5) showed a strong association (P = 9.09 × 10⁻¹⁹
), with a 0.04 mmol/l increase per (AAT-or-GAC) haplotype cluster. Transporting cho-lesterol from peripheral tissues to the liver, HL interferes
Table 4 Associations of single SNPs.
SNP Minor; Major Genotype frequency Effect Standard error P value
rs11631342 G; A 29/923/6583 0.037 0.0083 5.66E-06
rs6494005 G; A 569/2891/4018 -0.023 0.0047 7.43E-07
rs261332 T; C 350/2617/4556 0.035 0.0049 3.03E-12
Associations of single SNPs with HDL-C levels.
Effect sizes (mmol/l) shown areb-coefficients and measured as additive effects, which correspond to the average change in HDL-C levels when one major allele is replaced with one minor allele.
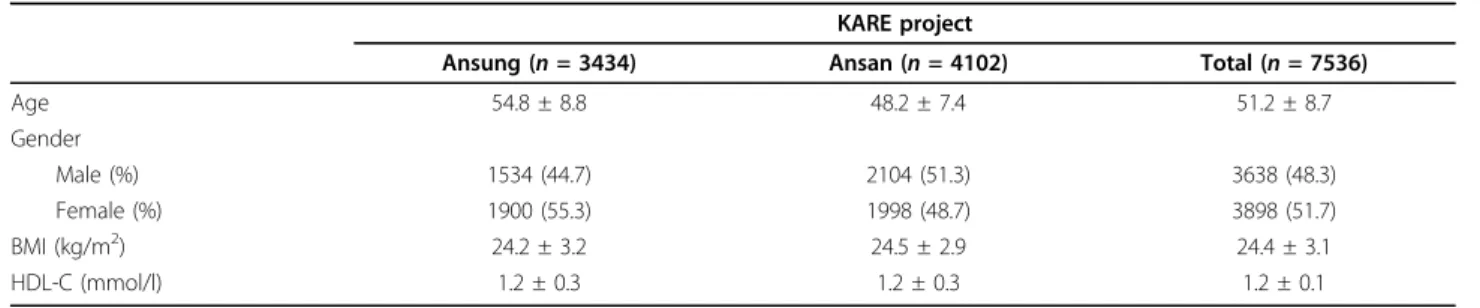
Table 3 Features of the study subjects.
KARE project
Ansung (n = 3434) Ansan (n = 4102) Total (n = 7536)
Age 54.8 ± 8.8 48.2 ± 7.4 51.2 ± 8.7 Gender Male (%) 1534 (44.7) 2104 (51.3) 3638 (48.3) Female (%) 1900 (55.3) 1998 (48.7) 3898 (51.7) BMI (kg/m2) 24.2 ± 3.2 24.5 ± 2.9 24.4 ± 3.1 HDL-C (mmol/l) 1.2 ± 0.3 1.2 ± 0.3 1.2 ± 0.1
Features of the study subjects included in the KARE project.
Data are represented as mean ± SD, or as the observed number followed by its corresponding percentage. BMI, body mass index; HDL, high-density lipoprotein.
with the interconversions of the mature HDL particles and acts on the triglyceride-rich HDL, which is able to undergo hydrolysis to form small HDL particles, which are then transported to begin anew the process of cholesterol uptake [13]. Therefore, carriers of rs261332 T-allele and rs11631342 G-allele may have high HDL-C levels. The
effect of these polymorphisms on HL synthesis may be an increased susceptibility to cardiovascular disease. The rs1800588 T-allele, rs2070895 A-allele, rs261332 T-allele, and rs11631342 G-allele may be of clinical relevance, and conferring protection against cardiovascular disease, as there is increasing evidence from population studies that
increasing HDL-C levels reduces the risk of cardiovascular disease [17-20]. This finding requires replication in an independent population sample.
Conclusions
Significant haplotype structure has been routinely inves-tigated to identify haplotypes carrying causative muta-tions. Many software tools like Haploview [2] and PLINK [3] provide statistical methods for haplotype association tests, most of which focus on only a single-haplotype. Notably, Durrant et al. showed through the
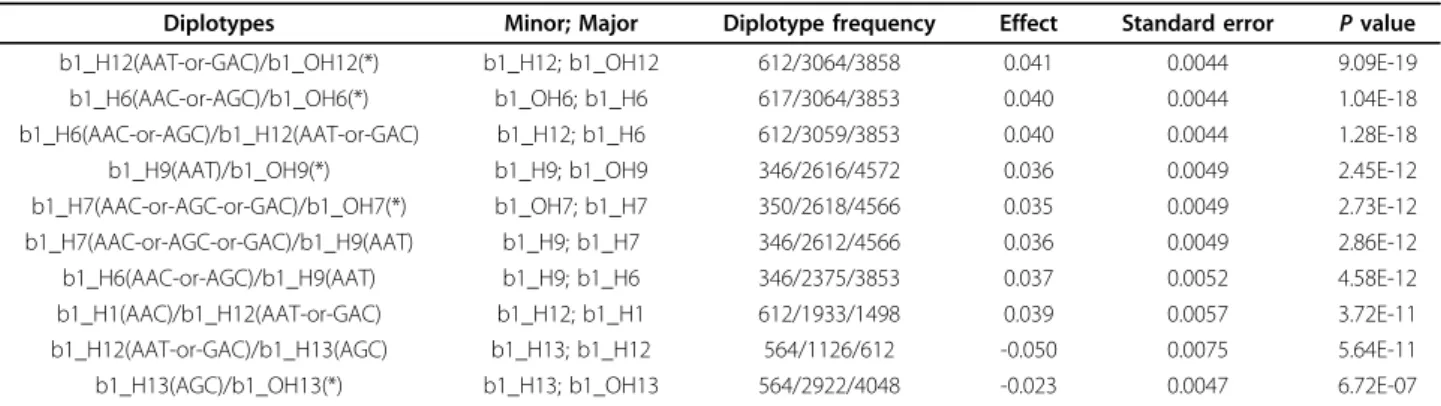
simulation studies and empirical data that their associa-tion analysis based on haplotype clusters had increased power over single-locus or single-haplotype tests [10]. That is, they demonstrated the superiority of haplotype cluster-based association analysis, which extended the previous method based on the single-haplotype. Never-theless, the haplotype cluster-based analysis can have the more limitation of association analysis compared with diplotype-based analysis as if allele-based analysis can have less diversity than genotype-based analysis. Meanwhile, Luo et al. demonstrated that DTR analysis Table 5 Associations of diplotypes.
Diplotypes Minor; Major Diplotype frequency Effect Standard error P value
b1_H12(AAT-or-GAC)/b1_OH12(*) b1_H12; b1_OH12 612/3064/3858 0.041 0.0044 9.09E-19
b1_H6(AAC-or-AGC)/b1_OH6(*) b1_OH6; b1_H6 617/3064/3853 0.040 0.0044 1.04E-18
b1_H6(AAC-or-AGC)/b1_H12(AAT-or-GAC) b1_H12; b1_H6 612/3059/3853 0.040 0.0044 1.28E-18
b1_H9(AAT)/b1_OH9(*) b1_H9; b1_OH9 346/2616/4572 0.036 0.0049 2.45E-12
b1_H7(AAC-or-AGC-or-GAC)/b1_OH7(*) b1_OH7; b1_H7 350/2618/4566 0.035 0.0049 2.73E-12
b1_H7(AAC-or-AGC-or-GAC)/b1_H9(AAT) b1_H9; b1_H7 346/2612/4566 0.036 0.0049 2.86E-12
b1_H6(AAC-or-AGC)/b1_H9(AAT) b1_H9; b1_H6 346/2375/3853 0.037 0.0052 4.58E-12
b1_H1(AAC)/b1_H12(AAT-or-GAC) b1_H12; b1_H1 612/1933/1498 0.039 0.0057 3.72E-11
b1_H12(AAT-or-GAC)/b1_H13(AGC) b1_H13; b1_H12 564/1126/612 -0.050 0.0075 5.64E-11
b1_H13(AGC)/b1_OH13(*) b1_H13; b1_OH13 564/2922/4048 -0.023 0.0047 6.72E-07
Associations of diplotypes with HDL-C levels (the top 10 results in terms of P value).
Effect sizes (mmol/l) shown areb-coefficients and measured as additive effects, which correspond to the average change in HDL-C levels when one major haplotype cluster is replaced with one minor haplotype cluster.
based on diplotypes outperformed other, more common association methods [11]; however, they did not apply haplotype clusters to the DTR analysis.
We developed a novel method that can yield a synergis-tic effect by combining the positive aspects of analyses based on haplotype clusters and diplotypes. The Diploty-per software employs Haploview tool, utilizing LD block and haplotypes with a frequency threshold. The software also uses PLINK tool to generate all possible haplotype pairs in given genotypes of samples and perform associa-tion analysis using linear or logistic regression. In addiassocia-tion to employing these existing software tools, we designed a new procedure to cluster haplotypes of interest from a large set of haplotypes and implemented a function to generate the patterns of all possible diplotypes from these haplotype clusters. Finally, a function to transform diplo-types into PLINK formats was implemented. All of these processes were fully automated. We tested our method by conducting an association analysis betweenLIPC SNPs or diplotypes and HDL-C levels. The result showed that our approach can identify more precise and distinct signals compared with single-locus tests.
List of abbreviations used
HDL: high-density lipoprotein; HDL-C: high-density lipoprotein cholesterol; LD: linkage disequilibrium; EM: Expectation-Maximization; SNP: single nucleotide polymorphism; HLA: human leukocyte antigen; ART: assisted reproduction treatments; DTR: diplotype trend regression; HL: hepatic lipase; CEU: Caucasians of European descent from Utah; KARE: Korea Association Resource; KoGES: Korean Genome Epidemiology Study; KNIH: Korean National Institute of Health; MAF: minor allele frequency; HWE: Hardy-Weinberg equilibrium; BMI: body mass index.
Authors’ contributions
SK designed the algorithm and implemented it for the Diplotyper, and drafted the manuscript. KK conceived of the haplotype cluster-based analysis and helped to draft the manuscript. IK carried out the statistical and physiological analyses. KP and JK participated in the design of the study and the statistical analysis. CS and NC performed data acquisition.
Competing interests
The authors declare that they have no competing interests. Acknowledgements
This study was supported by a grant from the Korea Health technology R&D Project, Ministry of Health & Welfare, Republic of Korea (A110749), grants from Korea Centers for Disease Control and Prevention (4845-301, 4851-302, 4851-307), and the Priority Centers Program of the National Research Foundation of Korea (NRF), which is funded by the Ministry of Education, Science, and Technology (No. 2009-0093821).
Declarations
The publication costs for this article were funded by the first author. This article has been published as part of BMC Medical Genomics Volume 6 Supplement 2, 2013: Selected articles from the Second Annual Translational Bioinformatics Conference (TBC 2012). The full contents of the supplement are available online at http://www.biomedcentral.com/bmcmedgenomics/ supplements/6/S2.
Author details
1Department of Biomedical Science, College of Life Science, CHA University,
Seongnam, Korea.2Department of Family Medicine, CHA Bundang Medical
Center, CHA University, Seongnam, Korea.3Division of Pulmonary and Critical Care Medicine, Department of Internal Medicine, Korea University Ansan Hospital, Ansan, Korea.4Department of Preventive Medicine, Ajou University School of Medicine, Suwon, Korea.5Department of Physiology, College of
Medicine, Hanyang University, Seoul, Korea. Published: 7 May 2013
References
1. A haplotype map of the human genome. Nature 2005, 437(7063):1299-1320.
2. Barrett JC, Fry B, Maller J, Daly MJ: Haploview: analysis and visualization of LD and haplotype maps. Bioinformatics 2005, 21(2):263-265.
3. Purcell S, Neale B, Todd-Brown K, Thomas L, Ferreira MA, Bender D, Maller J, Sklar P, de Bakker PI, Daly MJ, et al: PLINK: a tool set for whole-genome association and population-based linkage analyses. Am J Hum Genet 2007, 81(3):559-575.
4. Qin ZS, Niu T, Liu JS: Partition-ligation-expectation-maximization algorithm for haplotype inference with single-nucleotide polymorphisms. Am J Hum Genet 2002, 71(5):1242-1247.
5. Purcell S, Daly MJ, Sham PC: WHAP: haplotype-based association analysis. Bioinformatics 2007, 23(2):255-256.
6. Tregouet DA, Garelle V: A new JAVA interface implementation of THESIAS: testing haplotype effects in association studies. Bioinformatics 2007, 23(8):1038-1039.
7. Raymond CK, Kas A, Paddock M, Qiu R, Zhou Y, Subramanian S, Chang J, Palmieri A, Haugen E, Kaul R, et al: Ancient haplotypes of the HLA Class II region. Genome Res 2005, 15(9):1250-1257.
8. Liu PY, Zhang YY, Lu Y, Long JR, Shen H, Zhao LJ, Xu FH, Xiao P, Xiong DH, Liu YJ, et al: A survey of haplotype variants at several disease candidate genes: the importance of rare variants for complex diseases. J Med Genet 2005, 42(3):221-227.
9. Costa CH, Gelmini GF, Wowk PF, Mattar SB, Vargas RG, Roxo VM, Schuffner A, da Graca Bicalho M: HLA-G regulatory haplotypes and implantation outcome in couples who underwent assisted reproduction treatment. Hum Immunol 2012, 73:891-897.
10. Durrant C, Zondervan KT, Cardon LR, Hunt S, Deloukas P, Morris AP: Linkage disequilibrium mapping via cladistic analysis of single-nucleotide polymorphism haplotypes. Am J Hum Genet 2004, 75(1):35-43. 11. Luo X, Kranzler HR, Zuo L, Wang S, Schork NJ, Gelernter J: Diplotype trend
regression analysis of the ADH gene cluster and the ALDH2 gene: multiple significant associations with alcohol dependence. Am J Hum Genet 2006, 78(6):973-987.
12. Jansen H, Verhoeven AJ, Sijbrands EJ: Hepatic lipase: a pro- or anti-atherogenic protein? J Lipid Res 2002, 43(9):1352-1362.
13. Singh IM, Shishehbor MH, Ansell BJ: High-density lipoprotein as a therapeutic target: a systematic review. JAMA 2007, 298(7):786-798.
Table 6 Associations of diplotypes described in Figure 2.
Diplotypes Minor; Major Diplotype frequency Effect Standard error P value
b1_H1(AAC)/b1_H9(AAT) b1_H9; b1_H1 346/1503/1498 0.033 0.0065 7.13E-07
b1_H1(AAC)/b1_H15(GAC) b1_H15; b1_H1 29/430/1498 0.035 0.012 0.0048
b1_H1(AAC)/b1_H13(AGC) b1_H13; b1_H1 564/1791/1498 -0.0093 0.0057 0.13
Associations of diplotypes with HDL-C levels.
Effect sizes (mmol/l) shown areb-coefficients and measured as additive effects, which correspond to the average change in HDL-C levels when one major haplotype cluster is replaced with one minor haplotype cluster.
14. Zambon A, Deeb SS, Pauletto P, Crepaldi G, Brunzell JD: Hepatic lipase: a marker for cardiovascular disease risk and response to therapy. Curr Opin Lipidol 2003, 14(2):179-189.
15. Jacobs DR Jr, Mebane IL, Bangdiwala SI, Criqui MH, Tyroler HA: High density lipoprotein cholesterol as a predictor of cardiovascular disease mortality in men and women: the follow-up study of the Lipid Research Clinics Prevalence Study. Am J Epidemiol 1990, 131(1):32-47.
16. Aguilera CM, Gil-Campos M, Canete R, Gil A: Alterations in plasma and tissue lipids associated with obesity and metabolic syndrome. Clin Sci (Lond) 2008, 114(3):183-193.
17. Barter P, Gotto AM, LaRosa JC, Maroni J, Szarek M, Grundy SM, Kastelein JJ, Bittner V, Fruchart JC: HDL cholesterol, very low levels of LDL cholesterol, and cardiovascular events. N Engl J Med 2007, 357(13):1301-1310. 18. Gordon DJ, Probstfield JL, Garrison RJ, Neaton JD, Castelli WP, Knoke JD,
Jacobs DR Jr, Bangdiwala S, Tyroler HA: High-density lipoprotein cholesterol and cardiovascular disease. Four prospective American studies. Circulation 1989, 79(1):8-15.
19. Morehouse LA, Sugarman ED, Bourassa PA, Sand TM, Zimetti F, Gao F, Rothblat GH, Milici AJ: Inhibition of CETP activity by torcetrapib reduces susceptibility to diet-induced atherosclerosis in New Zealand White rabbits. J Lipid Res 2007, 48(6):1263-1272.
20. Belalcazar LM, Merched A, Carr B, Oka K, Chen KH, Pastore L, Beaudet A, Chan L: Long-term stable expression of human apolipoprotein A-I mediated by helper-dependent adenovirus gene transfer inhibits atherosclerosis progression and remodels atherosclerotic plaques in a mouse model of familial hypercholesterolemia. Circulation 2003, 107(21):2726-2732.
21. Assmann G, Cullen P, Schulte H: Simple scoring scheme for calculating the risk of acute coronary events based on the 10-year follow-up of the prospective cardiovascular Munster (PROCAM) study. Circulation 2002, 105(3):310-315.
22. Korea Center for Disease Control: The Fourth Korea National Health and Nutrition Examination Survey (KNHANES IV). 2007.
23. Guerra R, Wang J, Grundy SM, Cohen JC: A hepatic lipase (LIPC) allele associated with high plasma concentrations of high density lipoprotein cholesterol. Proc Natl Acad Sci USA 1997, 94(9):4532-4537.
24. Grarup N, Andreasen CH, Andersen MK, Albrechtsen A, Sandbaek A, Lauritzen T, Borch-Johnsen K, Jorgensen T, Schmitz O, Hansen T, et al: The -250G>A promoter variant in hepatic lipase associates with elevated fasting serum high-density lipoprotein cholesterol modulated by interaction with physical activity in a study of 16,156 Danish subjects. J Clin Endocrinol Metab 2008, 93(6):2294-2299.
25. Consortium. TIH: A haplotype map of the human genome. Nature 2005, 437(7063):1299-1320.
26. Saxena R, Voight BF, Lyssenko V, Burtt NP, de Bakker PI, Chen H, Roix JJ, Kathiresan S, Hirschhorn JN, Daly MJ, et al: Genome-wide association analysis identifies loci for type 2 diabetes and triglyceride levels. Science 2007, 316(5829):1331-1336.
27. Kooner JS, Chambers JC, Aguilar-Salinas CA, Hinds DA, Hyde CL, Warnes GR, Gomez Perez FJ, Frazer KA, Elliott P, Scott J, et al: Genome-wide scan identifies variation in MLXIPL associated with plasma triglycerides. Nat Genet 2008, 40(2):149-151.
28. Aulchenko YS, Ripatti S, Lindqvist I, Boomsma D, Heid IM, Pramstaller PP, Penninx BW, Janssens AC, Wilson JF, Spector T, et al: Loci influencing lipid levels and coronary heart disease risk in 16 European population cohorts. Nat Genet 2009, 41(1):47-55.
29. Willer CJ, Sanna S, Jackson AU, Scuteri A, Bonnycastle LL, Clarke R, Heath SC, Timpson NJ, Najjar SS, Stringham HM, et al: Newly identified loci that influence lipid concentrations and risk of coronary artery disease. Nat Genet 2008, 40(2):161-169.
30. Isaacs A, Sayed-Tabatabaei FA, Njajou OT, Witteman JC, van Duijn CM: The -514 C->T hepatic lipase promoter region polymorphism and plasma lipids: a meta-analysis. J Clin Endocrinol Metab 2004, 89(8):3858-3863. 31. Gabriel SB, Schaffner SF, Nguyen H, Moore JM, Roy J, Blumenstiel B,
Higgins J, DeFelice M, Lochner A, Faggart M, et al: The structure of haplotype blocks in the human genome. Science 2002, 296(5576):2225-2229.
32. Wang N, Akey JM, Zhang K, Chakraborty R, Jin L: Distribution of recombination crossovers and the origin of haplotype blocks: the interplay of population history, recombination, and mutation. Am J Hum Genet 2002, 71(5):1227-1234.
33. Cho YS, Go MJ, Kim YJ, Heo JY, Oh JH, Ban HJ, Yoon D, Lee MH, Kim DJ, Park M, et al: A large-scale genome-wide association study of Asian populations uncovers genetic factors influencing eight quantitative traits. Nat Genet 2009, 41(5):527-534.
34. Teacher AG, Griffiths DJ: HapStar: automated haplotype network layout and visualization. Mol Ecol Resour 2011, 11(1):151-153.
doi:10.1186/1755-8794-6-S2-S5
Cite this article as: Kim et al.: Diplotyper: diplotype-based association analysis. BMC Medical Genomics 2013 6(Suppl 2):S5.
Submit your next manuscript to BioMed Central and take full advantage of:
• Convenient online submission
• Thorough peer review
• No space constraints or color figure charges
• Immediate publication on acceptance
• Inclusion in PubMed, CAS, Scopus and Google Scholar
• Research which is freely available for redistribution
Submit your manuscript at www.biomedcentral.com/submit