This is an Open Access article distributed under the terms of the Creative Commons Attribution Non-Commercial License (http://creativecommons.org/licenses/by-nc/3.0/) which permits unrestricted non-commercial use, distribution, and reproduction in any medium, provided the original work is properly cited.
© 2015 The Korean Society of Clinical Nutrition Clin Nutr Res 2015;4:32-40
http://dx.doi.org/10.7762/cnr.2015.4.1.32 pISSN 2287-3732 ∙ eISSN 2287-3740
*Corresponding author Song Mi Lee
Address Department of Nutrition Services, Gangnam Severance Hospital, 211 Eonju-ro, Gangnam-gu, Seoul 135-720, Korea Tel +82-2-2019-2950 Fax +82-2-2019-4815 E-mail nutrpine@yuhs.ac Received December 17, 2014 Revised January 6, 2015 Accepted January 8, 2015
Introduction
Malnutrition is found in 43% to 88% of critically ill patients [1,2] and is known to increase the length of hospital stay as well as infection and mortality rates [3]. Therefore, it is very important to evaluate their nutritional status based on the use of proper validated methods. Traditionally, the nutritional assessment in critically ill patients has been evaluated using biochemical indicators such as serum albumin, total lympho-cyte count (TLC) and serum pre-albumin. Recently, however, objections have been raised against using these indicators for nutritional assessment, as such markers can be influenced by acute inflammation [4-6].
Bioelectrical impedance analysis (BIA) is a simple and nonin-vasive method which indirectly estimates body composition by
Use of Bioelectrical Impedance Analysis for the
Assessment of Nutritional Status in Critically Ill Patients
Yoojin Lee
1, Oran Kwon
1, Cheung Soo Shin
2, Song Mi Lee
3*
1Department of Clinical Health, Graduate School of Clinical Health Sciences, Ewha Woman’s University, Seoul
120-750, Korea
2Department of Anesthesiology and Pain Medicine, Yonsei University College of Medicine, Seoul 135-720, Korea
3Department of Nutrition Services, Gangnam Severance Hospital, Seoul 135-720, Korea
Malnutrition is common in the critically ill patients and known to cause a variety of negative clinical outcomes. However, vari-ous conventional methods for nutrition assessment have several limitations. We hypothesized that body composition data, as measured using bioelectrical impedance analysis (BIA), may have a significant role in evaluating nutritional status and predicting clinical outcomes in critically ill patients. We gathered clinical, biochemical, and BIA data from 66 critically ill patients admitted to an intensive care unit. Patients were divided into three nutritional status groups according to their serum albumin level and total lymphocyte counts. The BIA results, conventional indicators of nutrition status, and clinical outcomes were compared and analyzed retrospectively. Results showed that the BIA indices including phase angle (PhA), extracellular water (ECW), and ECW/ total body water (TBW) were significantly associated with the severity of nutritional status. Particularly, PhA, an indicator of the health of the cell membrane, was higher in the well-nourished patient group, whereas the edema index (ECW/TBW) was higher in the severely malnourished patient group. PhA was positively associated with albumin and ECW/TBW was negatively associated with serum albumin, hemoglobin, and duration of mechanical ventilation. In non-survivors, PhA was significantly lower and both ECW/TBW and %TBW/fat free mass were higher than in survivors. In conclusion, several BIA indexes including PhA and ECW/ TBW may be useful for nutritional assessment and represent significant prognostic factors in the care of critically ill patients.
sending a weak electric current throughout the body [7,8]. It has been shown that it can reliably reflect body composition and as-sociate with patient’s nutritional statuses or clinical outcomes.
Phase angle (PhA) in particular, one of the parameters of BIA that is related to cell size or integrity of the cell membrane [9], may be a suitable marker of nutritional assessment [10]. Kyle et al. demonstrated that PhA was shown to decrease with increased nutritional risk estimated by Nutritional Risk Screening 2002 or Subjective Global Assessment [9]. PhA is also useful indicator of prognosis and survival rate for patients with diseases such as human immunodeficiency virus infec-tion [11,12], chronic renal failure [13], and liver cirrhosis [14], as well as for patients on hemodialysis [15] or peritoneal dialysis [16]. Extracellular water/total body water (ECW/TBW) is also a suitable prognostic factor for critically ill patients. Monitor-ing it via BIA has been shown to lower re-hospitalization and mortality rates of patients hospitalized for acute heart failure [17]. Malnutrition refers to the loss of intracellular or body cell mass and expansion of extracellular mass [18,19]. Therefore, ECW/TBW as edema index or PhA as an index of healthy body cell mass could be useful indicators for nutritional assessment. Few studies to date have used BIA in the nutrition assess-ment of critically ill patients. This is because such patients are typically overhydrated and often have other common condi-tions that might cause errors in BIA [20]. Guidelines published by the European Society of Parenteral and Enteral Nutrition (ESPEN) suggest that this problem could be overcome to some extent by using segmental BIA or multifrequency BIA [8]. Fur-thermore, among BIA variables, PhA was reported to be less influenced by overhydration while being a good indicator of clinical outcome [12,21,22].
We hypothesized that BIA with high accessibility, conve-nience, and utility may effectively reflect the nutritional status of critically ill patients and help to meaningfully predict clinical outcomes. Hence, we compared conventional indicators of nu-tritional status such as serum albumin level, body mass index (BMI), and clinical outcomes with BIA results to verify their rel-evance in nutritional assessment and prediction of prognosis.
Materials and Methods
PatientsThis study was conducted between October 2012 and February 2013 and recruited 69 patients aged 18 years and older hospitalized in an intensive care unit (ICU) at Gangnam
Severance Hospital, Korea, and underwent BIA within 7 days after the admission. Based on the ESPEN guidelines [8], the following criteria were used to exclude subjects: patients with a pacemaker or implanted cardiac defibrillator; patients with a BMI > 34 kg/m2 or < 16 kg/m2; patients with any amputation;
patients with abnormal physical structure; patients with ascites and/or noticeable edema; patients with skin damage on the area where the electrodes of the BIA instrument were attached; patients who underwent dialysis 20 to 30 minutes before BIA; patients who had agreed to suspension of life-sustaining treatment before BIA; and lastly, patients with serious errors in their BIA results. Among 69 enrolled patients 3 patients were excluded because one of their BIA results appeared serious error or they consented to withdrawing life-sustaining treatment before BIA measurement. Finally, 66 patients were included in this study. The need for informed consent was waived by the Ewha Woman's University Institutional Review Board because of the following reasons: the BIA results and electronic medical records at the time of measurement did not include personal identifiable information (such as name, resident registration number, and hospital registration number); the research would not have caused any harm to the subjects; and the data were analyzed retrospectively.
Demographic, anthropometric, clinical and biochemical data
Electronic hospital medical records were reviewed to collect data for each patient, including age, diagnosis, height, weight, Acute Physiology Chronic Health Evaluation II score (APACHE II score), length of stay in hospital, length of stay in ICU, dura-tion of mechanical ventiladura-tion, and other notable characteris-tics. BMI was calculated as the body weight in kilograms divid-ed by height in square meters. Serum albumin level, TLC, and hemoglobin level on the day each patient’s BIA was performed were also collected from the electronic medical records.
Classification of nutritional status
Nutritional status was classified based on serum albumin level and TLC using criteria established in a previous study [23]. Patients whose serum albumin level was ≥ 3.5 g/dL and TLC was ≥ 1,400 cells/mm3 were classified into the
well-nourished group, those whose serum albumin level was < 2.8 g/dL and TLC was < 1,000 cells/mm3 were classified into the
severely malnourished group, and the remaining patients were classified into the moderately malnourished group.
BIA data
Inbody S10 (Biospace, Seoul, South Korea) was originally used for the measurements of medical purpose. To be pre-pared for the measurement, patients were in supine position as the manual of the machine. Their arms were separated from trunk and both legs were separated each other, for 30 to 45 degrees. BIA was performed with 8 surface electrodes placed on patient's thumbs and middle fingers and two sides of ankles. The BIA data gathered included intracellular water (ICW), ECW, TBW, ECW/TBW, %TBW/fat free mass (FFM), protein, minerals, soft lean mass (SLM), FFM, fat mass (FM), %body fat (%BF), skeletal muscle mass (SMM), body cell mass (BCM), and bone mineral content (BMC). PhA was calculated by using the sum of impedance and reactance of the right arm, trunk, and right leg and based on the following equation, PhA(˚) = (Reactance/Resistance) × (180˚/∏) [24]. The Inbody S10 device
calculates various reactance and resistance values for differ-ent areas and frequencies.
Statistical analysis
Statistical analysis was performed using SPSS 20.0 for Win-dows (SPSS Inc., Chicago, IL, USA), with statistical significance set at p < 0.05. Results are expressed as mean ± standard deviation. Continuous variables were compared and analyzed based on the independent sample t-test and analysis of vari-ance. Correlations were analyzed using partial Pearson's cor-relation analysis using age and APACHE II score as covariates. Non-survivors were excluded from the analyses related to clinical data, and any patients without exact clinical data due to transfer to/from another hospital were also excluded from the analysis of the relevant variable.
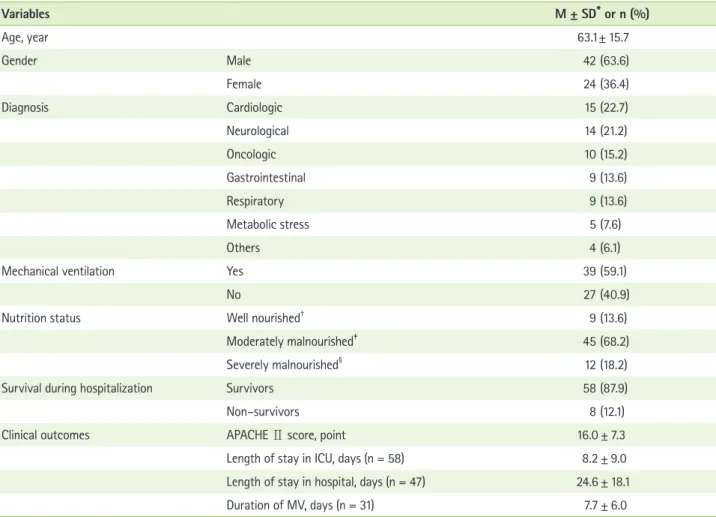
Table 1. General characteristics of the patients (n = 66)
Variables M ± SD* or n (%) Age, year 63.1 ± 15.7 Gender Male 42 (63.6) Female 24 (36.4) Diagnosis Cardiologic 15 (22.7) Neurological 14 (21.2) Oncologic 10 (15.2) Gastrointestinal 9 (13.6) Respiratory 9 (13.6) Metabolic stress 5 (7.6) Others 4 (6.1)
Mechanical ventilation Yes 39 (59.1)
No 27 (40.9)
Nutrition status Well nourished† 9 (13.6)
Moderately malnourished‡ 45 (68.2)
Severely malnourished§
12 (18.2)
Survival during hospitalization Survivors 58 (87.9)
Non–survivors 8 (12.1)
Clinical outcomes APACHE Ⅱ score, point 16.0 ± 7.3
Length of stay in ICU, days (n = 58) 8.2 ± 9.0 Length of stay in hospital, days (n = 47) 24.6 ± 18.1
Duration of MV, days (n = 31) 7.7 ± 6.0
APACHE Ⅱ score: age and the acute physiology chronic health evaluation Ⅱ score, ICU: Intensive care unit, MV: Mechanical ventilation.
*Mean ± Standard Deviation; †Serum albumin ≥ 3.5 g/dL & total lymphocyte counts ≥ 1,400 cells / mm3; ‡Serum albumin 2.8~3.5 & total lymphocyte counts
Results
The average age of the patients was 63.1, and 63.6% of them were male. Main diagnoses included cardiovascular disease (22.7%) and neurological disease (21.2%), which ac-counted for almost half of the patients. More than half of the patients (59.1%) used mechanical ventilation. Non-survivors accounted for 12.1% of the entire subjects. At the time of hospitalization, APACHEⅡ score of the subjects, which is an indicator of disease severity, was 16.0 ± 7.3 point; the average length of stay in hospital 24.6 ± 18.1 days, and length of stay in ICU and duration of mechanical ventilation 8.2 ± 9.0 days
and 7.7 ± 6.0 days, respectively. In terms of patients’ nutrition-al status, the moderately mnutrition-alnourished group accounted for 68.2% of the patients, and the severely malnourished group accounted for 18.2% (Table 1).
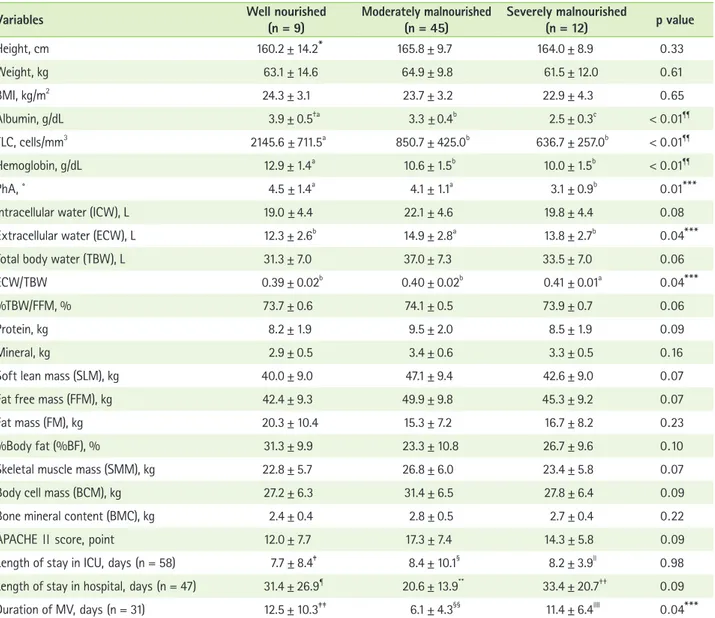
Table 2 provides a comparison of the anthropometric, bio-chemical, and BIA data according to the three different nutri-tional statuses. There were no significant differences in height and weight among the three groups. All biochemical test results were poorer in the group with lower nutritional status. Among the BIA data, variables with statistical significance (p < 0.05) were PhA, ECW, and ECW/TBW. PhA significantly
Table 2. Comparison of anthropometric, biochemical, BIA data, and clinical outcomes among the different nutrition status groups
Variables Well nourished(n = 9) Moderately malnourished(n = 45) Severely malnourished(n = 12) p value
Height, cm 160.2 ± 14.2* 165.8 ± 9.7 164.0 ± 8.9 0 . 33 Weight, kg 63.1 ± 14.6 64.9 ± 9.8 61.5 ± 12.0 0 . 61 BMI, kg/m2 24.3 ± 3.1 23.7 ± 3.2 22.9 ± 4.3 0 . 65 Albumin, g/dL 3.9 ± 0.5†a 3.3 ± 0.4b 2.5 ± 0.3c < 0 . 01¶¶ TLC, cells/mm3 2145.6 ± 711.5a 850.7 ± 425.0b 636.7 ± 257.0b < 0 . 01¶¶ Hemoglobin, g/dL 12.9 ± 1.4a 10.6 ± 1.5b 10.0 ± 1.5b < 0 . 01¶¶ PhA, ˚ 4.5 ± 1.4a 4.1 ± 1.1a 3.1 ± 0.9b 0 . 01***
Intracellular water (ICW), L 19.0 ± 4.4 22.1 ± 4.6 19.8 ± 4.4 0 . 08
Extracellular water (ECW), L 12.3 ± 2.6b 14.9 ± 2.8a 13.8 ± 2.7b 0 . 04***
Total body water (TBW), L 31.3 ± 7.0 37.0 ± 7.3 33.5 ± 7.0 0 . 06
ECW/TBW 0.39 ± 0.02b 0.40 ± 0.02b 0.41 ± 0.01a 0 . 04***
%TBW/FFM, % 73.7 ± 0.6 74.1 ± 0.5 73.9 ± 0.7 0 . 06
Protein, kg 8.2 ± 1.9 9.5 ± 2.0 8.5 ± 1.9 0 . 09
Mineral, kg 2.9 ± 0.5 3.4 ± 0.6 3.3 ± 0.5 0 . 16
Soft lean mass (SLM), kg 40.0 ± 9.0 47.1 ± 9.4 42.6 ± 9.0 0 . 07
Fat free mass (FFM), kg 42.4 ± 9.3 49.9 ± 9.8 45.3 ± 9.2 0 . 07
Fat mass (FM), kg 20.3 ± 10.4 15.3 ± 7.2 16.7 ± 8.2 0 . 23
%Body fat (%BF), % 31.3 ± 9.9 23.3 ± 10.8 26.7 ± 9.6 0 . 10
Skeletal muscle mass (SMM), kg 22.8 ± 5.7 26.8 ± 6.0 23.4 ± 5.8 0 . 07
Body cell mass (BCM), kg 27.2 ± 6.3 31.4 ± 6.5 27.8 ± 6.4 0 . 09
Bone mineral content (BMC), kg 2.4 ± 0.4 2.8 ± 0.5 2.7 ± 0.4 0 . 22
APACHE Ⅱ score, point 12.0 ± 7.7 17.3 ± 7.4 14.3 ± 5.8 0 . 09
Length of stay in ICU, days (n = 58) 7.7 ± 8.4‡ 8.4 ± 10.1§ 8.2 ± 3.9ll 0 . 98
Length of stay in hospital, days (n = 47) 31.4 ± 26.9¶ 20.6 ± 13.9** 33.4 ± 20.7†† 0 . 09
Duration of MV, days (n = 31) 12.5 ± 10.3‡‡ 6.1 ± 4.3§§ 11.4 ± 6.4llll 0 . 04*** BMI: body mass index, TLC: total lymphocyte count, PhA: phase angle, ECW/TBW: extracellular water/total body water, TBW/FFM: total body water/fat free mass, ICU: intensive care unit, MV: mechanical ventilation.
*Mean ± Standard Deviation; †Significant difference (p < 0.05) is indicated by lowercase alphabets based on analysis of variance with Bonferroni correction; ‡n = 9; §n = 39; lln = 10; ¶n = 7; **n = 31; ††n = 9; ‡‡n = 4; §§n = 22; lllln = 5; ¶¶p < 0.01; ***p < 0.05.
decreased with poorer nutritional status, while ECW/TBW, a known indicator of edema, increased by 0.01 with poorer nu-tritional status. Meanwhile, ECW was significantly higher in the moderately malnourished group than in the other two groups. Other body water indicators such as ICW, TBW, and %TBW/ FFM, and body composition indicators such as protein, SLM, FFM, SMM, BCM, mineral, and BMC were the highest in the moderately malnourished group, followed by the severely mal-nourished group and then the well-mal-nourished group. However, none of these results were significantly different. By contrast, FM was the lowest in the moderately malnourished group, followed by the severely malnourished group and then the well-nourished group, which also did not show any significant difference. There were no significant differences in APACHEⅡ score and length of stay in ICU or hospital. Duration of me-chanical ventilation reached at a significant difference and it was the highest in the well-nourished group, followed by the severely malnourished group and moderately malnourished group.
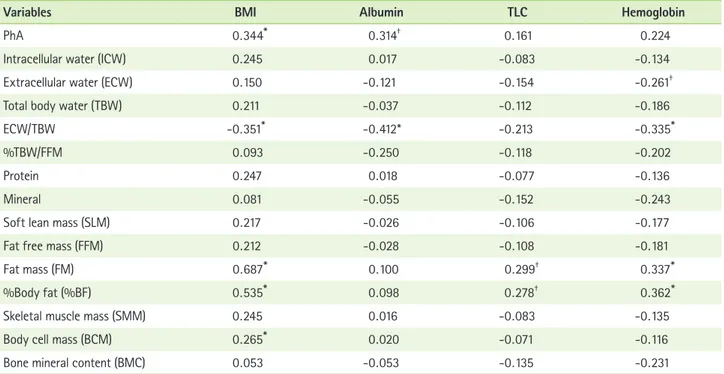
Table 3 shows the correlations between the BIA results and the common indicators of nutritional assessment, i.e., BMI, albumin level, TLC, and hemoglobin level. Considering that
these indicators can be influenced by age and critical illness, age and APACHE II score were included as covariates in the analysis. BIA variables that showed a significant positive cor-relation with BMI included PhA, FM, %BF, and BCM, whilst the only indicator that showed a negative correlation was ECW/ TBW. Among the biochemical indicators measured, significant positive correlations were found between serum albumin and PhA, and TLC and FM and %BF, as well as for hemoglo-bin and FM and %BF. By contrast, a negative correlation was found between albumin and ECW/TBW, and between hemo-globin and ECW and ECW/TBW. Overall, the BIA variables that showed a consistent correlation with two or more biochemical parameters and BMI were PhA, ECW/TBW, FM, and %BF.
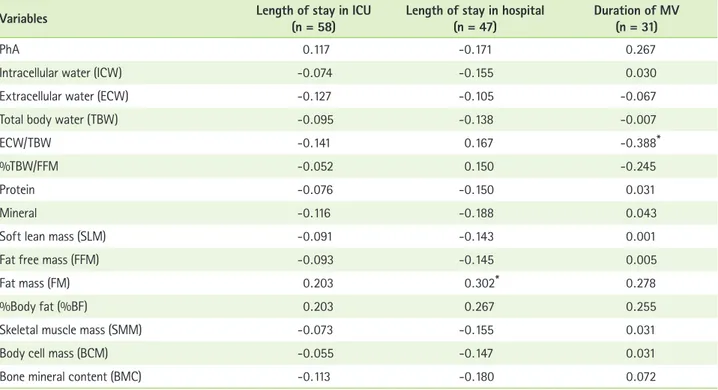
Table 4 shows the correlations between the BIA results and length of ICU stay, length of hospital stay, and duration of mechanical ventilation. The analyses were also adjusted for age and APACHE II score. A significant positive correlation was found between the length of hospital stay and FM, and a negative correlation was found between duration of mechani-cal ventilation and ECW/TBW. The length of ICU stay did not have a significant correlation with any indicators.
Table 5 shows the comparison of BMI, biochemical test
Table 3. Pearson’s correlation coefficients between BIA data and BMI and biochemical data (n = 66)
Variables BMI Albumin TLC Hemoglobin
PhA 0 . 344* 0 . 314†
0 . 161 0 . 224
Intracellular water (ICW) 0 . 245 0 . 017 -0 . 083 -0 . 134
Extracellular water (ECW) 0 . 150 -0 . 121 -0 . 154 -0 . 261†
Total body water (TBW) 0 . 211 -0 . 037 -0 . 112 -0 . 186
ECW/TBW -0 . 351* -0 . 412* -0 . 213 -0 . 335*
%TBW/FFM 0 . 093 -0 . 250 -0 . 118 -0 . 202
Protein 0 . 247 0 . 018 -0 . 077 -0 . 136
Mineral 0 . 081 -0 . 055 -0 . 152 -0 . 243
Soft lean mass (SLM) 0 . 217 -0 . 026 -0 . 106 -0 . 177
Fat free mass (FFM) 0 . 212 -0 . 028 -0 . 108 -0 . 181
Fat mass (FM) 0 . 687* 0 . 100 0 . 299† 0 . 337*
%Body fat (%BF) 0 . 535* 0 . 098 0 . 278† 0 . 362*
Skeletal muscle mass (SMM) 0 . 245 0 . 016 -0 . 083 -0 . 135
Body cell mass (BCM) 0 . 265* 0 . 020 -0 . 071 -0 . 116
Bone mineral content (BMC) 0 . 053 -0 . 053 -0 . 135 -0 . 231
Adjusted for age and APACHE II score.
BMI: body mass index, TLC: total lymphocyte count, PhA: phase angle, ECW/TBW: extracellular water/total body water, TBW/FFM: total body water/fat free mass.
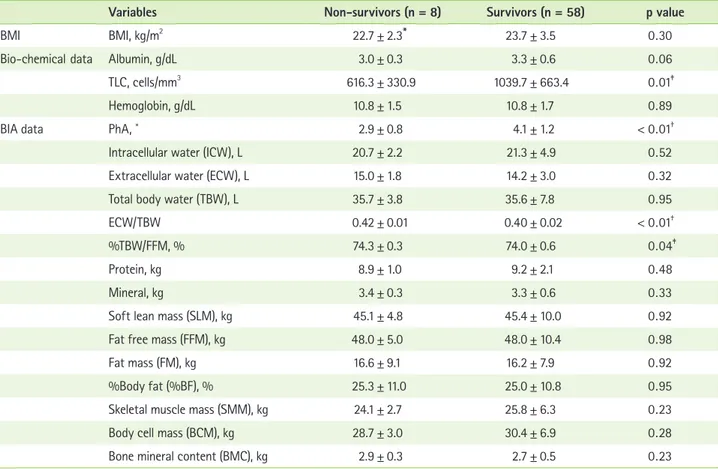
results, and BIA results between the patients who died dur-ing hospitalization and those who survived. The number of patients who died during hospitalization was 8, which was not high; however, statistical significance was observed for many variables. There was no significant difference in BMI, serum albumin level, or hemoglobin levels, but the TLC was signifi-cantly lower among non-survivors than survivors. Among the BIA results, the PhA of non-survivors was significantly lower than that of survivors, and ECW/TBW and %TBW/FFM, which are indicators of fluid retention, were significantly higher (p < 0.05) among non-survivors than survivors. No significant dif-ference was found in FFM, FM, or mineral, which represent de facto body composition.
Discussion
In nutritional assessment, “reduction of lean body mass” and “functional disability” have emerged as new assessment factors [25]. Given that many critically ill patients undergo a rapid change in body composition due to the occurrence of the disease itself and hypermetabolism, monitoring body composition in the ICU can be very useful for nutritional and
medical intervention. Previous research suggests that changes in body composition as measured by BIA have a significant correlation with energy and protein intake. It implies the pos-sibility of using BIA as part of an extensive nutrition care process for critically ill patients from nutritional assessment to intervention and monitoring [26].
The basic principle of BIA assumes human body as a uniform cylinder with constant conductivity. In this hypothesis, the re-sistance is proportional to its length and inversely proportional to its cross sectional area. Using this principle, an empirical re-lationship that estimates body water or body composition can be established [7].
In this study, PhA and ECW/TBW, both of which are variables commonly evaluated in many BIA-related studies [7-10,17], were found as meaningful factors for nutrition assessment or prediction of clinical outcomes.
PhA is calculated from resistance and reactance as (Re-actance/Resistance) × (180˚/∏) [24]. Reactance means the capacitance behavior of tissues and is associated with cellular-ity, cell size and integrity of the cell membrane. On the other hand, resistance means pure resistive behavior of tissue and is dependent on lean tissue mass and tissue hydration. This
sup-Table 4. Pearson’s correlation coefficients between BIA data and clinical outcomes
Variables Length of stay in ICU(n = 58) Length of stay in hospital(n = 47) Duration of MV(n = 31)
PhA 0 . 117 -0 . 171 0 . 267
Intracellular water (ICW) -0 . 074 -0 . 155 0 . 030
Extracellular water (ECW) -0 . 127 -0 . 105 -0 . 067
Total body water (TBW) -0 . 095 -0 . 138 -0 . 007
ECW/TBW -0 . 141 0 . 167 -0 . 388*
%TBW/FFM -0 . 052 0 . 150 -0 . 245
Protein -0 . 076 -0 . 150 0 . 031
Mineral -0 . 116 -0 . 188 0 . 043
Soft lean mass (SLM) -0 . 091 -0 . 143 0 . 001
Fat free mass (FFM) -0 . 093 -0 . 145 0 . 005
Fat mass (FM) 0 . 203 0 . 302* 0 . 278
%Body fat (%BF) 0 . 203 0 . 267 0 . 255
Skeletal muscle mass (SMM) -0 . 073 -0 . 155 0 . 031
Body cell mass (BCM) -0 . 055 -0 . 147 0 . 031
Bone mineral content (BMC) -0 . 113 -0 . 180 0 . 072
Adjusted for age and APACHE II score.
ICU: intensive care unit, MV: mechanical ventilation, PhA: phase angle, ECW/TBW: extracellular water/total body water, TBW/FFM: total body water/fat free mass.
ports the idea that PhA is a measure of cell mass and nutri-tional risk [9]. The results of this study showed that PhA clearly decreased to 4.1˚ in moderate malnutrition and decreased to 3.1˚ in severe malnutrition, which was lower than the PhA cutoff for estimating nutritional status proposed in previous research (5˚ for male patients and 4.6˚ for female patients) [10]. PhA also showed a significant positive correlation with al-bumin. Besides, ECW/TBW, which is an index of edema, had a significant negative correlation with albumin and hemoglobin level and consistently increased with poorer nutritional status. Considering that acute inflammation or hypoalbuminemia caused by malnutrition is known to cause edema and that low PhA indicates malnutrition [9], this result proves the utility of BIA in the nutritional assessment of critically ill patients.
In previous studies, ECW/TBW has been also found to be a good prognostic factor for different diseases such as acute heart failure [17], renal disease [27], and liver disease [28]. In this study, ECW/TBW showed a significant negative correlation with duration of mechanical ventilation. Research has shown
that excessive accumulation of fluid is correlated with a lower survival rate and longer duration of mechanical ventilation [29], whereas a decrease in ECW and diuresis has been seen as signs of improvement [30].
In critical patients, there are number of influences on mor-tality including age and disease status. Nevertheless, PhA and ECW/TBW, known survival and prognostic factors on the basis of previous researches [8,10-17,30], have shown its potential for predicting survival. Especially the average level of PhA was significantly different between non-survivors (2.89˚) and survivors (4.11˚), both of which were much lower than 5.3˚, which is the PhA cutoff score proposed in previous research for significant survival prediction of lung cancer patients [31]. Although much research has been conducted on the PhA cut-off for estimating survival rate of various diseases [22,31,32], there was no precise comparison criteria in this study. More-over, the number of non-survivors was too small to develop a PhA cutoff score.
Meanwhile, ECW also showed statistical significance
ac-Table 5. Comparison of BMI, biochemical data, and BIA data between survivors and non-survivors
Variables Non-survivors (n = 8) Survivors (n = 58) p value
BMI BMI, kg/m2 22.7 ± 2.3* 23.7 ± 3.5 0 . 30
Bio-chemical data Albumin, g/dL 3.0 ± 0.3 3.3 ± 0.6 0 . 06
TLC, cells/mm3 616.3 ± 330.9 1039.7 ± 663.4 0 . 01‡
Hemoglobin, g/dL 10.8 ± 1.5 10.8 ± 1.7 0 . 89
BIA data PhA, ˚ 2.9 ± 0.8 4.1 ± 1.2 < 0 . 01†
Intracellular water (ICW), L 20.7 ± 2.2 21.3 ± 4.9 0 . 52
Extracellular water (ECW), L 15.0 ± 1.8 14.2 ± 3.0 0 . 32
Total body water (TBW), L 35.7 ± 3.8 35.6 ± 7.8 0 . 95
ECW/TBW 0.42 ± 0.01 0.40 ± 0.02 < 0 . 01†
%TBW/FFM, % 74.3 ± 0.3 74.0 ± 0.6 0 . 04‡
Protein, kg 8.9 ± 1.0 9.2 ± 2.1 0 . 48
Mineral, kg 3.4 ± 0.3 3.3 ± 0.6 0 . 33
Soft lean mass (SLM), kg 45.1 ± 4.8 45.4 ± 10.0 0 . 92
Fat free mass (FFM), kg 48.0 ± 5.0 48.0 ± 10.4 0 . 98
Fat mass (FM), kg 16.6 ± 9.1 16.2 ± 7.9 0 . 92
%Body fat (%BF), % 25.3 ± 11.0 25.0 ± 10.8 0 . 95
Skeletal muscle mass (SMM), kg 24.1 ± 2.7 25.8 ± 6.3 0 . 23
Body cell mass (BCM), kg 28.7 ± 3.0 30.4 ± 6.9 0 . 28
Bone mineral content (BMC), kg 2.9 ± 0.3 2.7 ± 0.5 0 . 23
BMI: body mass index, TLC: total lymphocyte count, BIA: bioelectrical impedance analysis, PhA: phase angle, ECW/TBW: extracellular water/total body water, TBW/FFM: total body water/fat free mass.
cording to nutritional status; however, the change according to nutritional status was not consistent. ECW is an indicator of absolute water content that can be largely influenced by sex and the physique of individual subjects, and, therefore, is probably limited in its ability to reflect edema as caused by malnutrition.
FM and %BF showed a significant positive correlation with TLC and hemoglobin level. However, significant or non-significant positive correlations were also found for some of the clinical outcome indicators with them. According to meta-analysis studies based on a large number of papers, although obesity in critically ill patients acted as a protective factor against mortality, it increased length of ICU stay and duration of mechanical ventilation. As potential causes, it was suggest-ed that non-obese patients disuggest-ed in a relatively short period af-ter admission because they were already losing weight due to malnutrition and disease even prior to hospitalization. Obese patients have low mortality rates because of preserved nutri-tion. However, apart from mortality, the duration of mechani-cal ventilation could have been prolonged owing to airway resistance and deteriorated efficiency of respiratory muscles [33,34].
Most of the clinical outcomes did not show any significant difference or consistent change according to nutritional sta-tus. These results could be due to uneven patient distribution or the fact that sample sizes of some groups were very small. There was significant difference in duration mechanical venti-lation, but it was not shown in post hoc analysis.
Overall, this study was not without its strengths and limi-tation. The strengths of this study are that it evaluated the utility of BIA as a noninvasive method of nutritional assess-ment for critically ill patients. Moreover, the results of this study are valuable because there has been very little research to date that has examined the role of BIA in the clinical care of critically ill patients, as well as evaluated the significance of many other BIA variables, particularly that of body water or PhA instead of the usual markers of just FM or FFM. Hav-ing said that, however, the analysis was limited owHav-ing to the small sample size and the fact that it was based in a single center, at one point in time without comparison, whilst sex differences were not taken into account for BMI and BIA data. Furthermore, many previous BIA studies select their subjects based on their disease state [11-17,24,27,28,31,32], which the guidelines recommend [8]; however, it was not possible to classify subjects according to disease in this study owing to the small sample size. Although no substantial one-to-one
correlation was found among the individual variables owing to these limitations, it may have been better to compare BIA results with various indicators and monitor them over several days in a clinical field wherein various indicators are observed together to aid clinical decision. This study showed some po-tential utility of BIA for nutritional assessment in ICU. Though, to be more certain about effectiveness of BIA, various further studies are needed.
Conclusion
BIA is a useful method in the nutritional assessment and prognosis of critically ill patients. Low PhA and high ECW/ TBW can significantly imply malnutrition; these variables also showed significant correlations with biochemical data, which are conventional nutritional assessment indicators. High ECW/ TBW was correlated with long duration of mechanical ventila-tion. PhA was also lower and ECW/TBW higher among non-survivors than non-survivors, which implies utility of BIA for pre-dicting survival rate.
Conflict of Interests
No conflict interests were declared by any of the authors.
References
1. Giner M, Laviano A, Meguid MM, Gleason JR. In 1995 a correlation between malnutrition and poor outcome in critically ill patients still ex-ists. Nutrition 1996;12:23-9.
2. Barr J, Hecht M, Flavin KE, Khorana A, Gould MK. Outcomes in critically ill patients before and after the implementation of an evidence-based nutritional management protocol. Chest 2004;125:1446-57.
3. Kyle UG, Pirlich M, Schuetz T, Lochs H, Pichard C. Is nutritional deple-tion by Nutrideple-tional Risk Index associated with increased length of hospital stay? A population-based study. JPEN J Parenter Enteral Nutr 2004;28:99-104.
4. National Alliance for Infusion Therapy and the American Society for Parenteral and Enteral Nutrition Public Policy Committee and Board of Directors. Disease-related malnutrition and enteral nutrition therapy: a significant problem with a cost-effective solution. Nutr Clin Pract 2010;25:548-54.
5. Jensen GL, Bistrian B, Roubenoff R, Heimburger DC. Malnutrition syndromes: a conundrum vs continuum. JPEN J Parenter Enteral Nutr 2009;33:710-6.
6. Jensen GL, Mirtallo J, Compher C, Dhaliwal R, Forbes A, Grijalba RF, Har-dy G, Kondrup J, Labadarios D, Nyulasi I, Castillo Pineda JC, Waitzberg D; International Consensus Guideline Committee. Adult starvation and disease-related malnutrition: a proposal for etiology-based diagnosis in the clinical practice setting from the International Consensus Guideline Committee. JPEN J Parenter Enteral Nutr 2010;34:156-9.
7. Kyle UG, Bosaeus I, De Lorenzo AD, Deurenberg P, Elia M, Gómez JM, Heitmann BL, Kent-Smith L, Melchior JC, Pirlich M, Scharfetter H, Schols AM, Pichard C; Composition of the ESPEN Working Group. Bioelectrical impedance analysis--part I: review of principles and methods. Clin Nutr 2004;23:1226-43.
8. Kyle UG, Bosaeus I, De Lorenzo AD, Deurenberg P, Elia M, Manuel Gómez J, Lilienthal Heitmann B, Kent-Smith L, Melchior JC, Pirlich M, Scharfetter H, M W J Schols A, Pichard C; ESPEN. Bioelectrical impedance analysis-part II: utilization in clinical practice. Clin Nutr 2004;23:1430-53.
9. Kyle UG, Genton L, Pichard C. Low phase angle determined by bioelec-trical impedance analysis is associated with malnutrition and nutri-tional risk at hospital admission. Clin Nutr 2013;32:294-9.
10. Kyle UG, Soundar EP, Genton L, Pichard C. Can phase angle determined by bioelectrical impedance analysis assess nutritional risk? A comparison between healthy and hospitalized subjects. Clin Nutr 2012;31:875-81. 11. Ott M, Fischer H, Polat H, Helm EB, Frenz M, Caspary WF, Lembcke B.
Bioelectrical impedance analysis as a predictor of survival in patients with human immunodeficiency virus infection. J Acquir Immune Defic Syndr Hum Retrovirol 1995;9:20-5.
12. Schwenk A, Beisenherz A, Römer K, Kremer G, Salzberger B, Elia M. Phase angle from bioelectrical impedance analysis remains an inde-pendent predictive marker in HIV-infected patients in the era of highly active antiretroviral treatment. Am J Clin Nutr 2000;72:496-501. 13. Bellizzi V, Terracciano V, Gaudiano G, Cianciaruso B, De Nicola L, Di
Iorio B. Early changes of body composition detected by bioimpedance analysis can predict survival in CRF. J Am Soc Nephrol 1998;9:140A. 14. Selberg O, Selberg D. Norms and correlates of bioimpedance phase
angle in healthy human subjects, hospitalized patients, and patients with liver cirrhosis. Eur J Appl Physiol 2002;86:509-16.
15. Maggiore Q, Nigrelli S, Ciccarelli C, Grimaldi C, Rossi GA, Michelassi C. Nutritional and prognostic correlates of bioimpedance indexes in he-modialysis patients. Kidney Int 1996;50:2103-8.
16. Fein PA, Gundumalla G, Jorden A, Matza B, Chattopadhyay J, Avram MM. Usefulness of bioelectrical impedance analysis in monitoring nu-trition status and survival of peritoneal dialysis patients. Adv Perit Dial 2002;18:195-9.
17. Liu MH, Wang CH, Huang YY, Tung TH, Lee CM, Yang NI, Liu PC, Cherng WJ. Edema index established by a segmental multifrequency bioelectri-cal impedance analysis provides prognostic value in acute heart failure. J Cardiovasc Med (Hagerstown) 2012;13:299-306.
18. Moore FD. The body cell mass and its supporting environment: body composition in health and disease. Philadelphia (PA): W.B. Saunders Co.;1963.
19. Hoffer LJ. Clinical nutrition: 1. Protein-energy malnutrition in the inpa-tient. CMAJ 2001;165:1345-9.
20. Barak N, Wall-Alonso E, Cheng A, Sitrin MD. Use of bioelectrical imped-ance analysis to predict energy expenditure of hospitalized patients receiving nutrition support. JPEN J Parenter Enteral Nutr 2003;27:43-6. 21. Barbosa-Silva MC, Barros AJ. Bioelectrical impedance analysis in
clini-cal practice: a new perspective on its use beyond body composition
equations. Curr Opin Clin Nutr Metab Care 2005;8:311-7.
22. Bosy-Westphal A, Danielzik S, Dörhöfer RP, Later W, Wiese S, Müller MJ. Phase angle from bioelectrical impedance analysis: population ref-erence values by age, sex, and body mass index. JPEN J Parenter Enteral Nutr 2006;30:309-16.
23. Lee S, Choi M, Kim Y, Lee J, Shin C. Nosocomial infection of malnour-ished patients in an intensive care unit. Yonsei Med J 2003;44:203-9. 24. Gupta D, Lammersfeld CA, Vashi PG, King J, Dahlk SL, Grutsch JF, Lis
CG. Bioelectrical impedance phase angle as a prognostic indicator in breast cancer. BMC Cancer 2008;8:249.
25. White JV, Guenter P, Jensen G, Malone A, Schofield M; Academy of Nu-trition and Dietetics MalnuNu-trition Work Group; A.S.P.E.N. MalnuNu-trition Task Force; A.S.P.E.N. Board of Directors. Consensus statement of the Academy of Nutrition and Dietetics/American Society for Parenteral and Enteral Nutrition: characteristics recommended for the identifica-tion and documentaidentifica-tion of adult malnutriidentifica-tion (undernutriidentifica-tion). J Acad Nutr Diet 2012;112:730-8.
26. Robert S, Zarowitz BJ, Hyzy R, Eichenhorn M, Peterson EL, Popovich J Jr. Bioelectrical impedance assessment of nutritional status in critically ill patients. Am J Clin Nutr 1993;57:840-4.
27. Fan S, Sayed RH, Davenport A. Extracellular volume expansion in peri-toneal dialysis patients. Int J Artif Organs 2012;35:338-45.
28. Sakata M, Kawaguchi T, Taniguchi E, Nakayama A, Ishizaki S, Sonaka I, Nakamura T, Itou M, Oriishi T, Abe M, Yanagimoto C, Koga H, Sata M. Oxidized albumin is associated with water retention and severity of disease in patients with chronic liver diseases. E Spen Eur E J Clin Nutr Metab 2010;5:e247-53.
29. Schuller D, Mitchell JP, Calandrino FS, Schuster DP. Fluid balance during pulmonary edema. Is fluid gain a marker or a cause of poor outcome? Chest 1991;100:1068-75.
30. Jacobs DO. Use of bioelectrical impedance analysis measure-ments in the clinical management of critical illness. Am J Clin Nutr 1996;64:498S-502S.
31. Gupta D, Lammersfeld CA, Vashi PG, King J, Dahlk SL, Grutsch JF, Lis CG. Bioelectrical impedance phase angle in clinical practice: implica-tions for prognosis in stage IIIB and IV non-small cell lung cancer. BMC Cancer 2009;9:37.
32. Mushnick R, Fein PA, Mittman N, Goel N, Chattopadhyay J, Avram MM. Relationship of bioelectrical impedance parameters to nutrition and survival in peritoneal dialysis patients. Kidney Int Suppl 2003:S53-6. 33. Oliveros H, Villamor E. Obesity and mortality in critically ill adults:
a systematic review and meta-analysis. Obesity (Silver Spring) 2008;16:515-21.
34. Akinnusi ME, Pineda LA, El Solh AA. Effect of obesity on intensive care morbidity and mortality: a meta-analysis. Crit Care Med 2008;36:151-8.