저작자표시-비영리-변경금지 2.0 대한민국 이용자는 아래의 조건을 따르는 경우에 한하여 자유롭게 l 이 저작물을 복제, 배포, 전송, 전시, 공연 및 방송할 수 있습니다. 다음과 같은 조건을 따라야 합니다: l 귀하는, 이 저작물의 재이용이나 배포의 경우, 이 저작물에 적용된 이용허락조건 을 명확하게 나타내어야 합니다. l 저작권자로부터 별도의 허가를 받으면 이러한 조건들은 적용되지 않습니다. 저작권법에 따른 이용자의 권리는 위의 내용에 의하여 영향을 받지 않습니다. 이것은 이용허락규약(Legal Code)을 이해하기 쉽게 요약한 것입니다. Disclaimer 저작자표시. 귀하는 원저작자를 표시하여야 합니다. 비영리. 귀하는 이 저작물을 영리 목적으로 이용할 수 없습니다. 변경금지. 귀하는 이 저작물을 개작, 변형 또는 가공할 수 없습니다.
A THESIS FOR THE DEGREE OF MASTER SCIENCE
Structural change of coating layer
by S/A latex with HEMA monomer and its effects
on the coated paper properties
S/A라텍스의 HEMA 함량이 코팅층 구조 변화와
코팅지 특성에 미치는 영향
Advisor Professor: Dr. Hak Lae Lee
By Soojin Kwon
PROGRAM IN ENVIRONMENTAL MATERIALS SCIENCE DEPARTMENT OF FOREST SCIENCES
GRADUATE SCHOOL SEOUL NATIONAL UNIVERSITY
i
ABSTRACT
Structural change of coating layer
by S/A latex with HEMA monomer and its effects
on the coated paper properties
Soojin Kwon Program in Environmental Materials Science Department of Forest Sciences Graduate School Seoul National University
Coatings are a widely used surface treatment in many industries, including the paper industry. By applying an aqueous coating, high-quality paper with improved surface appearance and good printability can be obtained. In this regard, the coating structure determines surface properties. Coatings generally comprise a pigment, a binder, and additives, and each component has a profound influence on the coating structure. Above all, the binder plays a major role in maintaining the coating structure by binding all of the components together. In addition, binders are the main cause of shrinkage during drying. Therefore, binders are an integral component in the formation of coating layers, and the properties of a binder can change the coating structure.
ii
Styrene acrylate (S/A) latex and styrene butadiene (S/B) latex are among the most popular synthetic binders in the paper industry, and their properties can change significantly depending on the composition of the raw materials. For instance, changes in the monomer composition or polymerization condition give latexes with different glass transition temperatures, crosslinking degrees, or particle sizes. The use of functional monomers in latex polymerization can also significantly change the coated paper.
In this research, we evaluated the properties of S/A latex binders containing different amounts of hydrophilic hydroxyethyl methacrylate (HEMA), which facilitates hydration and causes polymer swelling, as a functional monomer. To investigate the properties of the coating color and coated paper as a function of the HEMA content in S/A latexes, the HEMA monomer content was varied from 0 to 9%. The properties of and relationships between the binder and the coated paper properties were investigated.
The HEMA monomer was found to have a significant effect on the swelling of the S/A latex particles. Swelling in an alkaline condition, caused by the ionization of the carboxyl group, increased with increasing HEMA content. This result corresponds to previous findings. This swelling resulted in the fast immobilization of the coating layer, shown when the drying kinetics of the coating layer were monitored by multispeckle-diffusing wave spectroscopy (MS-DWS). In addition, swollen latex particles and faster immobilization resulted in a more porous structure, with uniform binder distribution in the
z-iii
direction. However, the shrinkage rate of the coating layer increased with the faster immobilization.
The properties of the coated paper were profoundly affected by the structural changes. The shrinkage of the coating layer made a rougher surface, which decreased the gloss of the coated paper. However, although the gloss of the coated paper deceased, the print gloss improved because of a decrease in ink absorbency. In addition, the uniform surface and coating structure contributed positively to other printing properties, such as pick resistance and print mottle.
Keywords: Hydroxyethyl Methacrylate, Styrene Acrylate latex, Drying kinetics, Binder migration, Pore structure, Ink absorption, Print mottle
iv
CONTENTS
1. Introduction ... 1
2. Literature reviews ... 4
2.1 Styrene-Acrylate latex ... 4
2.2 Characteristics of HEMA and latex swelling ... 6
2.3 Coating structure ... 8
2.4 Binder migration ... 11
2.5 Printability ... 15
3. Experimental ... 20
3.1 Materials ... 20
3.2 Formulation and preparation of coating color ... 21
3.3 Swelling of latex particles ... 23
3.4 Coating color properties ... 26
3.5 Coating layer properties ... 27
3.5.1 Drying kinetics ... 27
3.5.2 Coating structure ... 29
3.5.3 Shrinkage rate ... 30
3.6 Coated paper properties... 31
3.6.1 Coated paper preparation ... 31
3.6.2 Surface structure ... 31
v 3.6.4 Binder distribution ... 32 3.6.5 Ink absorption ... 34 3.6.6 Print gloss ... 36 3.6.7 Pick resistance ... 36 3.6.8 Print mottle ... 37
4. Results and discussion ... 38
4.1 Swelling of latex particles ... 38
4.2 Coating color properties ... 44
4.3 Coating layer properties ... 47
4.3.1 Drying kinetics ... 47
4.3.2 Coating structure ... 49
4.3.3 Shrinkage rate ... 54
4.4 Coated paper properties... 56
4.4.1 Surface structure ... 56
4.4.2 Gloss of coated paper ... 60
4.4.3 Binder distribution ... 62 4.4.4 Ink absorption ... 65 4.4.5 Print gloss ... 67 4.4.6 Pick resistance ... 71 4.4.7 Print mottle ... 73 5. Conclusion ... 74 6. References ... 76
vi
List of Tables
Table 1 Effects of latexes on consolidation (Watanabe & Lepoutre, 1982) ... 10 Table 2 Monomer compositions and properties of latexes ... 21 Table 3 Monomer compositions and properties of fluorescent latexes ... 21 Table 4 The intrinsic viscosities and the critical volume fractions of the latexes ... 41 Table 5 Volume of the coating layer ... 54
vii
List of Figures
Figure 1. Properties of coating color and coated paper (Lee, et al., 2018). ... 5 Figure 2. Mottle index of coated paper (Lee, et al., 2018). ... 5 Figure 3. Swelling of S/A latexes (Horský, et al., 2001). ... 6 Figure 4. Drying process of the coating layer (Watanabe & Lepoutre, 1982). 9 Figure 5. Void fraction of the coating layer (Watanabe & Lepoutre, 1982). .. 10 Figure 6. Boundary wall effect (Ranger, 1994). ... 12 Figure 7. Binder migration and FCC (Zang, et al., 2010). ... 12 Figure 8. Surface carbon content as a function of drying time (Zang, et al.,
2010). ... 13 Figure 9. Brownian motion and surface-trapping effect (Zang, et al., 2010). 13 Figure 10. SB/CaCO₃ Raman band peak area ratio and binder migration
phenomena: (a) 2.3 μm CaCO₃, (b) 0.7 μm CaCO₃, (c) 0.3 μm CaCO₃, (d) binder migration depending on the size difference. Bilta, Tripp and Bousfield, 2003). ... 14 Figure 11. The relationship between pore diameter and ink setting rate (Xaing
& Bousfield, 2000 & Ström et al., 2003). ... 15 Figure 12. Print mottling and closed area (Chinga & Helle, 2003). ... 16 Figure 13. Cross sections of coated papers (Ozaki, Bousfield, & Shaler, 2008). ... 17 Figure 14. Printed surfaces of coated paper (Ozaki, Bousfield, & Shaler, 2008). ... 17
viii
Figure 15. Relationships between print uniformity and coating weight
(Engström, 2016). ... 18
Figure 16. Print mottle and binder content in surface (Engström, 2016). ... 19
Figure 17. The scheme of the drying kinetics measurement. ... 28
Figure 18. Sample preparation for sectional analysis. ... 32
Figure 19. Cross section of coating layer: (a) x100 combined image, (b) x400 fluorescent image, (c) x400 optical image, (d) x400 fluorescent image. 34 Figure 20. Hydrodynamic diameters of latex particles with different amounts ... 38
Figure 21. Swelling coefficient of SA latex with different amounts of HEMA monomers determined from the DLS particle size data ... 39
Figure 22. Relative viscosities of four latex suspensions with different HEMA amounts. ... 40
Figure 23. A graphical display of Mooney equation of SA/HEMA latexes. .. 40
Figure 24. The swelling coefficients from three different methods. ... 42
Figure 25. Cryo-TEM images of latex particles: (a) pH 4 S/A-HEMA 0%, (b) pH 4 S/A-HEMA 9%, (c) pH 9 S/A-HEMA 0%, (d) pH 9 S/A-HEMA 9%. ... 43
Figure 26. The effective volume fraction of the coating color. ... 45
Figure 27. Low-shear viscosity and dewatering amount of coating color. ... 46
Figure 28. Drying kinetics of the coating layer. ... 48
Figure 29. Surface structure of the coating layer: (a) HEMA 0%, x15,000, (b) HEMA 9%, x15,000, (c) HEMA 0%, x30,000, (d) HEMA 9%, x30,000. ... 51
ix
Figure 30. Pore-size distribution of the coating layer. ... 52
Figure 31. Porosity of the coating layer. ... 52
Figure 32. Cross section of coating layer for HEMA 0%... 53
Figure 33. Cross section of the coating layer for HEMA 9%. ... 53
Figure 34. Shrinkage rate of the coating layer... 55
Figure 35. Roughness before calendering. ... 57
Figure 36. Roughness after calendering. ... 57
Figure 37. Surface structures of the coated papers: (a) HEMA 0% before calendering, (b) HEMA 9% before calendering, ... 58
Figure 38. Closed areas of coated paper: (a), (b) HEMA 0%, (c), (d) HEMA 9%, after calendering. ... 59
Figure 39. Gloss of coated paper before calendaring. ... 61
Figure 40. Gloss of coated paper after calendering. ... 61
Figure 41. Cross section of coated paper: (a) HEMA 0%-120℃, (b) HEMA 9%-120℃, (c) HEMA 0%-40℃, (d) HEMA 9%-40℃. ... 63
Figure 42. Binder distribution of coating layer dried at 120℃. ... 64
Figure 43. Binder distribution of coating layer dried at 40℃. ... 64
Figure 44. Ink absorption of coated paper. ... 66
Figure 45. Water contact angle of latex films. ... 66
Figure 46. Print gloss of coated paper as a function of HEMA content. ... 68
Figure 47. Print gloss of coated paper as a function of coating weight. ... 68
Figure 48. Print snap of coated paper as a function of the HEMA content. ... 69
Figure 49. Print snap of coated paper as a function of the coating weight. .... 70 Figure 50. Surface images of pick resistance test for HEMA contents of 0%,
x
3%, 6%, and 9%. ... 71 Figure 51. Binary images of pick resistance test for HEMA contents of 0%, 3%,
6%, and 9%. ... 72 Figure 52. Picked area of coated paper as a function of HEMA content. ... 72 Figure 53. Mottle index of coated paper as a function of HEMA content. .... 73
1
1. Introduction
Paper coating is a widely used technique for improving the appearance and printability of paper. Paper coating enhances the gloss, opacity, brightness, and printability of paper. However, there are several quality issues for coated papers. One of the most widely occurring problems for coated paper is print mottle, an unevenness of gloss or color density of the printed surface. This print mottle is usually caused by variations in the ink-setting rate after printing, which stems from the non-uniformity of the binder distribution or the pore structure of the coating layer (Xiang, 2000; Ström, et al.; 2003, Chinga & Helle, 2003). To solve the problem of print mottle, it is necessary to control the coating structure and make it more uniform.
Coating colors have pigments, binders, and additives as their main components. Pigments are the basic building blocks of the coating layer, whereas additives adjust the rheological properties of the coating colors or impart special functional properties to the coated paper. Binders that bind all components in the coating layer are used to maintain the structure of the coating. They also play an important role in the consolidation of the coating layer. Therefore, the physical and chemical properties of binders have a significant influence on the structure of pigment coating layers.
In this research, we investigated the role of the functional monomer hydroxyethyl methacrylate (HEMA) in styrene acrylate (S/A) latex, which is
2
one of the most widely used latexes in paper coating. The properties of S/A latexes are affected by the glass transition temperature, crosslinking degree, particle size, etc. Previous research showed that it is possible to change various properties of coating colors and coated papers with the use of functional comonomers (Lee, et al., 2018). Among the several functional monomers tested, including acrylonitrile, acrylic acid, ethyl hexyl acrylate, allyl methacrylate, and HEMA, the most significant improvement in print mottle was obtained when HEMA was used as a comonomer. The use of HEMA as a comonomer for S/A latex increased the viscosity and water retention of the coating color and the ink absorption uniformity. Previous research, however, has only investigated the effect of comonomers using a single comonomer concentration. In addition, the change in coating structure as a function of the comonomers used has not been examined.
HEMA is a hydrophilic monomer containing a hydroxyl group. Its hydrophilic nature imparts a water-absorbing property to the latex when it is used as a comonomer. The effects of HEMA as a comonomer in S/A latex has been examined in previous research (Horský, et al., 2001; Lee, et al., 2018; Quadrat, et al., 2001; Quadrat, et al., 2003). These studies have shown that HEMA can intensify the swelling of latex in alkaline conditions. As most coating processes are performed under alkaline conditions, this swelling would seem to have effects on the coating structure. However, the latexes used in these studies contained too much HEMA monomer to use them as paper coating binders. Therefore, it is necessary to investigate the effect of HEMA content in S/A latex
3 as a binder for paper coating.
The swelling of latex particles occurs when the carboxyl groups dissociate into carboxylate ions. The negatively charged carboxylate ions cause electrical repulsion between the latex particles and between the polymer chains within the particles. Electrical repulsion between the latex particles stabilizes the latex suspension, whereas the repulsion between the polymer chains within the particles causes swelling of the particle. A hydrophilic monomer improves the mobility of the polymer chains, which helps hydroxyl ions penetrate the latex particles, resulting in greater swelling of the latex (El‐Aasser, et al., 1985). Thus, the properties of S/A latex may change substantially depending upon the amount of HEMA comonomer.
The immediate purpose of this study was to explore the effects of the HEMA monomer on SA latex and its effect on the consolidation and structure of the coating layer. The structural change of the pigment coating layer associated with the use of SA latex as a binder was investigated, and the property changes and mechanism involved in the use of S/A latex with different levels of HEMA as a comonomer are discussed. The final goal of this study was to elucidate the effect of the HEMA content in S/A latex on the coating structure and coated paper.
4
2. Literature reviews
Styrene-Acrylate latex
Styrene acrylate (S/A) latex and styrene butadiene (S/B) latex are among the most widely used latex binders in paper coating. S/A latex is usually polymerized with styrene and butyl acrylate as monomers. This latex provides a strong binding force for the coating layer. The properties of S/A latex are influenced by the glass transition temperature (Tg), particle size, gel content,
and the types and amounts of functional monomers. The effects of Tg, particle
size, and gel content on the performance of latex binders have been investigated and reported (Bitla, Tripp & Bousfield, 2003; Gane et al., 1996; Laudone, Matthews, & Gane, 2004; Lee & Lee, 2018; Watanabe & Lepoutre, 1982; Zang, et al, 2010). However, there are few studies on the effect of functional monomers on S/A latex properties and on coated paper, particularly when HEMA is used as the comonomer.
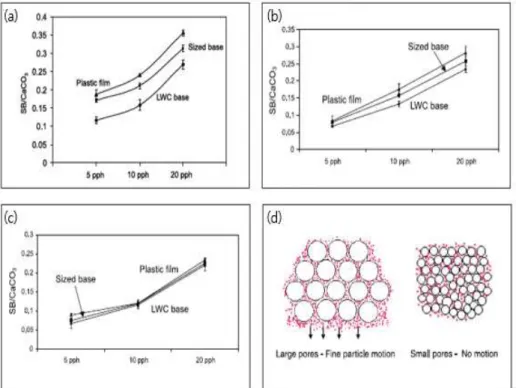
Lee et al. (2018) investigated the effect of functional monomers in SA latex on the properties of coating color and coated paper, and they showed that a HEMA comonomer increased both the low-shear viscosity of the coating color and water retention (Figure 1(a), (b)). The ink absorption decreased (Figure 1(c)), and the uniformity of ink absorption improved with the use of HEMA (Figure 1(d)). Moreover, these changes in the ink absorption properties reduced print mottle (Figure 2). However, the working mechanism for this change has
5 not been investigated systematically.
Figure 1. Properties of coating color and coated paper (Lee, et al., 2018).
6
Characteristics of HEMA and latex swelling
HEMA, also called glycol methacrylate or glycol monomethacrylate, is a hydrophilic monomer first synthesized in 1936 (Nemours, 1936). HEMA has been used in the medical field because of its stability and hydrophilic properties since hydrogel-formed polymers were introduced in 1960 (Wichterle & Lim, 1960). Through a hydroxyl group in the monomer, a polymer containing this monomer can interact with water, even though there are still hydrophobic sites (Refojo, et al., 1965; Janacek, et al., 1973; Holly & Refojo, 1975; Montheard, Chatzopoulos & Chappard, 1992). By using five kinds of S/A latexes with different HEMA contents, Horský et al. (2001) showed that HEMA intensifies the swelling of S/A latexes in alkaline conditions and that latex swelling increases with increasing HEMA content (Figure 3).
7
Latex particles containing carboxyl groups also swell in alkaline conditions. The hydroxyl ion in the alkali dissociates the hydrogen ion in the carboxyl group, which increases the electrical repulsion between the functional groups. Electrical repulsion between different particles stabilizes particles, but the repulsion inside a particle causes the swelling of the particle.
According to El‐Aasser and his colleagues (1985), a hydrophilic monomer can intensify the swelling of latex particles. Hydrophilic monomers such as HEMA in polymer chains hydrate and improve the mobility of polymer chains. The improved mobility facilitates the penetration of hydroxyl ions and consequently increases the swelling degree.
8 Coating structure
The structure of the coating layer is set during drying. According to Watanabe and Lepoutre (1982), the drying of the coating layer is divided into three stages separated by two critical concentrations (Figure 4). Before the first critical concentration (FCC), particles move freely in the coating layer. During this stage, water evaporates from the surface of the coating layer or penetrates into the base paper. Binders move along with the movement of water at this stage of drying. During this period of drying, the gloss of the coating layer increases because the increased solid concentration increases the refractive index of the wet coating layer.
At the FCC, a sudden decrease in the gloss occurs because menisci start to appear on the coating surface and pigments appear at the top layer. This decrease in gloss results in the formation of a network structure. At this moment, the structure is exposed on the surface. After the FCC, menisci appear on the surface, and shrinkage of the coating layer begins. The gloss and reflectance of the coating layer decrease with decreasing space between the particles. After the second critical concentration (SCC), the reflectance increases rapidly as water in the void fraction is exchanged with air. During this stage, the shrinkage stops and the structure is fixed.
9
Figure 4. Drying process of the coating layer (Watanabe & Lepoutre, 1982).
During the second stage between the FCC and SCC, the coating layer shrinks and thus the volume of the void fraction decreases (Figure 5). The properties of the binders can affect the consolidation of the coating layer and can change these two critical concentrations. Table 1 lists several kinds of binders and the critical concentrations of the coating layers containing the binders. The shrinkage period varies with the binders. From these results, it is supposed that the binder properties can change the drying process and the coating structure. Thus, it is expected that the water-absorbing properties of HEMA may also have effects on the coating structure.
10
Figure 5. Void fraction of the coating layer (Watanabe & Lepoutre, 1982).
Table 1 Effects of latexes on consolidation (Watanabe & Lepoutre, 1982)
Binders (20 pph) Critical conc. (vol%) Void fraction
of clay coatings Shrinkage (%) FCC SCC S/B nonfilming latex A 58.0 64.0 0.37 11.9 60/40/ S/B filming latex B 61.5 79.0 0.21 45.5 Vinylacetate latex C 57.0 75.0 0.26 39.5 Polyacrylic latex 62.0 77.0 0.24 36.8 60/40 S/B filming latex/ oxidized starch 10/10 58.0 77.0 0.22 47.6 Oxidized starch 53.5 74.0 0.20 57.0
11 Binder migration
Binders move in the coating layer with the liquid phase during the drying process. When binder migration occurs unevenly, print mottle can be caused by the uneven surface of the coating layer. Thus, it is important to understand the mechanism of binder migration and control it. As binder migration is closely related to the drying process of the coating layer, it was thought that HEMA would affect the binder migration in the coating layer.
Among theories about binder migration, there are three mechanisms that have received strong support: the capillary theory, the boundary wall effect, and the Brownian motion and surface-trapping effect.
According to Hangen (1986), binders migrate by capillary force based on water evaporation. When the coating layer is dried slowly, binders diffuse from the surface to the inside of the coating layer, contrary to the liquid phase. However, when the coating layer is dried rapidly, the drying time is not sufficient for diffusion to affect the binder migration. Therefore, the capillary force becomes the main factor.
Contrary to Hangen, Ranger (1994) suggested the boundary wall effect as the mechanism of binder migration. Near the boundary of the suspension, relatively large particles are sparse (Figure 6). Thus, binders, which have a smaller particle size than pigments, are mainly distributed near the boundary and move
12
to the inside during drying. Thus, the faster the drying rate, the more binder particles there are near the boundary. However, if the coating layer is dried at a medium rate, the binder will be distributed unevenly near the surface.
Figure 6. Boundary wall effect (Ranger, 1994).
Zang and his colleagues (2010) were opposed to the above two mechanisms and suggested a new mechanism. They pointed out that the migration occurs before, not after, the FCC. As shown in Figure 7, the carbon content is related to the latex content. The surface carbon content decreases until 500 s, which is near the FCC. As the capillary force acts on the coating layer after menisci are formed, the capillary theory cannot account for the binder migration. They also refuted the boundary wall effect by noting that a relatively small amount of binder is near the boundary in the initial drying stage (Figure 8).
13
Figure 8. Surface carbon content as a function of drying time (Zang, et al., 2010).
Zang et al. (2010) described the binder migration using Brownian motion and the surface-trapping effect. According to this theory, small particles like latex particles have high mobility and move randomly in the coating layer. In the initial drying stage, latex particles move irregularly. However, as the coating layer dries, the particles become trapped on the surface by evaporation and interfacial tension (Figure 9).
14
According to previous research, several factors affect the binder migration. Al-Turaif and his colleagues (2002) reported that the surface binder content decreased when they used an absorbent substrate and carboxymethyl cellulose (CMC) in their XPS (X-ray photoelectron spectroscopy) research. Bitla, Tripp, and Bousfield (2003) used Raman spectroscopy to investigate the effects of particle size on binder migration (Figure 10). According to them, the size difference between the pigment and the latex particles can facilitate binder migration.
Figure 10. SB/CaCO₃ Raman band peak area ratio and binder migration phenomena: (a) 2.3 μm CaCO₃, (b) 0.7 μm CaCO₃, (c) 0.3 μm CaCO₃, (d) binder migration depending on the size difference. Bilta, Tripp and Bousfield,
15 Printability
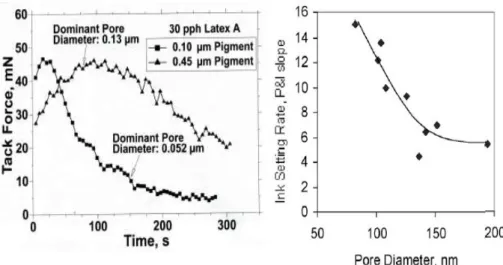
HEMA can affect the printability of coated paper because the latex properties influence the coating structure, which is directly related to the printability. According to Xiang and Bousfield (2000), there is an inverse correlation between the ink setting rate and pore size when the resistance of the filter cake is high. Ström and his colleagues (2003) also reported that the ink setting rate decreased with increasing pore size (Figure 11).
Figure 11. The relationship between pore diameter and ink setting rate (Xaing & Bousfield, 2000 & Ström et al., 2003).
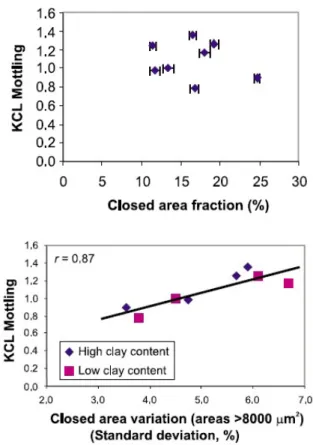
The porosity of a coating surface has a relationship with print unevenness, namely, print mottle (Chinga & Helle, 2003). The closed area, which means the low porosity area, is not related to print mottle quantitatively, but the closed area variation is positively related to the print mottle (Figure 12).
16
Figure 12. Print mottling and closed area (Chinga & Helle, 2003).
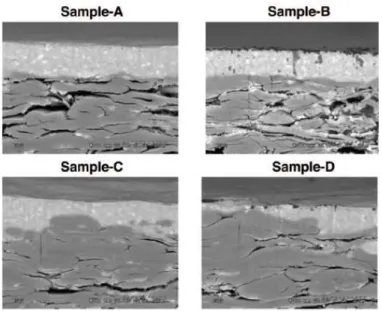
There are several theories explaining the cause of print mottle. Among those, variation of coat weight is a generally accepted cause. In Figure 13, a local difference in coat weight is shown for Sample C and Sample D, whereas Sample A and B show uniform coati weight. After halftone printing with the samples, a nonuniform pattern appeared (Figure 14). Also, Engström (2016) revealed that there is a positive relationship between the variations of print reflectance and coating weight.
17
Figure 13. Cross sections of coated papers (Ozaki, Bousfield, & Shaler, 2008).
Figure 14. Printed surfaces of coated paper (Ozaki, Bousfield, & Shaler, 2008).
18
Figure 15. Relationships between print uniformity and coating weight (Engström, 2016).
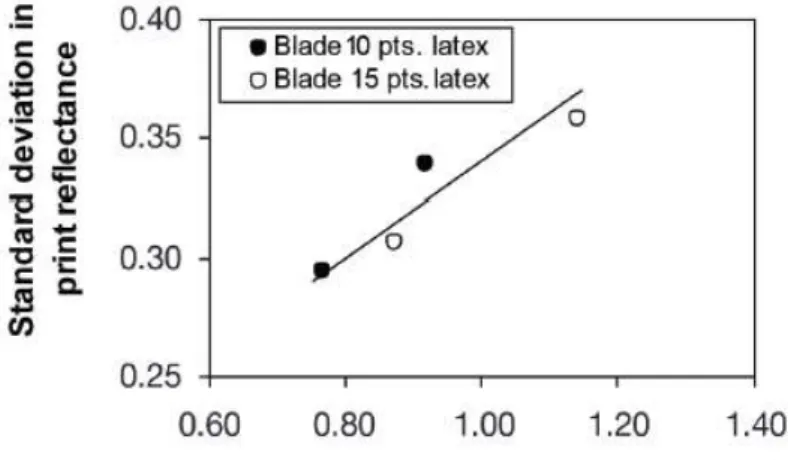
The variation in coat weight can affect binder distribution, which can affect print mottle. Engström (2016) reported that the surface binder content is related to print unevenness. According to him, variation in the binder is positively related to the coat weight variation. In addition, the standard deviation in print reflectance increases with increasing standard deviation in the binder content on the surface (Figure 16).
19
Figure 16. Print mottle and binder content in surface (Engström, 2016).
From previous research (Lee et al., 2018), it is clear that the HEMA comonomer can affect S/A latex, and HEMA probably has an influence on the printability. As these changes are assumed to be due to the structural change of the coating layer caused by the hydrophilicity of HEMA, it is necessary to investigate the relationship between the S/A latex with HEMA, the coating structure, and printability.
20
3. Experimental
Materials
Six S/A latexes with different amounts of HEMA provided by LG Chem. were used in this research. The HEMA contents of the latexes were 0, 3, 6 and 9 wt% (Table 2 and Table 3). Other properties of the latex, i.e., the particle size, gel content, and glass transition temperature, were controlled to investigate the effect of HEMA content more systematically.
Two latexes with 0% and 9% HEMA were prepared to have fluorescein O-methacrylate as a fluorescent monomer, which were used for the analysis of binder distribution (Table 3).
Ground calcium carbonate was used as a coating pigment. The median particle diameter was 0.80 μm, and 97.4 vol% of the particles were below 2 μm. Base paper with a basis weight of 103 g/m2 was provided by Moorim Paper Co.
21
Table 2 Monomer compositions and properties of latexes
Latex Monomer (wt%) pH BA SM AA HEMA IA S/A-HEMA 0% 56.4 39.1 3.7 0 0.8 6.31 S/A-HEMA 3% 55.3 37.2 3.7 3 0.8 6.31 S/A-HEMA 6% 54.4 35.1 3.7 6 0.8 6.31 S/A-HEMA 9% 53.5 33.0 3.7 9 0.8 6.31 Latex Tg 130℃ Gel S/T TSC η (℃) (%) (mN/m) (%) (cps) S/A-HEMA 0% 13.37 96.0 47.0 50.4 686 S/A-HEMA 3% 16.23 96.3 45.7 49.2 704 S/A-HEMA 6% 13.27 96.1 43.9 49.3 1048 S/A-HEMA 9% 15.97 95.6 43.4 48.8 1192
Table 3 Monomer compositions and properties of fluorescent latexes
Latex Monomer (wt%) pH BA SM AA HEMA FMA IA S/A-HEMA 0%-F 56.4 39.1 3.7 0 0.05 0.8 6.33 S/A-HEMA 9%-F 53.5 33.0 3.7 9 0.05 0.8 6.33 Latex Tg 130℃ Gel S/T TSC η (℃) (%) (mN/m) (%) (cps) S/A-HEMA 0%-F 16.63 96.0 46.1 50.7 686 S/A-HEMA 9%-F 18.74 95.6 44.4 50.1 1024
22
Formulation and preparation of coating color
All of the coating layers and coated paper used in this research were made using the same conditions, i.e., the same formulation, pH, and solids content were used. The coating color was made with 100 pph of pigment, 12 pph of latex, and 0.15 pph of carboxymethyl cellulose (CMC, Finfix 5). Ground calcium carbonate was used as the coating pigment. GCC was dispersed in diluted CMC solution, and the latex binder was added to the dispersion. A stirring time of 20 min was applied after the addition of each component. The total solids content was 62 wt%, and the pH of the coating color was adjusted to 9 with sodium hydroxide. After mixing for 20 min, the coating color was filtered using a 100-mesh wire screen.
23 Swelling of latex particles
The degree of swelling of the latex particles was evaluated based on the three swelling coefficients following Horský et al. (2001). The first swelling coefficient was calculated from the hydrodynamic diameter ratio of latex particles in acidic and alkaline conditions. The other two swelling coefficients were obtained from the relative viscosity of latex suspensions using Mooney’s equation.
The hydrodynamic diameters of the latex particles were measured using Zetasizer Nano ZS (Malvern Instrument, UK). This instrument measures the particle size by dynamic light scattering (DLS). To evaluate the swelling degree, the latex suspensions were diluted to 0.01% in pH 4 and pH 9 conditions. The suspensions were stabilized for two days after adjusting the pH and concentration before the measurement. The swelling coefficient was obtained from the ratio of the diameters in alkaline and acid conditions according to Eq. (1).
𝑞 = 𝑑
𝑑 Eq. (1)
The relative viscosity was measured using a glass capillary viscometer (CANNON-Fenske Routine Viscometer, USA) at 25°C in several concentrations. The intrinsic viscosity and critical volume fraction were
24
obtained from the intercept and slope of the Mooney equation in Eq. (2). The swelling coefficients were defined as the ratio of the intrinsic viscosity and critical volume fraction to the values in acidic and alkaline conditions (Eq. 3 and Eq. 4). Theoretical values rather than experimental values were used for the acidic conditions because latex aggregates in acidic conditions.
𝜙 ln(𝜂 )= 1 [𝜂]+ 1 [𝜂]𝜙 𝜙 Eq. (2) 𝑞 =[𝜂] 2.5 Eq. (3) 𝑞 =0.64 𝜙 Eq. (4)
When a volume of particles (𝜙) swells q times, the volume fraction of the swollen latex suspension ( 𝜙𝑎 ) increases proportionally, i.e., 𝜙𝑎= 𝑞𝜙 . According to the Mooney equation, the relative viscosity of a swollen suspension can be described according to Eq. (5), which gives Eq. (6).
𝜂𝑟𝑒𝑙,𝑎= exp ⎝ ⎜ ⎛𝑞[𝜂]𝜙 1 −𝑞𝜙𝜙 𝑐⎠ ⎟ ⎞ Eq. (5) 𝜙 ln 𝜂 , =1 − 𝑞 𝑞[𝜂] + 1 [𝜂]+ 1 [𝜂]𝜙 𝜙 Eq. (6)
25
The intrinsic viscosity was calculated from the y-intercept of Eq. 2. Thus, the intrinsic viscosity of a swollen latex suspension can be derived from Eq. 6, which gives Eq. 7. Similarly, the critical volume fraction of a swollen latex suspension can be derived because the value is obtained from the slope of Eq. 2, which gives Eq. 8. Therefore, the swelling coefficients can be defined with theoretical values (Eq. 3 and Eq. 4).
1 [𝜂]𝑎= 1 − 𝑞 𝑞[𝜂] + 1 [𝜂] Eq.(7) 𝜙𝑐,𝑎=[η]𝜙𝑐×[1 𝜂]𝑎=[η]𝜙𝑐× 1 𝑞[𝜂] Eq. (8)
The equations described above provide the hydrodynamic changes of the latex particle, but they do not provide any information on the physical changes of the latex. Latex particles, however, show physical changes at room temperature by forming films. Therefore, it is necessary to measure the sizes of the particles while they are in suspension. The latex particles in alkaline suspension were analyzed by using Cryo-TEM (Talos L120C, FEI, USA), in which samples were analyzed after quick-freezing. The solids content of the latex suspensions was 0.5 wt% at pH 9. The samples were stabilized for two days at room temperature. After stabilization, the suspensions were rapidly frozen by Vitrobot (FEI, USA).
26 Coating color properties
The dewatering of the coating color was evaluated with an Åbo Akademi Gravimetric water retention meter (ÅA-GWR). Ten milliliters of coating color were loaded onto a membrane filter (mixed cellulose ester membrane filter, pore size 0.2 μm, Advantec), and 1.8 bar of pressure was applied for 60 s. The coating color was dewatered to the blotter paper under the membrane filter. The dewatering amount was calculated by the weight difference of blotter papers before and after dewatering, and it was divided by the dewatering area to obtain the water retention value.
The low-shear viscosity of the coating color was measured by a Brookfield viscometer (Brookfield DV2Y, USA). All of the measurements were made using the same containers at room temperature.
27 Coating layer properties
3.5.1 Drying kinetics
The drying kinetics of the coating layer were investigated by multispeckle-diffusing wave spectroscopy (MS-DWS; Horus, Formulaction, France) (Figure 17). MS-DWS uses DLS and analyzes drying dynamics through the Brownian motion of the particles (Brunel, et al., 2007; Brun, et al., 2008). A camera without a lens detects speckle images caused by the interference of multiply scattered light. At the same time, the dynamics of the particles are evaluated by the intensity difference between these images. In MS-DWS, each image is assumed to be a multi-dimensional space, and each pixel in the image is regarded as one dimension. From this assumption, the intensity difference can be analyzed by a vectoral distance (𝑑 ) between two images (Eq. 9).
𝑑 = [𝐼 (𝑥, 𝑦) − 𝐼 (𝑥, 𝑦)] Eq. (9)
The value of 𝑑 reaches a maximum after a specific period, which is defined as the typical decay time (τ). The speckle rate (SR), a reciprocal of the typical decay time, represents the dynamics of the particles. A high SR means the fast movement of particles. More detailed information on the instrument and operating principle can be found in previous research (Brunel et al., 2007, Brun, et al., 2008, Oh, et al., 2017).
28
Figure 17 illustrates the measurement scheme. The instrument uses a laser with a 655 nm wavelength. It can take images with resolutions of 320 × 240 pixels, and the maximum frame rate was 30 images/s. For the measurement, the wet coating layer was applied to the glass plate using a film-casting doctor blade. Drying conditions were controlled to have constant temperature and humidity (23.0 ± 0.5°C, RH 50 ± 3%). Simultaneously, the weight change during the process was monitored using an analytical balance (Radwag, Poland). The resolution of the balance was 0.1 mg.
Figure 17. The scheme of the drying kinetics measurement.
29 3.5.2 Coating structure
The images of the surface structure were obtained by a field-emission scanning electron microscope (FE-SEM, AURIGA, Carl Zeiss). The pore structure of the coating layer was investigated using a focused ion beam microscope (FIB, AURIGA, Carl Zeiss) and a mercury porosimeter (AutoPore Ⅳ, Micromeritics Instrument Corp., USA). The coating color was applied to a 100 μm thick polyethylene terephthalate (PET) film using a four-sided gap applicator and dried at room temperature.
The porosity of the coating layer was measured using a mercury porosimeter and by the silicon oil saturation method. In mercury porosimetry, the porosity is calculated by the intrusion volume per coating layer volume (Eq. 10). The diameters of the pores ranged from 10 to 1000 nm, and they were assumed to have a cylindrical shape. When the porosity was checked with silicon oil, the same film used in the mercury porosimeter measurement was used as a coating substrate, but a bar coater was used to apply the coating.
Porosity (%) = 𝐼𝑛𝑡𝑟𝑢𝑠𝑖𝑜𝑛 𝑣𝑜𝑙𝑢𝑚𝑒 (𝑚𝐿)
30
3.5.3 Shrinkage rate
The shrinkage rate of the coating layer was determined from the volumetric data obtained from the drying kinetics and porosity measurements. First, the volume of the coating layer before drying was calculated using the coating color formulation and density of each component. The volume of solids in the coating layer was obtained from the coating color formulation, solids content, and density data of each component. Next, the volume of the coating layer at the immobilization point was obtained from the total weight of the coating layer at the FCC and the dried coating layer. The volume of water at the FCC was calculated from the mass of the coating layer at the FCC and the solids weight of the coating layer. The volume of the fully dried coating layer was obtained from the porosity data and the solids volume of the coating layer.
31 Coated paper properties
3.6.1 Coated paper preparation
Prepared coating colors were applied to a base paper using a laboratory rod coater. The coated paper was then dried in a hot-air dryer at 120°C and conditioned in a constant temperature and humidity room (23.0 ± 0.5°C, 50 ± 3%) according to the relevant ISO standard. The coated paper was calendered using a laboratory soft nip calendar at a pressure of 1.5 bar.
3.6.2 Surface structure
An L&W PPS tester (ABB AB/Lorentzen & Wettre, Sweden) was used to measure the roughness of the coated paper. The surface images were obtained using a field-emission scanning electron microscope (FE-SEM, AURIGA, Carl Zeiss).
3.6.3 Gloss of coated paper
An L&W gloss tester (ABB AB/Lorentzen & Wettre, Sweden) was used to determine the gloss of the coated paper.
32 3.6.4 Binder distribution
The binder distribution of coated paper was examined with a confocal laser scanning microscope (CLSM, SP8 X, Leica, German). Two latexes with fluorescent monomers were used to investigate the influence of HEMA content and drying temperature on the binder distribution in the coating layer. Two drying temperatures of 60°C and 120°C were used to examine the temperature effect. The coated paper sample was embedded in epoxy resin (EpoFix, Strueres, Denmark) (Figure 18) and cured. After curing, the resin block was polished using LaboPol-5 and LaboForce-3 (Strueres, Denmark) to expose the cross sections of the coated paper.
Figure 18. Sample preparation for sectional analysis.
33
CLSM was used to obtain optical images and fluorescent images simultaneously. The magnification power of the objective lens used in this research was 100×. The digital zoom enlarged the images four times, which allowed a total magnification power of 400× (Figure 19(b)). LAS X software (Leica, German) was used to analyze the intensity of the emission. The image intensity was analyzed every 1 μm in depth starting from the top of the coating layer. The image area analyzed was 36 μm × 1 μm, and serial analysis started from the top layer of the coating. As sectioning was not carried out following the contour of the coating layer, the analysis gave the general distribution of the latex binders in the thickness direction (Figure 19(c), (d)).
34
Figure 19. Cross section of coating layer: (a) x100 combined image, (b) x400 fluorescent image, (c) x400 optical image, (d) x400 fluorescent image.
35
3.6.5 Ink absorption
The ink absorption of the coated paper was evaluated based on the SCAN test method (SCAN-P 70:09). Croda ink (Flint Group, Luxembourg, Luxembourg) was the model ink, which was applied by a four-sided applicator (Biuged, Guangzhou). The applied thickness was 25 μm, and the ink was removed after 2 min. The ink absorbency was evaluated based on the change of the brightness after the ink absorption (Eq. 11).
𝐼𝑛𝑘 𝑎𝑏𝑠𝑜𝑟𝑝𝑡𝑖𝑜𝑛 𝑟𝑎𝑡𝑖𝑜, % = × 100 Eq. (11) where 𝑅 is the brightness after ink absorption and 𝑅 is the brightness
36 3.6.6 Print gloss
Print gloss was measured after printing on coated paper using an IGT printability tester (C1-5, IGT, Netherland). An IGT Mottle test ink was used for printing. Gloss was measured using an L&W gloss tester (ABB AB/Lorentzen & Wettre, Sweden).
3.6.7 Pick resistance
Pick resistance was evaluated with an RI printability tester (RI-1, Four-color Tester, Sangyo Co., LTD, Japan). High-tack ink (tack value: 11) was applied on the coated paper just after it was dispersed on the blanket roll. The printed paper passed through the blanket roll several times until the picked area appeared. Subsequently, the sample was converted to binary images after an initial scan at a resolution of 300 dpi (Epson Perfection V33, EPSON). Finally, the pick resistance was determined from the picked area, obtained using the binary images.
37
3.6.8 Print mottle
Back-trap mottle was examined using the IGT printability tester. After printing the paper, a new blanket roll was used to back-trap the ink from the printed surface with regular time spans. The test samples were conditioned at a constant temperature in a humidity room for one day and then digitally scanned to obtain 8-bit grayscale images.
STFI-mottling Expert v1.31 software was used to analyze the uniformity of the printed surface. This software converts the reflectance of the samples into frequency-domain data by using fast Fourier transform (FFT). Next, the program calculates the mottle index with the coefficient of variation (COV) in specific spatial wavelength (1–8 mm) (Eq. (12)).
38
4. Results and discussion
Swelling of latex particles
The hydrophilicity of HEMA had a significant influence on the latex swelling. Figure 20 shows the hydrodynamic diameters of the latex particles at pH 4 and 9 as a function of HEMA content. The particle size of the latex remained almost constant at pH 4, irrespective of the HEMA content. However, the particle size increased substantially at pH 9 with increasing HEMA content. This indicates that the hydroxyethyl groups of HEMA had a synergic effect on the ionization of the carboxyl groups in alkaline conditions and made the latex particles swell. The increase in the latex particle diameters in alkaline condition for the high-HEMA latex resulted in its greater swelling coefficient (Figure 21).
Figure 20. Hydrodynamic diameters of latex particles with different amounts
0 3 6 9 110 120 130 140 150 160 170 180 190 200 P ar ti c le s iz e ( n m ) HEMA content (%) pH 4 pH 9
39
Figure 21. Swelling coefficient of SA latex with different amounts of HEMA monomers determined from the DLS particle size data
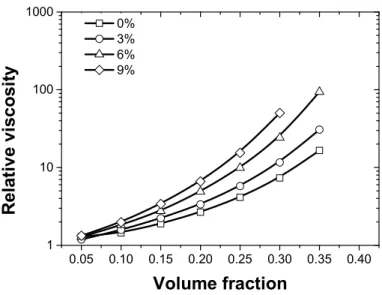
The swelling was examined by measuring the relative viscosity. The DLS and relative viscosity data indicated similar tendencies in the swelling properties. The relative viscosity of the latex suspension increased with the increasing volume fraction of the latex (Figure 22), and the latexes with more HEMA showed greater relative viscosities. Figure 23 depicts the relative viscosity data according to the Mooney equation given in Eq. 2. From the intercepts and slopes of the respective plots, the intrinsic viscosities and critical volume fractions were calculated (Table 4). The critical volume fractions decreased with increasing HEMA content.
0 3 6 9 1.0 1.5 2.0 2.5 3.0 3.5 S w el lin g c o e ff ic ie n t HEMA content (%)
40
Figure 22. Relative viscosities of four latex suspensions with different HEMA amounts.
Figure 23. A graphical display of Mooney equation of SA/HEMA latexes.
0.05 0.10 0.15 0.20 0.25 0.30 0.35 0.40 1 10 100 1000 R el at iv e vi sc o si ty Volume fraction 0% 3% 6% 9% 0.00 0.05 0.10 0.15 0.20 0.25 0.30 0.35 0.40 0.00 0.05 0.10 0.15 0.20 0.25 HEMA 0% HEMA 3% HEMA 6% HEMA 9% ln ( re l ) Volume fraction Linear fit of HEMA 0%
Linear fit of HEMA 3% Linear fit of HEMA 6% Linear fit of HEMA 9%
y = - 0.5490 x + 0.3154 y = - 0.4615 x + 0.2605 y = - 0.3981 x + 0.2114 y = - 0.3904 x + 0.1882
41
Table 4 The intrinsic viscosities and the critical volume fractions of the latexes
HEMA (%)
0 3 6 9
[𝜂] 3.17 3.84 4.73 5.31
𝜙 0.57 0.56 0.53 0.48
The swelling coefficients obtained from all three methods increased as the HEMA content increased (Figure 24). This clearly shows that the hydrophilicity of HEMA is one of the major factors responsible for latex swelling. The presence of a hydroxyl group in HEMA latex increased the hydrophilic property of the latex particles, which contributed to the particle swelling by absorbing and holding more water in the latex. It appeared that the synergic effect of swelling occurred when carboxyl groups and hydroxyl groups coexisted in the latex. Consequently, the hydrophilic swelling of the latex particles made the particles behave like larger ones at higher solids contents.
42
Figure 24. The swelling coefficients from three different methods.
Figure 25 shows the quick-frozen latex particles in acidic and alkaline conditions. The latex particles in the acidic condition had clear boundaries and they were similar in shape, irrespective of the HEMA content. It is also clear that the color density of the outer part of the latex particle was lower than that of the core part of the latex. This suggests that the outer part had a different chemical composition than the core part. It is usual practice to use carboxylic or hydrophilic groups in latex polymerization, and these groups are mainly arranged near the outer part of the latex particle because the medium is water.
The shape of the latex particles in the alkaline condition was different. Latex particles with 9% HEMA did not show a clear outline, and their shape looks stellate. This might because the polymer chains in the outer part spread in the
0 3 6 9 1.0 1.5 2.0 2.5 3.0 3.5 4.0 S w el lin g c o e ff ic ie n t HEMA content (%) DLS Intrinsic viscosity Mooney equation
43
alkaline condition. That is, SA latex with HEMA swells, but the degree of swelling is not the same all around the particle surface. Some parts of the latex particle swell more than other parts, probably because the distribution of HEMA comonomers is not uniform across the particle surface.
Figure 25. Cryo-TEM images of latex particles: (a) pH 4 S/A-HEMA 0%, (b) pH 4 S/A-HEMA 9%, (c) pH 9 S/A-HEMA 0%, (d) pH 9 S/A-HEMA 9%.
44 Coating color properties
The volume fractions of coating color were similar between the four conditions. However, the effective volume fractions, determined by applying the swelling coefficient, were different for the different conditions (Figure 26). Because the swollen latex particles occupied more space in the coating color, the effective volume fraction of the coating color also increased with increasing HEMA content. However, the effective volume fraction calculated from the critical volume fraction did not increase substantially. According to previous research (Horský, et al., 2001), the swelling coefficient from the intrinsic viscosity describes the low-concentration condition. Conversely, the coefficient from the critical volume fraction represents higher concentration conditions. Hence, it seems that there was latex swelling in the alkaline condition coating colors, yet the effect was suppressed to a great extent due to the higher HEMA concentration.
45
Figure 26. The effective volume fraction of the coating color.
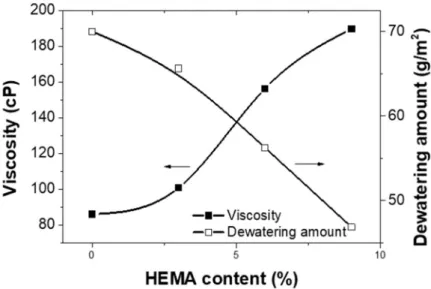
The hydrophilicity of HEMA greatly affected the low-shear viscosity of the coating color (Figure 27). The increase in effective volume is a probable cause of the viscosity increase. Further, the water retention of the coating color was improved by HEMA. That is, the dewatering amount decreased with increasing amounts of HEMA. There were more hydroxyl groups in the coating color when a high-HEMA–containing latex was used as a binder. Therefore, the coating color held more water inside of itself, even though not all the water contributed to the swelling. This phenomenon also affected viscosity.
0 3 6 9 0.40 0.45 0.50 0.55 0.60 0.65 0.70 E ff e c ti v e v o lu m e f ra c ti o n HEMA content (%) Volume fraction DLS Intrinsic viscosity Mooney equation
46
47 Coating layer properties
4.3.1 Drying kinetics
The consolidation of the coating layer was monitored by MS-DWS (Figure 28). The movement of the particles slowed as the coating layer dried. At a specific time, particle activity drastically decreased. According to previous research (Oh, et al., 2017), particles in a coating layer form a network structure at this specific time, which is defined as the typical time. Interestingly, the typical time appeared earlier in high-HEMA conditions. It was 584.4, 538.4, 490.0, and 459.8 s when the HEMA content was 0, 3, 6, and 9%, respectively. The solids content of the coating layer was also lower in the high-HEMA conditions compared with the low- and no-HEMA conditions. From this data, it can be deduced that the network structure formed earlier when the latex binder had more HEMA monomers. Figure 24 shows that the particle size of the latex with more HEMA was larger in the alkaline condition. Combining this information with the present results, it is probable that the coating color was immobilized earlier because of the latex swelling. Above the typical time, the initial values of the speckle rate showed differences as well, i.e., the initial value decreased with increasing HEMA amount in the S/A latex, from 9.7 Hz to 5.9 Hz. These results suggest that even in the initial stage of drying, particle movement was hindered by the swelling of the S/A latexes with HEMA.
48
Figure 28. Drying kinetics of the coating layer.
0 500 1000 1500 1E-3 0.01 0.1 1 10 100 Speckle rate (Hz) HEMA 0 % HEMA 3 % HEMA 6 % HEMA 9 % Weight (%) HEMA 0 % HEMA 3 % HEMA 6 % HEMA 9 % Time (s) S p e c kl e ra te ( H z) 0 20 40 60 80 100 W e ig h t (% )
49
4.3.2 Coating structure
SEM images of the coating layer were obtained to analyze the surface structure (Figure 29). A more porous structure was formed in the HEMA 9% condition compared with the no-HEMA condition, which was more remarkable in the images at high magnification (Figure 29(c), (d)). This result corresponds with the porosity and pore-size distribution results (Figure 30 and Figure 31). Figure 30 shows the pore-size distribution of coating layer. The coating layer with the HEMA 9% S/A latex has the highest right-skewed peak, meaning that the layer has many large pores. However, the peak of the HEMA 0% S/A latex is skewed left, and the peak is lower than those of the other conditions. In the case of the secondary small peaks, shown on the right side of the graph, it is possible that large pigment particles caused the peaks or that pores between the coating layer and PET film were inadvertently measured. Therefore, only the first peak was analyzed in this research.
The porosity was investigated using mercury porosimetry and silicon saturation (Figure 31). In both two methods, the porosity of coating layer increased with increasing HEMA amount. That is, the more HEMA there was in the S/A latex, the more porous the structure formed in the coating layer, with larger pores distributed in the structure.
For visible verification of the structural changes under the surface, a cross section of the coating layer was obtained by FIB milling (Figure 32 and Figure
50
33). Compared with the condition without HEMA, a more porous and uniform cross section was observed for HEMA 9%. Moreover, the porosities of the coating layers with HEMA 0% and HEMA 9% calculated from the FIB images were 28.61% and 37.05%, respectively, which showed similar tendency with Figure 31.
As shown in Figure 29, there was less latex film on the coating layer surface in the high-HEMA condition. It is possible that the hydrophilicity of HEMA caused structural changes: because HEMA augmented the swelling of the latex particles, the coating layer was immobilized earlier. Binders in the layer cannot move easily after immobilization. In other words, there would be less binder migration during drying, which could be a reason for the uniform binder distribution on the surface. However, because the SEM images and the porosity data could not show the binder distribution in the z-direction, further investigation was carried out to determine the effects of HEMA on the binder migration.
51
Figure 29. Surface structure of the coating layer:
(a) HEMA 0%, x15,000, (b) HEMA 9%, x15,000, (c) HEMA 0%, x30,000, (d) HEMA 9%, x30,000.
52
Figure 30. Pore-size distribution of the coating layer.
Figure 31. Porosity of the coating layer.
10 100 1000 0.0 0.1 0.2 0.3 0.4 0.5 0.6 L o g D if fe re n ti a l In tr u s io n ( m L /g )
Pore size Diameter (nm)
HEMA 0% HEMA 3% HEMA 6% HEMA 9% 0 3 6 9 27 28 29 30 31 32 33 P o ro s it y (% ) HEMA (%) Silicon saturation Mercury porosimetry
53
Figure 32. Cross section of coating layer for HEMA 0%.
54
4.3.3 Shrinkage rate
The shrinkage rate of the coating layer was investigated based on the coating layer volume. The volume was derived from the MS-DWS and porosity data. Table 5 presents the volume of the coating layer in each condition. Before drying, the coating layers had similar volumes, regardless of HEMA amount. However, the high-HEMA condition had a larger volume at the FCC. This tendency can be explained by the fast immobilization of the high-HEMA condition, as illustrated in Figure 28. In other words, the coating layer reached the FCC earlier because of the particle swelling, and hence less time for drying. After drying, the tendency was maintained. As shown in Figure 30 and Figure 31, the coating layer had larger pores and more porosity as the HEMA amount increased, which suggests that the coating layer acquired porous structure and a bulky structure concurrently.
Table 5 Volume of the coating layer
HEMA (%) Before drying (cm³/100g) FCC (cm³/100g) After drying (cm³/100g) 0 64.66 40.32 36.94
3 64.56 41.17 37.26 6 64.47 43.08 38.85 9 64.50 43.41 38.79
55
Figure 34 shows the shrinkage rate of coated paper derived from the volume at the FCC and after drying. The shrinkage rate increased from 8.4% to 10.6%. Although the final volume increased with increasing HEMA content, the shrinkage rate was proportional to the HEMA content. This result indicates that the immobilization time is critical to the coating shrinkage. Because the coating layer was immobilized earlier, more water probably remained at the FCC, contracting the coating layer over a longer period.
Figure 34. Shrinkage rate of the coating layer.
0 3 6 9 8.0 8.5 9.0 9.5 10.0 10.5 11.0 S h ri n ka g e o f c o at in g l ay er ( % ) HEMA (%)
56 Coated paper properties
4.4.1 Surface structure
The roughness of the coated paper increased with increasing HEMA content as detailed in Figure 35 and Figure 36. The roughness increase seems to have been caused by the shrinkage of the coating layer. As shown in Figure 34, the coating layer was immobilized fast in high-HEMA condition, which increased the coating shrinkage.
Calendering had a significant effect on the roughness. Through calendering, the coating layer acquired a much smoother surface while the differences between the HEMA conditions decreased. Also, the roughness could have been improved by the increase in coat weight. From the results, it is obvious that the increased weight of the coating layer could have reduced unevenness by leveling the surface.
57
Figure 35. Roughness before calendering.
Figure 36. Roughness after calendering.
10 12 14 16 18 20 22 24 26 28 30 5.0 5.5 6.0 6.5 7.0 HEMA 0 % HEMA 3 % HEMA 6 % HEMA 9 %
P
P
S
R
o
u
g
h
n
es
s
(
μ
m
)
Coat weight (g/m
2)
10 12 14 16 18 20 22 24 26 28 30 1.5 2.0 2.5 HEMA 0 % HEMA 3 % HEMA 6 % HEMA 9 %P
P
S
R
o
u
g
h
n
es
s
(μ
m
)
Coat weight (g/m
2)
58
The surface roughness can be explained by looking at the latex film on the paper surface. Figure 37 illustrates the surface structures of the coated papers. In the SEM images, more latex films were shown in a no-HEMA condition. Also, there were more closed areas in the no-HEMA condition (Figure 38), and almost no pores in those areas. Therefore, it is possible that the decreased coverage area of the latex film on the surface caused the roughness increase.
Figure 37. Surface structures of the coated papers:
(a) HEMA 0% before calendering, (b) HEMA 9% before calendering, (c) HEMA 0% after calendering, (d) HEMA 9% after calendering.
59
Figure 38. Closed areas of coated paper:
60
4.4.2 Gloss of coated paper
The gloss of the coated paper is illustrated in Figure 39 and Figure 40. The gloss decreased when the amount of HEMA increased. There are several possible explanations for such a result. First, the roughness decrease could have been a major cause. According to Järnström and his colleagues (2008), the gloss of coated paper has a positive relationship with the roughness of the paper. Therefore, the decrease of light scattering by a porous and rough surface can decrease the gloss. Another probable cause is the increase in pore size and porosity. The gloss measurement is based on the reflectance of the surface. In this regard, reflectance tends to increase when the refractive index increases. One study attempted to prove the relationship between the pore structure and the refractive index of coated paper (Elton, et al., 2006). In the study, the researchers demonstrated that the refractive index of coated paper has negative relationships with pore size and porosity. The pore-size distribution and porosity of the coating layer in the present research increased with increasing HEMA content, as shown in Figure 30 and Figure 31. Thus, it is possible that the pore structure of the high-HEMA latex caused the decrease in gloss through the decrease of refractive index.
61
Figure 39. Gloss of coated paper before calendaring.
Figure 40. Gloss of coated paper after calendering.
10 12 14 16 18 20 22 24 26 28 30 20 25 30 35 40 HEMA 0 % HEMA 3 % HEMA 6 % HEMA 9 %
G
lo
ss
(
%
)
Coat weight (g/m
2)
10 12 14 16 18 20 22 24 26 28 30 50 55 60 65 70 HEMA 0 % HEMA 3 % HEMA 6 % HEMA 9 %G
lo
ss
(
%
)
Coat weight (g/m
2)
62 4.4.3 Binder distribution
With the images acquired by CLSM, the fluorescence intensity was measured to investigate the binder distribution. Figure 41 shows the fluorescent images of the cross-sectioned coated paper. Each condition was analyzed using at least 12 images. The binder distributions are plotted in Figure 42 and Figure 43. According to these figures, more binder was distributed on the surface in the no-HEMA condition. This tendency corresponds with Figure 37, and the tendency increased when the coated paper was dried at high temperature.
According to Zang et al. (2010), binder particles are uniformly distributed just after coating and they move to the surface before the FCC. The authors also emphasized that binder migration results from Brownian motion of the particles. Therefore, it could be concluded that the fast immobilization hindered the migration of the swollen latex particles. Also, the increased differences between the HEMA conditions at high drying temperatures can be explained by the increase of particle mobility. That is, the binders migrated more in the no-HEMA and high-temperature conditions because the particles had higher mobilities at higher temperatures.
63
Figure 41. Cross section of coated paper:
(a) HEMA 0%-120℃, (b) HEMA 9%-120℃, (c) HEMA 0%-40℃, (d) HEMA 9%-40℃.
64
Figure 42. Binder distribution of coating layer dried at 120℃.
Figure 43. Binder distribution of coating layer dried at 40℃.
0 1 2 3 4 5 6 7 8 9 10 25 30 35 40 45 50 55
In
te
n
si
ty
(
%
)
Depth (m)
HEMA 0% HEMA 9% 0 1 2 3 4 5 6 7 8 9 10 25 30 35 40 45 50 55In
te
n
s
it
y
(
%
)
Depth (m)
HEMA 0% HEMA 9%65
4.4.4 Ink absorption
The ink absorbency of the coated paper decreased with increasing HEMA content and coat weight. Regarding coat weight, it is possible that the increased weight of the coating layer leveled out the surface enough to remove overlarge pores. Meanwhile, there are two likely causes of the ink absorption change between the HEMA conditions. One possible cause is the hydrophilicity of the latex. When the HEMA amount increased, the hydrophilicity of the latex film increased, as shown in Figure 45. This hydrophilic latex could have delayed the penetration of the ink vehicle, which is usually hydrophobic. The other possible cause is the increase in pore-size distribution. Xiang and his colleague (2000) reported that the ink setting rate could decrease with increasing pore-size distribution because it decreases the capillary pressure. In the present research, the increase of pore-size distribution in the high-HEMA condition was verified, as can be seen in Figure 30. Hence, this change in pore-size distribution could affect the ink absorption.
66
Figure 44. Ink absorption of coated paper.
Figure 45. Water contact angle of latex films.
10 15 20 25 30 26 28 30 32 34 36 38 40 42 44 In k ab s o rp ti o n ( % ) Coat weight (g/m2) HEMA 0 % HEMA 3 % HEMA 6 % HEMA 9 % 0 3 6 9 53 54 55 56 57 58 59 60 W a te r c o n ta ct a n g le ( °) HEMA (%)
67 4.4.5 Print gloss
Print gloss changed drastically depending on the HEMA conditions. As shown in Figure 46, print gloss seemed to increase with increasing HEMA content. This result has a direct relationship with the ink absorption results. As the ink absorption decreased, more ink could remain on the surface. The increased ink on the surface would have a positive effect on the leveling of the ink film, which would increase the print gloss. Also, it is well known that the ink setting rate has a negative relation with print gloss because of the increased leveling time. It is possible that the reduced ink absorption caused by the hydrophilicity also affected the ink setting rate.
Figure 47 shows the print gloss as a function of the coating weight. In the graph, the differences in coating weight conditions decreased when HEMA was used as a comonomer. From these results, it is supposed that the effect of the local difference of coating weight could have decreased in the S/A latex containing HEMA.
68
Figure 46. Print gloss of coated paper as a function of HEMA content.
Figure 47. Print gloss of coated paper as a function of coating weight.
0 3 6 9 70 71 72 73 P ri n t g lo s s (% ) HEMA Content (%) 18 21 24 27 30 66 69 72 75 78 P ri n t g lo s s (% ) Coat weight (g/m2) HEMA 0% HEMA 6%
69
The printed paper had a glossier surface even though the gloss of coated paper decreased. Therefore, the print snap, the gloss difference between the printed paper and unprinted paper, was calculated for further investigation. When the print snap is high, legibility is improved because the printed surface has a highlighting effect. Figure 48 shows a significant increase in the print snap with increasing HEMA content. Also, a more stable print snap was obtained when a large amount of HEMA was used, as seen in Figure 49. Therefore, it seems to be possible to obtain a high-quality printed surface through the use of HEMA-containing S/A latex.
Figure 48. Print snap of coated paper as a function of the HEMA content.
0 3 6 9 3 4 5 6 7 8 9 10 11 12 P ri n t sn ap ( % ) HEMA content (%)
70
Figure 49. Print snap of coated paper as a function of the coating weight.
18 21 24 27 30 0 3 6 9 12 15 18 P ri n t s n a p ( % ) Coat weight (g/m2) HEMA 0% HEMA 6%
71 4.4.6 Pick resistance
The use of HEMA in S/A latexes improved pick resistance. Figure 50 shows surface images of the tested paper. These images were converted to binary images, shown in Figure 51, to analyze the picked area. According to Figure 52, the picked area decreased with increasing HEMA content. Typically, picking happens in weak areas with less binder distribution. However, the coated paper in the high-HEMA condition had more uniform binder distribution, as illustrated in Figure 42 and Figure 43. Thus, there were fewer areas that had less binder, which could have improved the pick resistance.
Figure 50. Surface images of pick resistance test for HEMA contents of 0%, 3%, 6%, and 9%.