Analysis of the Vibration Characteristics of a Fuel Rod
Jong-Yeob Jung, Jeong-Sik Yim, Dong-Seong Sohn
Korea Atomic Energy Research Institute, 150 Duckjin Dong, Yusong Gu, Daejon. 1. Introduction
In this study, the modal characteristics of a fuel rod have been analyzed by using the finite element method and the possibility of the resonance between the fuel rod and a pressure flow which originates from a coolant pump has been investigated.
In order to analyze the modal characteristics of a fuel rod, the material properties of a clad and meat such as the density, Young’s modulus, and Poisson ratio were determined and the finite element model of the fuel rod was validated based on the experimental results of brass fuel rods.
The modal analyses were carried out for two kinds of fuel rods, one is the fuel rod which contains Zr-X%U as its meat material and the other contains Zr-Y%U. Each fuel rod was analyzed under the conditions of in-air and in-water surroundings for five different boundary conditions. The commercial code ANSYS (ver. 9) was used as a finite element analysis tool
2. Determination of the density and EI of a fuel rod
Figure 1 shows the overall shape of the fuel rod which consisted of clad (Zr-1Nb) and meat (Zr-X%U or Zr-Y%U). Since the material of the M1 region is only Zr-1Nb, the material properties were easily determined, however, the M2 region consisted of clad and meat materials so the density and EI of the region should be determined as equivalent values. The equivalent density of the M2 region was calculated as the following equation (1): Nb Zr U Zr Nb Zr Nb Zr U Zr U Zr equ A A A A 1 1 1 ) ( ) ( − − − − − − + × + × = ρ ρ ρ , (1)
where AZr−U, AZr−1Nb,ρZr−U and ρZr 1−Nbare the areas
and densities of meat and clad of the fuel rod, respectively.
The equivalent flexural rigidity, EI, of the M2 region was obtained by a finite element bending simulation of the fuel rod [1]. The deflection value of the fuel rod which is under the bending load is obtained from the finite element bending analysis and the EI can be calculated using the relation of deflection and load as the following equation (2) for fixed boundary conditions at both ends:
max 3 192⋅δ ⋅ = P L EI , (2)
where P, L and δmax are the load, rod length and maximum deflection of the fuel rod, respectively.
The bending analyses were carried out for total 10 cases in the case of the fuel rod that contained Zr-X%U as its meat material. The EI results are summarized in Table 1. As shown in Table 1, the EI results from the straight fuel rod model and twisted fuel rod model are similar and there is no big difference between the edge loading and plane loading. However, the results showed that EI is dependent on the temperature so the EI were determined as 6.45 Nm2 and 5.48 Nm2 for the temperatures of 20 0C and 310 0C, respectively, and these values were provided as inputs to the modal analysis of the fuel rod.
Figure 1 Overall shape of a fuel rod. Table 1 EI results at M2 region of a fuel rod.
max
δ (×10−4m) EI (N⋅m2)
Case Temp(0C) (mm)L Load
St. Tw. St. Tw. 1 Edge 0.059 0.059 5.9 5.89 2 0.1L Plane 0.057 0.057 6.05 6.05 3 Edge 0.540 0.540 6.35 6.35 4 0.2L Plane 0.539 0.539 6.37 6.36 5 Edge 41.3 41.4 6.44 6.44 6 20 L Plane 41.2 41.4 6.47 6.44 7 0.1L Edge 0.069 0.069 5.00 4.99 8 0.2L Edge 0.636 0.636 5.39 5.39 9 Edge 48.7 48.7 5.4 5.4 10 310 L plane 48.6 48.7 5.48 5.47
3. Modal analysis of a fuel rod
The modal analyses of a fuel rod were performed for 4 different cases as follows:
Case 1: Zr-X%U + Zr-1Nb and Temp. = 20 0C, Case 2: Zr-X%U + Zr-1Nb and Temp. = 310 0C, Case 3: Zr-Y%U + Zr-1Nb and Temp. = 20 0C, Case 4: Zr-Y%U + Zr-1Nb and Temp. = 310 0C. Five kinds of boundary condition, that were ‘free-free’, ‘simple-‘free-free’, ‘simple-simple’, ‘clamped-simple’, and ‘clamped-clamped’ at both ends of a fuel rod, were applied for each case. Temperature of 20 0C is assumed
M1 M2 M1
L
Transactions of the Korean Nuclear Society Autumn Meeting Busan, Korea, October 27-28, 2005
where the fuel rod is vibrated in an air surrounding and 310 0C is that for the water surrounding. Therefore, in the cases of ‘Case 2 and 4’, the added mass by water was considered during the modal analyses [2].
Tables 2 and 3 show the modal analysis results of ‘Case 1’ and ‘Case 2’, respectively. As shown in the results, the mode participation factor of the second mode has only about a 30 % value when compared to that of the first mode. Since the added mass was considered in ‘Case 2’, the natural frequencies of ‘Case 2’ are lower than that of ‘Case 1’.
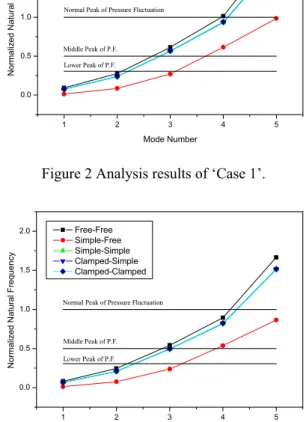
The peak frequencies of the pressure fluctuation originating from the coolant pump have 3 peak values for the low, middle and normal speed conditions, respectively. Figures 2 and 3 show the natural frequencies of a fuel rod with the 3 peak frequencies of the pressure fluctuation. The first mode frequencies of the fuel rod for various B.C. are much lower than that of the pressure flow so that a resonance between the fuel rod and the pressure flow is not expected. The frequencies of the second mode show similar results to the first mode. In the case of ‘Case 2’, it is shown that the third mode frequency under a ‘clamped-simple’ boundary condition is closer to the middle peak frequency of the pressure flow. However, since the modal participation factor of the third mode is less than 20 % when compared to that of the first mode and the cumulative mass fraction of the third mode is also less than 8 % of the total cumulative mass, it is expected that there is no serious problem from the resonance view point between the fuel rod and the pressure flow.
Table 2 Modal analysis results of ‘Case 1’ - Mode participation factor, and Cumulative mass fraction.
Mode -Free Free Simple -Free -Simple Simple -Simple Clamp -ClampClamp
1 1.000 0.964 1.000 0.878 1.000 0.852 1.000 0.853 1.000 0.852 2 0.193 0.999 0.367 0.997 0.294 0.925 0.291 0.926 0.293 0.925 3 0.018 0.999 0.045 0.998 0.193 0.957 0.195 0.958 0.196 0.958 4 0.012 1.000 0.029 0.999 0.177 0.984 0.174 0.984 0.175 0.984 5 0.001 1.000 0.027 1.000 0.137 1.000 0.137 1.000 0.137 1.000
Table 3 Modal Analysis Results of ‘Case 2’ - Mode participation factor, and Cumulative mass fraction.
Mode -Free Free Simple -Free -Simple Simple -Simple Clamp -ClampClamp
1 1.000 0.999 1.000 0.879 1.000 0.853 1.000 0.854 1.000 0.853 2 0.019 0.999 0.366 0.997 0.293 0.926 0.291 0.926 0.292 0.926 3 0.023 0.999 0.043 0.998 0.190 0.957 0.192 0.958 0.193 0.958 4 0.002 0.999 0.031 0.999 0.178 0.984 0.175 0.984 0.176 0.984 5 0.002 1.000 0.027 1.000 0.137 1.000 0.136 1.000 0.137 1.000 1 2 3 4 5 0.0 0.5 1.0 1.5 2.0
Normal Peak of Pressure Fluctuation
Middle Peak of P.F. Nor m ali zed Natur al F reque ncy Mode Number Free-Free Simple-Free Simple-Simple Clamped-Simple Clamped-Clamped Lower Peak of P.F.
Figure 2 Analysis results of ‘Case 1’.
1 2 3 4 5 0.0 0.5 1.0 1.5 2.0
Normal Peak of Pressure Fluctuation
Norm al ized N atura l F requency Mode Number Free-Free Simple-Free Simple-Simple Clamped-Simple Clamped-Clamped Middle Peak of P.F. Lower Peak of P.F.
Figure 3 Analysis results of ‘Case 2’.
4. Conclusion
The modal characteristics of a fuel rod have been analyzed by using the finite element method and the possibility of a resonance between the fuel rod and the pressure flow which originates from the coolant pump has been evaluated.
From the analysis results, it was found that there would be no problem from the resonance view point between the fuel rod and the pressure flow.
ACKNOWLEDGEMENTS
The authors would like to express their appreciation to the MOST for the support of this work through the mid- and long-term nuclear R & D Project.
REFERENCES
[1] R. R. Craig Jr, Mechanics of Materials – 2nd Edition, John
Wiley & Sons, 1999.
[2] R. D. Blevins, Formulas for Natural Frequency and Mode Shape, 1979.