저작자표시-비영리-변경금지 2.0 대한민국 이용자는 아래의 조건을 따르는 경우에 한하여 자유롭게 l 이 저작물을 복제, 배포, 전송, 전시, 공연 및 방송할 수 있습니다. 다음과 같은 조건을 따라야 합니다: l 귀하는, 이 저작물의 재이용이나 배포의 경우, 이 저작물에 적용된 이용허락조건 을 명확하게 나타내어야 합니다. l 저작권자로부터 별도의 허가를 받으면 이러한 조건들은 적용되지 않습니다. 저작권법에 따른 이용자의 권리는 위의 내용에 의하여 영향을 받지 않습니다. 이것은 이용허락규약(Legal Code)을 이해하기 쉽게 요약한 것입니다. Disclaimer 저작자표시. 귀하는 원저작자를 표시하여야 합니다. 비영리. 귀하는 이 저작물을 영리 목적으로 이용할 수 없습니다. 변경금지. 귀하는 이 저작물을 개작, 변형 또는 가공할 수 없습니다.
The Effects of Vitamin Dand Sarcopenia
on Bone Mineral Densityin Korean women
by
Myat Kyi La Thein
Major in Family Medicine
Department of Family Practice and Community Health
Graduate School of Medicine, Ajou University
The effects of
Vitamin D and Sarcopenia on
Bone Mineral Density
in Korean woman
by
Myat Kyi La Thein
A dissertation submitted to The Graduate School of Medicine
Ajou University
in Fulfillment of the Requirements for the Degree of
Master of Family Medicine
Supervised by
BomTaeck Kim MD. PhD.
Department of Family Practice and Community Health
The Graduate School of Medicine, Ajou University
This certifies that the dissertation of
Myat Kyi La Thein is approved
SUPERVISORY COMMITTEE
BOM TAECK KIM MD.PhD.
JAE HONG AHN MD.PhD
ABSTRACT
A osteoporotic fracturehasbecome a global health issue that causes tremendous impact on mortality as well as heavy socioeconomic burden. Previous studies suggestedthat vitamin D may prevent fractures by improving muscle mass as well as via increasing bone density directly.The purpose of the study is to determine thatthe influence of vitamin D on bone mineral density depends on its effects on muscle mass. We analyzed the data from Korean National Health and Nutritional Survey IV in 2009.Women older than age 20 were included for the analyses.Bone mineral density and muscle mass were measured by DXA. Serum vitamin D concentration was tested.
Vitamin D and muscle mass affected BMD at proximal femur, but not at lumbar spine. Vitamin D deficiency and sarcopenia increased odd ratio for osteoporosis before and after adjusted for multiple variables. The effects of vitamin D deficiency on BMD still remained significant after adjustment for sarcopenia, which was vice versa.
Though vitamin D deficiency and sarcopenia shared common effects on BMD, they have their own effects on BMD independent from each other.
TABLE OF CONTENTS
ABSTRACT
CHAPTER 1. INTRODUCTION
1.1 Background
1.2 Motivation for the study
1.3 Objectives
CHAPTER 2. METHODOLOGY
2.1 Participants
2.2 Definitions of sarcopenia, osteoporosis and Vitamin D
deficiency
2.3 Statistical analysis
CHAPTER 3. PRESENTATION OF RESULTS
3.1 General characteristics of study populataion
3.2 Correlation among serum Vitamin D, appendicular skeletal
muscle mass and BMD.
3.3Influence of Vitamin D on sarcopenia
3.4
The risk for osteoporosis according to vitamin D deficiency
CHAPTER 4. SUMMARY, DISCUSSIONAND CONCLUSION
4.1 Summary of findings
4.2 Discussion
4.3 Conclusion
REFERENCES
ACKNOWLEDGEMENTS
CHAPTER 1. INTRODUCTION
1.1 Background
A osteoporotic fracturehasbecome a global health issuethat cause tremendous impact on mortality as well as heavy socioeconomic burden.The estimated number of new osteoporotic fractures for the year 2000 was 9.0 million and fracture sufferers were estimated at 56 million worldwide, [1] Osteoporotic hip fractures cause the most morbidity with reported mortality rates up to 20-24% in the first year after a fracture, and greater risk of death persists for at least 5 years afterwards. Osteoporosis in Europe also contributed to a higher burden than the common neoplastic disorders, save only for lung cancer.[2] In 2004, the estimated cost of treating patients hospitalized with a diagnosis of osteoporosis was $19.1 billion
Vitamin D is anessential hormone for absorption of calcium in intestine and mineralization ofbone. Lips P et al. (2001) showed that inadequate serum vitamin D concentration leads to insufficient mineralization of bone and results inosteomalacia and osteoporosis. [3] The National Health and Nutrition Examination Survey (NHANES)showed that bone mineral density (BMD) correlates positively with 25-hydroxy vitamin D (25(OH) D) concentration in Caucasian women. [4]Vitamin D also reportedly has positive effects on skeletal muscle and strength. Several studies insinuated that vitamin D may influence BMD via its beneficial effects on skeletal muscle. [8,9]Several studies have shown a positive relationship between lean mass and BMD.[5, 6] Women with osteoporosisshowed significantly lower appendicular skeletal muscle mass,relative toage-matched controls without osteoporosis.[7]
1.2 Objectives
The purpose of the study is to determine that the positive influence of vitamin D on BMD depends on its beneficial effects on muscle mass.
CHAPTER 2. METHODOLOGY
2.1 Study Participants
This study is based upon the data acquired during the second year (2009) of KNHANES IV, cross-sectional and nationally representative survey conducted by the Division of Chronic Disease Surveillance, Korea Centers for Disease Control and Prevention. Data were collected via household interviewsand direct standardized physical examinations conducted in specially equipped mobile examination centers.
The sampling frame was developed based on the 2005 population and housing census in Korea. Household units were selected by a stratified multistage probability sampling design. Two hundred national districts from primary sampling units were randomly sampled, in 2009. Finally, 10078 participated in the health interviews and health examination surveys. We combined the data collected from 7920 participants of KNHANES (ALL) and 8320 participants of KHNANES (DXA) in this study. Among them 3820 women older than 20 years were selected. Premenopausal women who are free from osteoporosis treatment, renal failure and any type of cancer were determined as reference population.
2.2 Definition of osteoporosis, sarcopenia and vitamin D
deficiency
DXA (Hologic Discovery-W; Hologic) was used for the measurement of bone mineral density and appendicular muscle mass of the participants.
We use WHO definition, BMD value of 2.5 standard deviation or more below mean for normal young adult or t score of -2.5 to be defined as osteoporosis. Those less than but not reaching -2.5 standard deviation is regarded as osteopenia.
Appendicular Skeletal Mass (ASM) was calculated as the sum of muscle mass in arms and legs, assuming that all nonfat and non-bone tissue is skeletal muscle. Weight-adjusted ASM (total ASM divided by weight x 100) and height adjusted ASM (total ASM divided by height squared) [10]. The calculated weight adjusted ASM value between mean value (28.05%) and 2 standard deviation (24.23%) of reference population is regarded as type 1 sarcopenia and below the 2 standard deviation value is regarded as type 2 sarcopenia (Jansen et. al and Lim et. al).
Serum 25(OH)D levels were measured using a gamma counter (1470 Wizard, Perkin-Elmer) with an radio immunoassay (DiaSorin, Still- water, MN25-hydroxyvitamin D (25(OH) D) level between 10-20 ng per milliliter (25nmol per liter) is considered insufficient and below 10ng/dl is considered deficient in Korean population. (Y.-C Hwang et al: Optimal 25-hydroxyvitamin D level for bone (2012)) [11]
2.3 Statistical analysis
Statistical analyses were performed using SPSS software for Mac version 19.0 (SPSS Inc., Chicago, IL). The mean value and standard deviations of gender specific baseline characteristics (age, weight, height, BMI), and body composition including bone mineral density (total, femur, hip, lumbar) were done.Groups of BMDs, vitamin D and weight-adjusted muscle were formed according to cut-off values. The mean and standard deviation values were grouped into 2 and compared according to sarcopenia status by independent T test. The bivariate correlation and partial correlation after adjusting age and BMI, menstrual status moderate exercise and calcium intakeamong the bone mineral densities, vitamin D, and weight adjusted muscle mass were tested. The odd ratios of sarcopenia and vitamin D deficiency on bone mineral density(BMD) and Vitamin D deficiency on BMD, unadjusted and adjusted for multiple levels were analyzed bylogistic regression tests.
CHAPTER 3. PRESENTATION OF RESULTS
3.1 General characteristics of study populataion
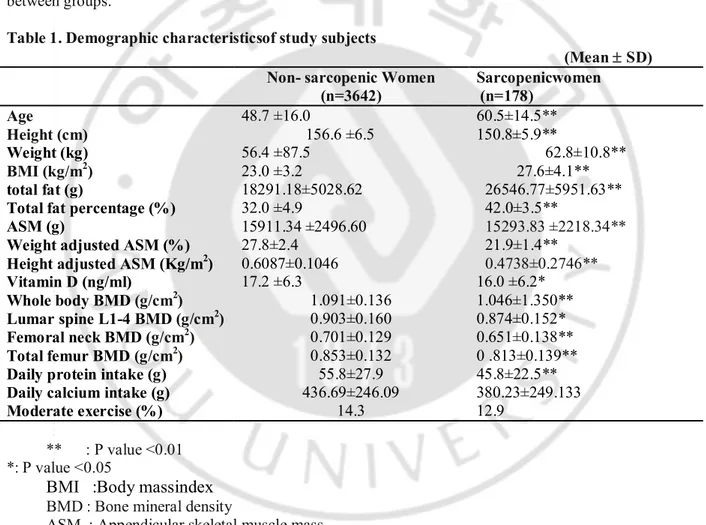
3820 women from age 20 to 91 were included for the analyses. Sarcopenic women were older, shorter in height, and more overweighted than non sarcopenic women. Sarcopenic group had less muscle mass and more fat massthan non-sarcopenic groupbefore and after adjusted for weight or height. Vitamin D concentration and BMD were lower in sarcopenic women, compared to the non-sarcopenic. Daily protein intake was less in sarcopenic group than in non-sarcopenic group while calcium intake did not differ between groups.
Table 1. Demographic characteristicsof study subjects
(Mean ± SD) Non- sarcopenic Women
(n=3642) Sarcopenicwomen (n=178) Age 48.7 ±16.0 60.5±14.5** Height (cm) 156.6 ±6.5 150.8±5.9** Weight (kg) 56.4 ±87.5 62.8±10.8** BMI (kg/m2) 23.0 ±3.2 27.6±4.1** total fat (g) 18291.18±5028.62 26546.77±5951.63**
Total fat percentage (%) ASM (g)
Weight adjusted ASM (%) Height adjusted ASM (Kg/m2)
32.0 ±4.9 15911.34 ±2496.60 27.8±2.4 0.6087±0.1046 42.0±3.5** 15293.83 ±2218.34** 21.9±1.4** 0.4738±0.2746** Vitamin D (ng/ml) 17.2 ±6.3 16.0 ±6.2* Whole body BMD (g/cm2) 1.091±0.136 1.046±1.350** Lumar spine L1-4 BMD (g/cm2) 0.903±0.160 0.874±0.152* Femoral neck BMD (g/cm2) 0.701±0.129 0.651±0.138** Total femur BMD (g/cm2) 0.853±0.132 0 .813±0.139**
Daily protein intake (g) 55.8±27.9 45.8±22.5**
Daily calcium intake (g) Moderate exercise (%) 436.69±246.09 14.3 380.23±249.133 12.9 ** : P value <0.01 *: P value <0.05
BMI :Body massindex
BMD : Bone mineral density
3.2 Correlation amongserum Vitamin D, appendicular skeletal
muscle mass and BMD.
In bivariatecorrelation, vitamin D positively correlated only with height adjusted ASM , not with weight adjusted ASM before and after adjusted for age, mentrual status, daily calcium intake and moderate exercise.Though vitamin D concentration did not show a correlation with femoral BMDs and even negative correlation with lumbar BMD in unadjusted model, after the adjustment, vitamin D had weak but significant correlations with femoral neck and total femur BMD while negative correlation betweeen vitamin D and lumbar BMD disappeared. Weight adjusted and height adjusted ASM had significant positive correlations with all BMDs. Strength of correlation between any BMDs and height adjusted ASM was greater than that between the BMDs and weight adjusted ASM.
Table 2. Bivariate Correlations among vitamin D, appendicular skeletal muscle mass and BMDs at various sites. Vitamin D Weight Adjusted ASM Height Adjusted ASM Whole body BMD Lumbar spine BMD Femoral Neck BMD Total Femur BMD Vitamin D unadjusted -0.010 0.048** -0.008 -0.037** -0.021 0.020 Adjusted 0.039 0.056* 0.060 0.042 0.066** 0.093** Weight adjusted ASM unadjusted 0.094** 0.076** 0.033** 0.066** 0.014** adjusted 0.644** 0.124** 0.024 0.082** 0.048* Height Adjusted ASM unadjusted 0.163** 0.187** 0.218** 0.267** adjusted 0.197** 0.216** 0.246** 0.316** Wholebody BMD unadjusted 0.527** 0.495** 0.495** adjusted 0.657** 0.602** 0.596** Lumbar spine BMD unadjusted 0.542** 0.537** adjusted 0.640** 0.662** Femoral Neck BMD unadjusted 0.699** adjusted 0.859** Total Femur BMD unadjusted adjusted ** : P value <0.01 · : P value <0.05
BMD : Bone mineral denisty
ASM : Appendicular skeletal muscle mass
3.3 Influence of Vitamin D on sarcopenia
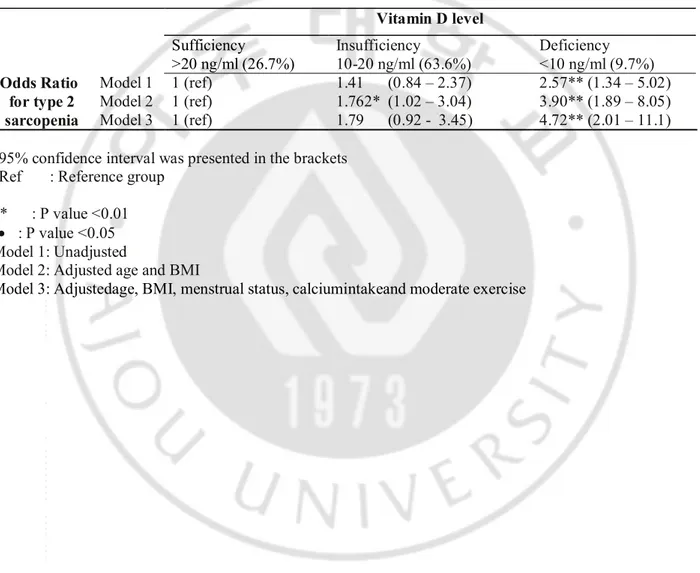
Woman with vitamin D deficiency had 2.57 times greater odds ratio fortype 2 sarcopenia, compared with woman with sufficient vitamin D level. After adjusted for the multiple variables, the odd ratio went up to 4.72 times. Thoughvitamin D insufficiency hadno significant effect on sarcopenia in unadjusted and multiple variables adjusted model, it did show trend for sarcopenia
Table 3. Unadjusted and adjusted odds ratio ofvitamin D deficiency for sarcopenia.
95% confidence interval was presented in the brackets Ref : Reference group
** : P value <0.01 · : P value <0.05 Model 1: Unadjusted
Model 2: Adjusted age and BMI
Model 3: Adjustedage, BMI, menstrual status, calciumintakeand moderate exercise
Vitamin D level Sufficiency >20 ng/ml (26.7%) Insufficiency 10-20 ng/ml (63.6%) Deficiency <10 ng/ml (9.7%) Odds Ratio for type 2 sarcopenia Model 1 1 (ref) 1 (ref) 1 (ref) 1.41 (0.84 – 2.37) 1.762* (1.02 – 3.04) 1.79 (0.92 - 3.45) 2.57** (1.34 – 5.02) 3.90** (1.89 – 8.05) 4.72** (2.01 – 11.1) Model 2 Model 3
3.4The risk for osteoporosis according to vitamin D deficiency
and Sarcopenia
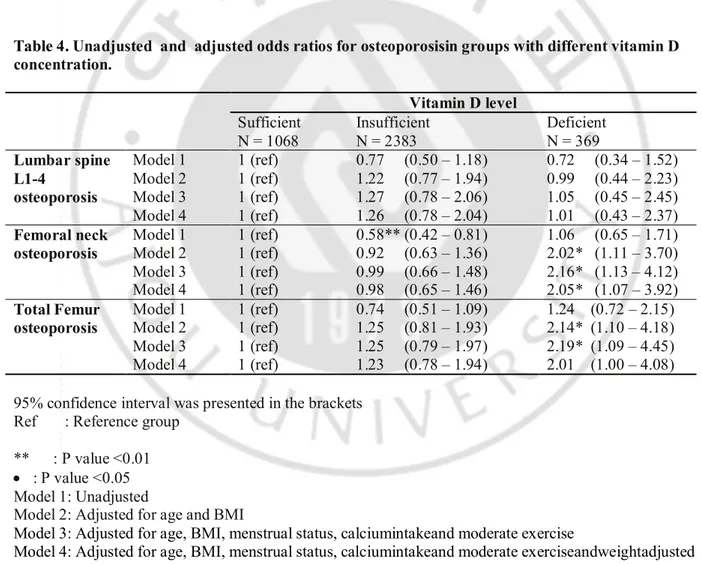
In unadjusted model, relative to women with sufficient vitamin D, women with neither vitamin D insufficiencynor deficiency did not show significant odd ratio for osteoporosis at any site except femoral neck in vitamin D insufficient group.However afteradjusted age, BMI, menstrual status, calciumintakeand moderate exercise , odds ratios for osteoporosis at femoral neck and total femur became significant in women with vitamin D deficiency .
After adjusted for height adjusted ASMas well as other variables, odds ratios remainedsignificant at femoral neck and showed same trend at total femur. Vitamin D insufficiencyor deficiency did not show effects on lumbar BMD in any model.
Table 4. Unadjusted and adjusted odds ratios for osteoporosisin groups with different vitamin D concentration. Vitamin D level Sufficient N = 1068 Insufficient N = 2383 Deficient N = 369 Lumbar spine L1-4 osteoporosis Model 1 1 (ref) 1 (ref) 1 (ref) 1 (ref) 0.77 (0.50 – 1.18) 1.22 (0.77 – 1.94) 1.27 (0.78 – 2.06) 1.26 (0.78 – 2.04) 0.72 (0.34 – 1.52) 0.99 (0.44 – 2.23) 1.05 (0.45 – 2.45) 1.01 (0.43 – 2.37) Model 2 Model 3 Model 4 Femoral neck osteoporosis Model 1 1 (ref) 1 (ref) 1 (ref) 1 (ref) 0.58** (0.42 – 0.81) 0.92 (0.63 – 1.36) 0.99 (0.66 – 1.48) 0.98 (0.65 – 1.46) 1.06 (0.65 – 1.71) 2.02* (1.11 – 3.70) 2.16* (1.13 – 4.12) 2.05* (1.07 – 3.92) Model 2 Model 3 Model 4 Total Femur osteoporosis Model 1 1 (ref) 1 (ref) 1 (ref) 1 (ref) 0.74 (0.51 – 1.09) 1.25 (0.81 – 1.93) 1.25 (0.79 – 1.97) 1.23 (0.78 – 1.94) 1.24 (0.72 – 2.15) 2.14* (1.10 – 4.18) 2.19* (1.09 – 4.45) 2.01 (1.00 – 4.08) Model 2 Model 3 Model 4
95% confidence interval was presented in the brackets Ref : Reference group
** : P value <0.01 · : P value <0.05 Model 1: Unadjusted
Model 2: Adjusted for age and BMI
Model 3: Adjusted for age, BMI, menstrual status, calciumintakeand moderate exercise
Model 4: Adjusted for age, BMI, menstrual status, calciumintakeand moderate exerciseandweightadjusted ASM
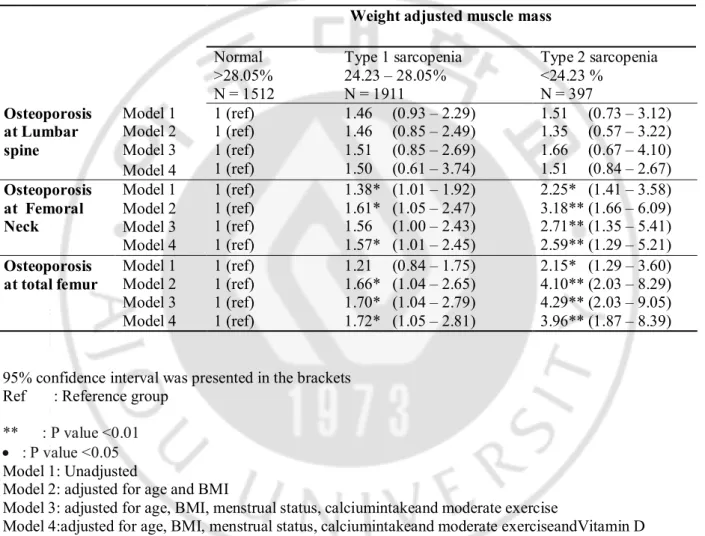
Before adjustment, the odds ratios for osteoprosis attotal femur and femoral neckin type 2 sarcopeniawere 2.25 and 2.15 respectively, compared with normal muscle group. After adjustment for the mutiple variables, the odd ratios were 2.71 and 4.29 respectively intype 2 sarcopenia, Even after adjusted for Vitamin D concentration, the relationship between sarcopenia and osteoporosis remained significant.Type 1 sarcopenia showed similar trends wtih type 2 sarcopenia. Both type 1 and type 2 sarcopenia did not show any effects on lumbar BMD.
Table 5. Unadjusted and adjusted odds ratios for osteoporosis in groups classified by weight adjusted ASM
95% confidence interval was presented in the brackets Ref : Reference group
** : P value <0.01 · : P value <0.05
Model 1: Unadjusted
Model 2: adjusted for age and BMI
Model 3: adjusted for age, BMI, menstrual status, calciumintakeand moderate exercise
Model 4:adjusted for age, BMI, menstrual status, calciumintakeand moderate exerciseandVitamin D concentration
Weight adjusted muscle mass
Normal >28.05% N = 1512 Type 1 sarcopenia 24.23 – 28.05% N = 1911 Type 2 sarcopenia <24.23 % N = 397 Osteoporosis at Lumbar spine Model 1 1 (ref) 1 (ref) 1 (ref) 1 (ref) 1.46 (0.93 – 2.29) 1.46 (0.85 – 2.49) 1.51 (0.85 – 2.69) 1.50 (0.61 – 3.74) 1.51 (0.73 – 3.12) 1.35 (0.57 – 3.22) 1.66 (0.67 – 4.10) 1.51 (0.84 – 2.67) Model 2 Model 3 Model 4 Osteoporosis at Femoral Neck Model 1 1 (ref) 1 (ref) 1 (ref) 1 (ref) 1.38* (1.01 – 1.92) 1.61* (1.05 – 2.47) 1.56 (1.00 – 2.43) 1.57* (1.01 – 2.45) 2.25* (1.41 – 3.58) 3.18** (1.66 – 6.09) 2.71** (1.35 – 5.41) 2.59** (1.29 – 5.21) Model 2 Model 3 Model 4 Osteoporosis
at total femur Model 1 1 (ref) 1 (ref) 1 (ref) 1 (ref) 1.21 (0.84 – 1.75) 1.66* (1.04 – 2.65) 1.70* (1.04 – 2.79) 1.72* (1.05 – 2.81) 2.15* (1.29 – 3.60) 4.10** (2.03 – 8.29) 4.29** (2.03 – 9.05) 3.96** (1.87 – 8.39) Model 2 Model 3 Model 4
CHAPTER4. SUMMARY, DISCUSSIONAND CONCLUSION
4.1 Summary of Findings
Both vitamin D concentration and muscle mass positively correlated withBMDsat femoral neck and total femur, but not at lumbar spine. Compared with women with sufficient vitamin D concentration, women with vitamin D deficiency weremore than 2 times likelihood to haveosteoporosisat femoral neck and total femur, independent of influence from muscle mass. Sarcopeniaalso hadnegative impact on BMD like vitamin D deficiency and sarcopenia also has independent effects from vitamin D.
4.2 Discussion
In consistent with our study,a number of cross-sectional studiesincluding Rancho Bernardo’s study have reported that serum concentrations of vitamin D were positively related to bone density atproximal femur in the elderly. [12,13] A study [14] including middle-aged women also reported similar relationship between vitamin D concentration and femoral BMD. Supplementation of vitamin D3 for two years in combination with calcium was reported a significant reduction in hip fractures among community dwelling population, resulting in 33% lower rate for osteoporotic fracture and a 22% lower rate for first fracture at any site compared to placebo [15].
Bischoff Ferrari study [16] suggestedthat positive association of serum vitamin D concentration and BMD may be greater in the 90–100 nmol/L (36 - 40ng/L) serum range of vitamin D. Our study indicated that the sufficient level of Vitamin D for BMD can be just above 20ng/ml in Korean population which is pretty lower than in Caucasian population.
Cross-sectional studies showeda positive relationship between vitamin D concentration and muscle mass with aging.In a previous study based on KHNANES, elder Korean men and women with sarcopeniashowed lower 25(OH) D levels, regardless of BMI[17].The longitudinal aging study Amsterdam reported thatlow
vitamin D is associated with loss of muscle mass and strength. [18]
Vitamin D has beneficial effects on BMD through promoting muscle mass and contractibility. Vitamin Dreceptor is expressed not only in osteoblast [19] but alsoin myoblast [20]. In vitro evidence has demonstrated that vitamin D increases protein synthesis in myoblast and facilitates differentiation of myoblast, resulting in increase in size and number of type 2 muscle fibers [21]. In combination with co- factors ‘‘retinoid X receptor’’ and ‘‘Steroid Receptor Coactivator 3’’ (SRC), the VDR: 1,25(OH)2vitamin D
modulates gene expression of a number of proteins, via binding to specific target gene promoter regions, known as ‘‘vitamin D response elements’’ (VDRE) [22, 23] results in enhanced transcription of a range of proteins.Calbindin [24],one of proteins induced by vitamin D, plays a role in regulating the membrane calcium channel in skeletal muscle for contractile function, which promotes bone formation. The other is insulin-like growth factor binding protein 3 (IGFBP-3) [22] regulatesaction of insulin like growth factor 1 (IGF-1) thatnot only stimulates terminal differentiation of muscle cells into myotubesbut also promotes stem-cell mediated muscle regeneration and hypertrophy of skeletal muscle. Lean body mass may protect
contraction. Muscle contraction stimulates periosteal apposition, which can also be directly induced by mechanical strain through mechanoreceptors in osteocytes.[25, 26].The beneficial effects of vitamin D on muscle may be explained by moderating secondary hyperparathyroidism which induce atrophy of type 2 muscle fibres in animal models [27]
The Michigan Bone Health Study reported that decreased BMD at the proximal femur could be attributed to premenopausal muscle loss in proximal thigh[28].Another study showed that postmenopausal women with sarcopenia had lower BMD in the femoral neck and total femur. A 12-year longitudinal study [29] showed that reduction in lean body mass contributes to decline in proximal femur BMD. Lean mass is the strongest predictor of cortical bone mineral content of the femur in postmenopausal women [30]but not in the lumbar area. [31]Osteophyticcalcification found in degenerative spondylosis and vascular calcification, usually at the aorta and its major branches can interfere with the interpretation of lumbar BMD and mask the relationship between vitamin D and lumbar spine. [32]. In postmenopausal women the rate of change of bone mineral density, especially at the lumbar spine, may be related to VDR allelic polymorphisms. [33]Observing the change of lumbar-spine bone mineral density over 18 months in 72 elderly subjects, 9 BB homozygotes lost bone mineral density but 26 homozygotes for the alternative genotype (bb) did not (mean change -2.3 [SE 1.0] vs 0.9 [0.7]% per year, p < 0.05), irrespective of calcium intake.
The lumbar BMD in the genotype (bb) 26 homozygotes did not decrease (mean change -2.3 [SE10] vs 0.9 [0.7]% per year, p<0.05), irrespective of calcium intake. [34] Lumbar vertebrae, which consist primarily of cancellous bone, are more affected by estrogen levels than the femur. In contrast, the femur contains more cortical bone, and has a lower metabolic rate than trabecular bones.
Vitamin D affects bone formation through stimulating osteoblasts differentiation and suppressing osteoblast apoptosis, which is not related with muscle mass.Vitamin D deficiency causes secondary hyperparathyroidism that increases bone resorption leading to decline in BMD. [34] The cytokines 1, IL-6 and TNF- α have been shown to regulate bone [35] and evidence from animal models has suggested that cytokines are associated with the development of osteoporosis [36,37] through stimulation of osteoclastogenesis and subsequent bone resorption [38]. Vitamin D level had been more consistently associated with hip BMD than lumbar BMD. [39] Similar results were obtained in a previous study based on KHNANES 2009 -2010 [40]
KHNANESIV is a largepopulation-based National wide study, which can increase the statistical reliability of the results. There is only one ethnicity in our study that we can prevent bias originated from diverse ethnicity. The results of our study were adjusted by the body compositions measured by DXA, that has a privilege in accuracy.
Our study has few limitations.The cross-sectional design in our study is one of them. We did not include the function of skeletal muscle such as strength. However muscle strength well correlates with muscle mass and age which we included in the adjustment.
4.3Conclusion
Though vitamin D and muscle mass share beneficial effects on bone mineral density, they haveindependent influence from each otheron BMD
Reference
1. Cooper C, Campion G, Melton LJ 3rd. Hip fractures in the elderly: a worldwide projection. Osteoporos Int. 1992 Nov;2(6):285-9
2. O. Jonell. J. A Kanis An estimate of the worldwide prevalence and disability associated wit osteoporotic fractures: Osteoporosis Int (2006) 17:1726-1733
3. Lips, P. Vitamin D deficiency and secondary hyperparathyroidism in the elderly: consequences for bone loss and fractures and therapeutic implications. Endocrinology. Rev. 2001, 22, 477-501.
4. Eamon Laird, Mary Ward. Vitamin D and Bone Health; Potential Mechanisms. Nutrients 2010, 2, 693-724;doi:10;3390/nu2070693.
5. Bakker I, Twisk JW, Van Mechelen W, Kemper HC (2003) Fat-free body mass is the most important body composition determinant of 10-year longitudinal development of lumbar bone in adult men and women. J ClinEndocrinolMetab 88:2607–2613
6. Blain H, Vuillemin A, Teissier A, Hanesse B, Guillemin F, Jeandel C (2001) Influence of muscle strength and body weight and composition on regional bone mineral density in healthy women aged 60 years and over. Gerontology 47:207–212.
7. Marianne C. Walsh Æ Gary R. Hunter Margaret Barbara Livingstone Sarcopenia in premenopausal and postmenopausal women with osteopenia, osteoporosis and normal bone mineral density
8. Sato, Y.; Iwamoto, J.; Kanoko, T.; Satoh, K. Low-Dose Vitamin D Prevents Muscular Atrophy and Reduces Falls and Hip Fractures in Women after Stroke: A Randomized Controlled Trial. Cerebrovasc. Dis. 2005, 20, 187-192.
9. Gerdhem, P.; Ringsberg, K.A.M.; Obrant, K.J.; Akesson, K. Association between 25-hydroxy vitamin D levels, physical activity, muscle strength and fractures in the propective population-based OPRA study of elderly women. Osteoporos. Int. 2005, 16, 1425-1431.
10. Janssen I, Heymsfield SB, Ross R. Low relative skeletal muscle mass (sarcopenia) in older persons is associated with functional impairment and physical disability. J Am Geriatr Soc. 2002;50:889–896.
11. Hwang YC, et al. Optimal serum concentration of 25-hydroxyvitamin D for bone health in older Korean adults Calcif Tissue Int. 2013 Jan;92(1):68-74. doi: 10.1007/s00223-012-9669-3. Epub 2012 Nov 20.
12. Saquib N, von Muhlen D, Garland CF, Barrett-Connor E (2006) Serum 25-hydroxyvitamin D, parathyroid hormone, and bone mineral density in men: the Rancho Bernardo study. OsteoporosInt 17:1734–1741.
13. Von Muhlen DG, Greendale GA, Garland CF, Wan L, Barrett- Connor E (2005) Vitamin D, parathyroid hormone levels and bone mineral density in community-dwelling older women: the Rancho Bernardo Study. OsteoporosInt 16:1721–1726
14. Khaw, K.T.; Sneyd, M.J.; Compston, J. Bone density, parathyroid hormone and 25-hydroxyvitamin D concentrations in middle-aged women. Br. Med. J. 1992, 305, 273-277.
15. Trivedi, D.P.; Doll, R.; Khaw, K.T. Effect of four monthly oral vitamin D3 [cholecalciferol]supplementation on fractures and
mortality in men and women living in the community:randomised double blind controlled trial. BMJ 2003, 326, 469
16.Bischoff-Ferrari, H.A; Dietrich, T.; Orav, E.J.; Dawson-Hughes, B. Positive association between 25-hydroxy vitamin D levels and bone mineral density: a population-based study of younger and older adults. Am. J. Med. 2004, 116, 634-639.
17. Kim MK, Baek KH, Song KH, Il Kang M, Park CY, Lee WY, Oh KW (2011) Vitamin D deficiency is associated with sarcopenia in older Koreans, regardless of obesity: the Fourth Korea National Health and Nutrition Examination Surveys (KNHANES IV) 2009. J ClinEndocrinolMetab 96:3250–3256
18. MARJOLEIN VISSER, DORLY J. H. DEEG, AND PAUL LIPS (2003) Low Vitamin D and High Parathyroid Hormone Levels as Determinants of Loss of Muscle Strength and Muscle Mass (Sarcopenia): The Longitudinal Aging Study Amsterdam. The Journal of Clinical Endocrinology & Metabolism 88(12):5766–5772
19.Costa, E.M.; Blau, H.M.; Feldman, D. 1,25-dihydroxyvitamin D3 receptors and hormonalresponses in cloned human skeletal muscle cells. Endocrinology 1986, 119, 2214-2220..
20. Simpson, R.U.; Thomas, G.A.; Arnold, A.J. Identification of 1,25-dihydroxyvitamin D3 receptorsand activities in muscle. J. Biol.
Chem. 1985, 260, 8882-8891.
21. Sorensen, O.H.; Lund, B.; Saltin, B.; Lund, B.; Andersen, R.B.; Hjorth, L.; Melsen, F.;Mosekilde, L. Myopathy in bone loss of ageing: improvement by treatment with 1 alpha-hydroxycholecalciferol and calcium. Clin. Sci. (Lond).1979, 56, 157-161. 22.Peng L, Malloy P, Feldman D. Identification of a functional vitamin d response element in the human insulin- like growth factor binding protein-3 promoter. MolEndocrinol 2004: 18: 1109–1119.
23. Liao L, Chen X, Wang S, Parlow A, Xu J. Steroid receptor coactivator 3 maintains circulating insulin-like growth factor 1 (IGF-1) by controlling IGF-binding protein 3 expression. Mol Cell Biol 2008: 28: 2460–2469.
24. Fleet J. Rapid, membrane-initiated actions of 1,25 dihydroxyvitamin D: what are they and what do they mean? J Nutr 2004: 134: 3215–3218.
25. Petit MA, Beck TJ, Lin HM, Bentley C, Legro RS, Lloyd T (2004) Femoral bone structural geometry adapts to mechanical loading and is influenced by sex steroids: the Penn State Young Women’s Health Study. Bone 35:750–759.
26. Frost HM (1987) The mechanostat: a proposed pathogenic mech- anism of osteoporoses and the bone mass effects of mechanical and nonmechanical agents. Bone Miner 2:73–85.
27. Garber, A.J. Effects of parathyroid hormone on skeletal muscle protein and amino acid metabolism in the rat. J. Clin. Invest. 1983, 71, 1806-1821.
28. Sowers M, Crutchfield M, Bandekar R, Randolph JF, Shapiro B, Schork MA, Jannausch M (1998) Bone mineral density and its change in pre-and perimenopausal white women: the Michigan Bone Health Study. J of Bone and Mineral Res 13:1134–1140.
29. Liu-Ambrose T, Kravetsky L, Bailey D, Sherar L, Mundt C, Baxter-Jones A, Khan KM, McKay HA (2006) Change in lean body mass is a major determinant of change in areal bone mineral density of the proximal femur: a 12-year observational study. Calcif Tissue Int 79:145–151
30. Schoffl I, Kemmler W, Kladny B, Vonstengel S, Kalender WA, Engelke K (2008) In healthy elderly postmenopausal women var- iations in BMD and BMC at various skeletal sites are associated with differences in weight and lean body mass rather than by variations in habitual physical activity, strength or VO2max. J Musculoskelet Neuronal Interact 8:363–374
31. Petit MA, Beck TJ, Lin HM, Bentley C, Legro RS, Lloyd T (2004) Femoral bone structural geometry adapts to mechanical loading and is influenced by sex steroids: the Penn State Young Women’s Health Study. Bone 35:750–759
32. Morrison NA, Qi J-C, Tokita A, et al. Prediction of bone density by vitamin D receptor alleles. Nature 1994; 367: 284-87. 33. S Ferrari, R Rizzolli, Vitamin D receptor gene polymorphisms and change in lumbar spine bone mineral density, Lancet 1995; 345: 423-24.
34.Montero-Odasso M, Duque G (2005) Vitamin D in the aging musculoskeletal system: an authentic strength preserving hormone.
Mol Aspects Med 26:203–219.
35.Muller, K.; Haahr, P.M.; Diamant, M. 1,25-Dihydroxyvitamin D3 inhibits cytokine production by human blood monocytes at the post-transcriptional level. Cytokine 1992, 4, 506-512.
36.Evans, K.N.; Nguyen, L.; Chan, J.; Innes, B.A.; Bulmer, J.N.; Kilby, M.D.; Hewison, M. Effects of 25-hydroxyvitamin D3 and 1,25-dihydroxyvitamin D3 on cytokine production by human decidual cells. Biol. Reprod. 2006, 75, 816-822.
37. Zhu, Y.; Mahon, B.D.; Froicu, M.; Cantorna, M.T. Calcium and 1 alpha,25-dihydroxyvitamin D3 target the TNF-alpha pathway to suppress experimental inflammatory bowel disease. Eur. J. Immunol. 2005, 35, 217-224
38. Bendixen A.C.; Shevde N.K.; Dienger K.M.; Willson T.M.; Funk C.D.; Pike J.W. IL-4 inhibits osteoclast formation through a direct action on osteoclast precursors via peroxisome proliferator- activated receptor gamma 1. Proc. Natl. Acad. Sci. USA 2001,
98, 2443-2448.
39. Binkley N (2012) Vitamin D and osteoporosis-related fracture. Arch BiochemBiophys 523:115–122
40. S.-G.Lee& Y.-h.Lee&K.J.Kim&W.Lee&O.H.Kwon& J.-H. Kim Additive association of vitamin D insufficiency and sarcopenia with low femoral bone mineral density in noninstitutionalized elderly population: the Korea National Health and Nutrition Examination Surveys 2009–2010Osteoporos Int DOI 10.1007/s00198-013-2378-6
ACKNOWLEDGEMENTS
First of all, I would like to say thank you to my supervisor Professor BomTaeck Kim (MD. Phd) for supporting me with all his efforts for this study and taking care throughout my stay at AjouUniversity and my two other supervisors Professor Bak and Professor Ann. Next, I would like to pay my gratitude to Professor Nam SeokJoo, for giving me advice on statistical analysis and Dr.YoungSang Kim for providing me with KHNANES data and sources. Then, I would like to thank Professor Eu Young Soh (M.D, Phd) for giving me such a great opportunity to attend this university, the director and the former director of Family Medicine department, Professor Kang Min Kim (MD. Phd.) and Professor Duck Joo Lee (MD. Phd.) for the warmth given to me during my practice in Family Medicine department. I am also grateful to meet Miss Woo from Academic office who helps me with all the administration works. The last but not least, I would like to pay gratitude to my family, my fiancé, and my friends for giving me emotional support during hard times.