베트남
-한국 우호 정보기술대학 이러닝 수용성 분석
Analysis of E-learning Acceptance in Vietnam-Korea
Friendship Information Technology College
반헝장*, 고진석**, 임재열***
Hung Trong Van*, JinSeok Ko**, JaeYeol Rheem***
요 약 베트남-한국 우호 정보기술대학의 이러닝(E-Learning) 교육 품질 향상을 위하여, 잘 알려진 기술수용모델 (TAM)에 기반한 이러닝 수용성 평가를 수행하였다. 총 158명의 강사 및 직원으로부터 설문지를 통하여 데이터 를 확보했으며, 통계패키지 SPSS를 이용하여 분석하였다. 설문지 작성 시는 다양한 이전 연구 결과를 고려하였 으며, 그에 따라 연구 가설 및 모델을 설정하였다. 그 결과, 이러닝 시스템의 성공모델을 세웠으며, 중요 요소를 파악했다. 아울러 강사 및 직원들이 이러닝 시스 템의 혜택을 잘 알고 있으며 그들의 훈련 및 교육에 이러닝 방법을 적용하고자 준비가 되었음을 파악했다. ABSTRACTTo improve the e-learning education quality in VietHanIT College (Vietnam-Korea Friendship Information Technology College), e-learning acceptance was evaluated based on the well-known Technology Acceptance Model (TAM). Quantitative data of the questionnaire survey were gathered from 158 lecturers and staffs of VietHanIT College and analyzed by using Statistical Package for the Social Sciences (SPSS). While designing the questionnaire various previous studies were considered and hypotheses and models of the study were set up accordingly.
As the results, success model of e-learning system was built up and important factors were identified. And most of lectures and staffs in VietHanIT College were aware of the benefits of e-learning system and they were ready to apply e-learning method for their training and teaching.
Key Words: E-learning, TAM, Perceived usefulness, Perceive ease of use, Behavioral intention use
*Vietnam-Korea Friendship Information Technology College, Dept. of Computer Engr. ([email protected]) ** Korea University of Technology and Education, School of EEC ([email protected])
*** Korea University of Technology and Education, School of EEC ([email protected]) 접수일자:2013년 5월 31일
수정일자:2013년 6월 11일 확정일자:2013년 6월 19일
Ⅰ. Introduction
E-learning is commonly referred to the intentional use of networked information and communications technology in teaching and learning. A number of other terms are also used
to describe this mode of teaching and learning. They include online learning, virtual learning, distributed learning, network and web-based learning. Fundamentally, they all refer to educational processes that utilize information and communications technology to mediate
asynchronous as well as synchronous learning and teaching activities.
We can define e-learning is an instruction delivered on a computer by way use of video tape, movies, CD-ROM, internet, or intranet with the following features: It includes content relevant to the learning objectives. It uses instructional methods to support learning. It uses media items such as words, sentences and pictures to deliver the content and teaching methods. It can be designed for self-study, established new knowledge and skills linked to individual learning goals and to improve organizational performance. E-learning has some systems:
Technology-Based Training (TBT) Computer-Based Training (CBT) Web-Based Training (WBT) Online Learning/Training Distance Learning
This paper researches how to improve the education quality by e-learning system in VietHanIT College in Da Nang, Vietnam. The main purpose is to determine the impact of technology solutions on e-learning performance with four objectives as following: (1) What are the accessibility and usability issues in e-learning system? (2) How can access and usability issues be practically resolved? (3) What are the advantages of e-learning for users? (4) How can users understand the difficulty level of using e-learning?
The organization of this paper is as follows. In section 2, methodology, factors influence e-learning acceptance, research model and research hypothesis we used in this paper are presented. Session 3 presents data analysis we did and their results. In session 4, we draw the paper’s conclusions.
Ⅱ. Methodology
This section shows the research framework pointed out the factors influencing to user’s satisfaction. Followings are the key assumptions
and variables measured to demonstrate and evaluate the important influences on how to user’s satisfaction using e-learning. Sampling, data collection and research methods including research model and hypothesis are discussed.
1. Technology Acceptance Model (TAM) The Technology Acceptance Model (TAM) was developed by Davis based on Theory of Reasoned Action model of Fishbein and Ajzen [1] with additional two factors includes perceived ease of use and perceived usefulness. TAM is designed to examine user’s acceptance a particular technology [2]. The original TAM model includes five factors: perceived ease of use, perceived usefulness, behavior intention, attitude, and actual use as in Fig. 1. Perceived Ease of Use Perceived Usefulnes s External Variables Attitude Toward Using Behavioral Intention to Use Actual System Use
Fig. 1 Technology acceptance model
2. Factors Influence E-learning Acceptance in the College
2.1 External Variables
External variables are as follows: instructor characteristics[3], technology characteristics[4], e-learning contents of e-learning[5], and learner e-learning sell-efficacy[6]-[8].
2.2 Internal Variables
Internal variables are as follows: perceived ease of use[2], perceived usefulness[2], attitude toward using e-learning[9], and behavioral intention to use e-learning[2].
3. Research Model
Based on the TAM model and factors influencing e-learning Acceptance in the college, we have the research model as in Fig. 2.
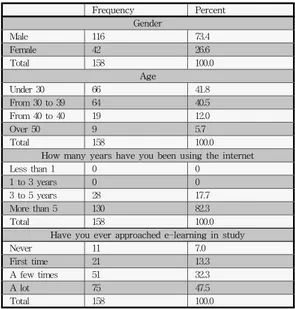
Frequency Percent Gender Male 116 73.4 Female 42 26.6 Total 158 100.0 Age Under 30 66 41.8 From 30 to 39 64 40.5 From 40 to 40 19 12.0 Over 50 9 5.7 Total 158 100.0
How many years have you been using the internet
Less than 1 0 0
1 to 3 years 0 0
3 to 5 years 28 17.7
More than 5 130 82.3
Total 158 100.0
Have you ever approached e-learning in study
Never 11 7.0
First time 21 13.3
A few times 51 32.3
A lot 75 47.5
Total 158 100.0
we have 8 Factors and 37 items as follows: Factor Teaching Material (5 items)
Factor Internet connect quality (5 items) Factor Leaner e-learning self-Efficacy (5 items) Factor e-learning content (8 items)
Factor Perceived ease of use (4 items) Factor Perceived usefulness (4 items)
Factor Attitude toward Using e-learning (3 items) Factor Intention to use e-learning (3 items)
Teaching material Internet connect quality Leaner e-learning self-Efficacy e-learning contents Perceived Ease of use Perceived usefulness Attitude Toward using e-learning Intention to use e-learning
Fig. 2. Research model 4. Research Hypothesis
Based on the research questions, factors influence e-learning acceptance, research model, we set the hypotheses for the research in table 1.
Table 1. Hypotheses Research hypotheses
Hypothesis 1: Teaching material will have a positive effect to perceived usefulness of e-learning.
Hypothesis 2: Internet connect quality will have a positive effect to perceived usefulness of use of e-learning.
Hypothesis 3: The Learner e-learning self-Efficacy will have a positive effect to Perceived Usefulness of e-learning.
Hypothesis 4: Perceived ease of use will have a positive effect to Perceived Usefulness of e-learning.
Hypothesis 5: Teaching material will have a positive effect to Perceived Ease of use of e-learning.
Hypothesis 6: Internet Connect Quality will have a positive effect to Perceived Ease of use of e-learning.
Hypothesis 7: The Learner e-learning self-Efficacy will have positive affect to Perceived Ease of use of e-learning.
Hypothesis 8: e-learning contents will have a positive effect to Perceived Ease of use of e-learning.
Hypothesis 9: Perceived Usefulness will have a positive effect to Attitude toward Using e-learning of e-learning.
Hypothesis 10: Perceived Ease of Use will have a positive effect to Attitude toward Using e-learning of e-learning.
Hypothesis 11: Attitude toward Use will have a positive effect to Intention to use e-learning.
5. Reliability Analysis
Before analyzing the relationship between factors,
it is important to ensure the reliability of the factors. Reliability of a factor can be determined based on the value of AVE or Cronbach's α values. In this paper the Cronbach's α value is used to measure reliability of factors including the behavior intention, attitudes, and perceived usefulness, perceived ease of use, systems quality, system complexity, and subjective norm. Factors of its Cronbach's α value greater than 0.7 should be accepted and those of Cronbach's α values less than 0.5 should be removed as in table 2.
Table 2. Reliability Test
Factors Items Cronbach’s α
Teaching Material 5 .8356
Internet connect quality 5 .8602
Leaner e-learning self-Efficacy 5 .9114
e-learning content 8 .9322
Perceived ease of use 4 .9110
Perceived Usefulness 4 .8235
Attitude toward Using
e-learning 3 .9257
Intention to use e-learning 3 .7886
III. Data Analysis and Results
1. Descriptive Analysis
The survey information includes: gender, age, and experience in using internet, e-learning experience.
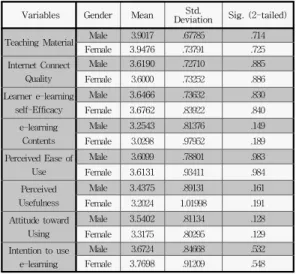
Variables Gender Mean DeviationStd. Sig. (2-tailed)
Teaching Material Male 3.9017 .67785 .714
Female 3.9476 .73791 .725 Internet Connect Quality Male 3.6190 .72710 .885 Female 3.6000 .73252 .886 Learner e-learning self-Efficacy Male 3.6466 .73632 .830 Female 3.6762 .83922 .840 e-learning Contents Male 3.2543 .81376 .149 Female 3.0298 .97952 .189 Perceived Ease of Use Male 3.6099 .78801 .983 Female 3.6131 .93411 .984 Perceived Usefulness Male 3.4375 .89131 .161 Female 3.2024 1.01998 .191 Attitude toward Using Male 3.5402 .81134 .128 Female 3.3175 .80295 .129 Intention to use e-learning Male 3.6724 .84668 .532 Female 3.7698 .91209 .548
Correlation Teaching Material Internet Connect Quality Learner e-learning self-Efficacy Perceived Ease of Use Perceived Usefulness Teaching Material Pearson Correlation 1.000 Sig. (2-tailed) . Internet Connect Quality Pearson Correlation .452(**) 1.000 Sig. (2-tailed) .000 . Learner e-learning self-Effica cy Pearson Correlation .624(**) .486(**) 1.000 Sig. (2-tailed) .000 .000 . Perceived Ease of Use Pearson Correlation .576(**) .547(**) .665(**) 1.000 Sig. (2-tailed) .000 .000 .000 . Perceived Usefulness Pearson Correlation .226(**) .395(**) .276(**) .410(**) 1.000 Sig. (2-tailed) .004 .000 .000 .000 . Model Unstandardized
Coefficients Standardized Coefficients
t Sig.
Colinearity Statistics
B ErrorStd. Beta Tolerance VIF
(Constant) 1.303 .427 3.049 .003 Teaching Material -.080 .129 .-060 -.620 .536 .554 1.805 Internet Connect Quality .333 .113 .260 2.951 .004 ,661 1.513 Learner e-learning self-Efficacy -.032 .128 -.026 -.250 .803 .463 2.158 Perceived Ease of Use .360 .118 .320 3.055 .003 .469 2.134 2. T -test
T-test is used to analyze whether different segment of the samples will have different reaction on the variable. We used T-test to investigate the effect of gender on teaching materials, internet connect quality, learner e-learning self-efficacy, e-learning contents, perceived ease of use, perceived usefulness, attitude toward using e-learning, and intention to use e-learning.
Table 4. T-test results.
Teaching materials: Female staffs are more efficiently than male staffs. Internet connect quality: Male staffs are more satisfied than female
staffs.
Learner e-learning self-efficacy: Female staffs are more satisfied than male staffs.
E-learning contents: Male staffs are more satisfied than female staffs. Perceived ease of use: Female staffs are more satisfied than male staffs. Perceived usefulness: Male staffs are more satisfied than female staffs. Attitude toward using e-learning: Male staffs are more satisfied than
female staffs.
Intention to use e-learning: Female staffs are more satisfied than male staffs.
3. Correlation and Linear Regression Analysis
Correlation Analysis: Correlation is a leverage analysis that measures the strengths of association between two variables. As the value goes towards 0, the relationship between the two variables will be weaker. Usually, in statistics, we measure three types of correlation: Pearson correlation, Kendall rank correlation and Spearman correlation.
Linear Regression Analysis: Hypotheses in
this paper will be tested and analyzed by regression analysis to determine relationships between independent and dependent variables. The test is based on the R-square and adjusted R-square values to determine explanation for each factor, and p-value also is used to determine the significant level for each factor.
3.1 Correlation Analysis of Perceived Usefulness
Correlation between perceived usefulness and other factors is in table 5.
Table 5. Correlation between perceived usefulness and other factors.
** Correlation is significant at the 0.01 level (2-tailed). N = 158.
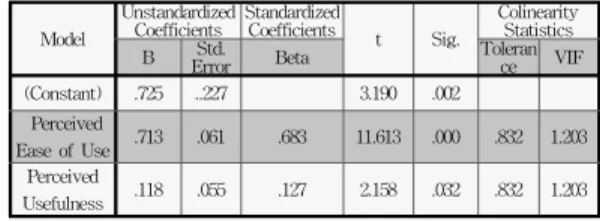
3.2 Regression Analysis of Perceived Usefulness
Table 6. The statistical parameters of perceived usefulness.
Correlation Perceived Ease of Use Perceived Usefulness Attitude toward Using e-learning Perceived Ease of Use Pearson Correlation 1.000 Sig. (2-tailed) . Perceived Usefulness Pearson Correlation .410(**) 1.000 .407(**) Sig. (2-tailed) .000 . .000 Attitude toward Using e-learning Pearson Correlation .735(**) .407(**) 1.000 Sig. (2-tailed) .000 .000 . Model Unstandardized
Coefficients Standardized Coefficients t Sig. Colinearity Statistics
B ErrorStd. Beta Tolerance VIF
(Constant) .725 ..227 3.190 .002
Perceived
Ease of Use .713 .061 .683 11.613 .000 .832 1.203 Perceived
Usefulness .118 .055 .127 2.158 .032 .832 1.203
The correlation coefficients between factors are greater than 0.2. It shows that independent factors can be used to explain for perceived usefulness, with P-values < 0.004.
In the tables 5 and 6, the factors teaching material and learner e-learning self-efficacy are rejected with P-value greater than 0.05. The factors internet connect quality and perceived ease of use are supported with P-value < 0.05.
The variance inflation factor (VIF) < 3. It means that the collinear phenomenon will not happen.
3.3 Correlation Analysis of Perceived Ease of Use
Table 7. Correlation between perceived ease of use and other factors.
Correlation Teaching Material Connect Internet Quality Learner e-learning self-Efficacy e-learnin g Content Perceived Ease of Use Teaching Material Pearson Correlation 1.000 Sig. (2-tailed) . Internet Connect Quality Pearson Correlation .452(**) 1.000 Sig. (2-tailed) .000 . Learner e-learning self-Effica cy Pearson Correlation .624(**) .486(**) 1.000 Sig. (2-tailed) .000 .000 . e-learning Content Pearson Correlation .368(**) .397(**) .468(**) 1.000 Sig. (2-tailed) .000 .000 .000 . Perceived Ease of Use Pearson Correlation .576(**) .547(**) .665(**) .598(**) 1.000 Sig. (2-tailed) .004 .000 .000 .000 .
** Correlation is significant at the 0.01 level (2-tailed). N = 158.
3.4 Regression Analysis of Perceived Ease of Use
Table 8. The statistical parameters of perceived ease of use.
Model
Unstandardized
Coefficients Standardized Coefficients t Sig. Colinearity Statistics
B ErrorStd. Beta Tolerance VIF
(Constant) -.204 .272 -.748 .456 Teaching Material .214 .080 .179 2.678 .008 .580 1.725 Internet Connect Quality .216 .069 .190 3.108 .002 ,698 1.433 Learner e-learning self-Efficacy .342 .077 .316 4.459 .800 .518 1.930 e-learning Content .296 .057 .309 5.215 .000 .740 1.351
a Dependent Variable: Perceived Ease of Use.
The correlation coefficients between factors are greater than 0.3. It shows that independent factors
can be used to explain for perceived ease of use, with P-values = 0.004.
In the tables 7 and 8, the factors teaching material, internet connect quality, learner e-learning self-efficacy and e-learning content are supported with P-value < 0.05.
The variance inflation factor (VIF) < 3. It means that the collinear phenomenon will not happen.
3.5 Correlation Analysis of Attitude toward Using E-learning
Table 9. Correlation between attitude toward using e-learning and other factors
** Correlation is significant at the 0.01 level (2-tailed). N = 158.
3.6 Regression Analysis of Attitude toward Using E-learning
The correlation coefficients between factors are greater than 0.4. It shows that independent factors can be used to explain for attitude toward using e-learning, with P-values = 0.000.
In the tables 9 and 10, the factors perceived ease of use, perceived usefulness are supported with P-value less than 0.05.
The variance inflation factor (VIF) < 3. It means that the collinear phenomenon will not happen.
Table 10. The statistical parameters of attitude toward using e-learning.
3.7 Correlation Analysis of Intention to Use E-learning
Table 11. Correlation between Intention to use e-learning and attitude toward using e-learning factor.
Correlation toward Using Attitude e-learning Intention to use e-learning Attitude toward Using e-learning Pearson Correlation 1.000 Sig. (2-tailed) . Intention to use e-learning Pearson Correlation .603(**) 1.000 Sig. (2-tailed) .000 .
** Correlation is significant at the 0.01 level (2-tailed). N = 158.
3.8 Regression Analysis of Intention to Use E-learning
Table 12. The statistical parameters of intention to use e-learning.
Model
Unstandardized
Coefficients Standardized Coefficients t Sig. Colinearity Statistics
B ErrorStd. Beta Tolerance VIF
(Constant) 1.380 .228 6.042 .000
Attitude toward
Using e-learning .568 .060 .603 9.443 .000 1.000 1.000 a Dependent Variable: Intention to use e-learning.
The correlation coefficients between factors are greater than 0.6. It shows that independent factors can be used to explain for intention to use e-learning, with P-values = 0.000.
In the tables 11 and 12, the factor attitude toward using e-learning is supported with P-value less than 0.05.
The variance inflation factor (VIF) < 3. It means that the collinear phenomenon will not happen.
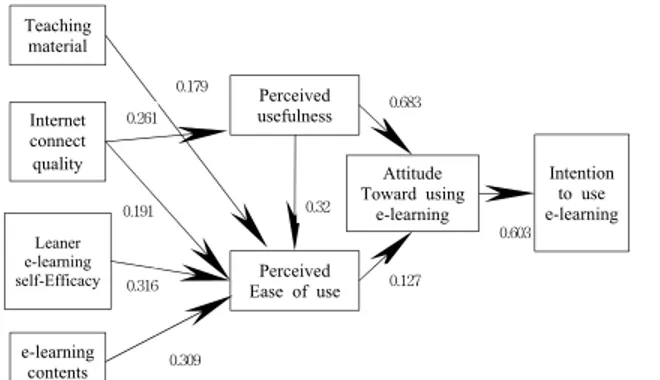
Teaching material Internet connect quality Leaner e-learning self-Efficacy e-learning contents Perceived Ease of use Perceived usefulness Attitude Toward using e-learning Intention to use e-learning 0.179 0.261 0.191 0.316 0.309 0.32 0.683 0.603 0.127
Fig. 3. Success research model. 4. Path Analysis
After analyzing relationship between factors, the resulting relationship is in Fig. 3. Compared with research model in Fig. 2 and hypotheses in table 1, two paths are omitted in the success research model with weak relationships (Hypothesis 1 and 3).
Ⅳ. Conclusion
In this paper, success model of e-learning system is evaluated for VietHanIT College and important factors are identified, which have positive affect to success of research model. Data collection and analysis work are performed on real participants at VietHanIT College. They are education managers, lecturers, and staffs who take part in e-learning process.
The research results indicate that most of the staffs and lecturers of VietHanIT College have been aware of the benefits of e-learning system for VietHanIT College. These staffs and lecturers showed that they are ready to approach e-learning method for their training and teaching. Moreover, the result shows that factors in research model are relevant and positive impact significantly on the implementation of e-learning systems in VietHanIT College in accordance with the conditions and circumstances existing to improve the quality of higher education by applying e-learning system in Vietnam universities.
Reference
[1] M. Fishbein and I. Ajzen, Belief, attitude,
intention and behavior: An introduction to theory and research, addison-wesley, 1975.
[2] F. D. Davis, “Perceived usefulness, perceived ease of use, and user acceptance of information technology”. MIS Quarterly, 13(3), 319-340, 1989.
[3] N. Wagner, K. Hassanein and M. Head, “Who is responsible for e-learning Success in Higher Education? A Stakeholders' Analysis,”
26-36, 2008.
[4] W. Horton, “Leading e-learning”, American
Society for Training and Development, 2001.
[5] Wikipedia: e-learning
(http://en.wikipedia.org/wiki/e-learning)2012/09/ 08.
[6] M. Bolt, L. Killough, and H, Koh, “Testing the interaction effects of task complexity in computer training using the social cognitive model”, Decision Sciences, 32(1), 1-20, 2001. [7] M. Brosnan, “The impact of computer anxiety
and self-efficacy upon performance”, Journal of
Computer Assisted Learning, 14, 223-234,
1998.
[8] M. Gist and T. Mitchell, “Self-efficacy: a theoretical analysis of its determinants and malleability”, Academy of Management Review, 17(2), 183-211, 1992.
[9] Ndubisi, “Measuring the tendency to act in a positive or negative way toward using e-learning system”, 2004.
반 헝 장 (Hung Trong Van)
2009.07: Bachelor, Da Nang Technology Unversity, Da Nang, Vietnam.
2013.02: Master in HRD, Korea Univ. of Technology and Education
2009.09 ~ 2011.07 and 2013.03 ~ Present: Lecturer, Vietnam-Korea Friendship Information Technology College, Vietnam
<Interest Field> HRD, Network Computing
고 진 석 (JinSeok Ko)
2004.02: Master, School of IT Engineering, Korea Univ. of Technology and Education, Korea
2006.03~2009.06: Head Researcher, ATI Inc.
2009.09 ~ Present: Ph.D. student, Dept. of Electrical, Electronics and Communication Engineering, Korea Univ. of Technology and Education
<Interest Field> Machine Vision, Pattern Recognition, Signal Processing
임 재 열 (JaeYeol Rheem) Lifetime member 1986.02: Bachelor
1988.02: Master
1995.02: Ph.D., all in Dept of Electronics, Seoul National Univ.
1995.09 ~ Present: Professor, Dept. of Electrical, Electronics, and Communication Engineering, <Interest Field> Digital Signal Processing, Speech Signal Processing, ANC, HRD