MODEL TESTS ON LEVEES REINFORCED WITH SHEET PILES
UNDER HIGH WATER CONDITIONS WITH/WITHOUT SEISMIC LOADING HISTORY
JUNICHI KOSEKIi)
,
HIROYUKI TANAKAii),
KAZUTAKA OTSUSHIii),
NAOYA NAGAOii)andMASARU KANEKOii)ABSTRACT
In order to study the performance of levees reinforced with steel sheet piles under high water condition, a series of model tests was conducted by simulating the high water condition before and after applying severe seismic loading history. As a result, the seepage behavior through the subsoil layers underlying the levee was not significantly affected by the seismic loading history. It was also verified that, irrespective of the seismic loading history, the sheet piles installed at the levee crest or shoulder are effective in preventing the breakage of levees caused by overflow. In addition, applicability of drainage works at the foot of the levee in preventing the seepage failure was confirmed.
Key Words : Model test, Levee, Sheet pile, High water, Earthquake, Liquefaction
1 INTRODUCTION
Many countries in eastern Asia suffer from rainfall-induced geohazards, such as failure of embankments and natural slopes. In case of levees, their performance under high water condition would be the major concern during and after intensive rainfalls.
In addition, since some of the eastern Asia countries are also prone to earthquake events, due attention shall be paid on seismic loading history that affect the above performance under high water condition.
In view of the above, focusing on the performance of levees reinforced with steel sheet piles, a series of model tests was conducted in the present study by simulating the high water condition before and after applying severe seismic loading history.
2 TEST PROCEDURES
2.1 Test cases
Three cases of levee models as shown in Fig. 1 were constructed in a rigid soil container with a dimension of 280.0*69.5 cm in plan view and a depth of 84.5 cm.
In case 1, a pair of steel sheet piles was installed at the foot of the embankment. This type of reinforcement has been widely adapted in Japan as a countermeasure against earthquake-induced liquefaction of subsoil layers (e.g., JGS, 1998; Okamura and Matsuo, 2002).
In case 2, on the other hand, a single sheet pile was installed along the center line of the embankment crest.
In case 3, a pair of sheet piles was installed at the shoulder of the embankment, while connecting their top parts with a tie-rod. Their thickness was reduced from the ones employed for cases 1 and 2, considering the effects of the tie-rod in resisting against the external loads to be applied. Note that good seismic performance of this type of reinforcement has already been reported by Kaneko and Koseki (2009).
2.2 Preparation of subsoil layers and embankment
In order to model non-liquefiable layer to which the sheet piles were embedded, the lower subsoil layer was prepared by compacting Kashima silica #7 sand with a mean diameter of 0.13 mm into a final thickness of about 25 cm. It was overlain by the upper subsoil layer with a thickness of 25 cm, which was prepared by pluviating Kashima #5 sand particles with a mean diameter of 0.34 mm at a relative density of about 30 %. This upper layer liquefied when a large amplitude horizontal excitation was applied.
The embankment had a height of 25 cm. It was made of a mixture of Kashima #5 sand and kaolin clay at a dry mass ratio of 5:1 and a water content of 15 %.
The above soil materials were selected so that the upper subsoil layer and the embankment exhibit the highest and lowest permeability, respectively, while not considering any similitude to be applied to small scale models under normal gravity field. Rather, by using proper numerical methods that can simulate the experimental observations described herein, prediction of prototype performance shall be made in the future. I) Professor, Institute of Industrial Science, University of Tokyo, 4-6-1, Komaba, Meguro-ku, Tokyo, 153-8505, Japan.
ii) Construction Technology Department, SUMITOMO METAL INDUSTRIES, LTD., Japan.
845 250 250 250 150 10 0 12 5 125 75 75 50 50 70 80 800 450 300 450 800 400 350 50 50 200 200 150 150 200 200 50 50 750 Upper subsoil Lower subsoil Sheet pile, t=2.3mm #7 Silica sand + Kaolin clay #5 Silica sand #7 Silica sand 1:1.8 Embankment
(Base acc. of shaking table) Case 1 Unit in mm :Disp. :Pore press. :Acceleration :Strain Transducers :Disp. :Pore press. :Acceleration :Strain Transducers
Downstream side Upstream side
84 5 25 0 250 250 150 100 12 5 125 75 75 50 50 70 80 800 450 300 450 800 400 400 225 225 150 150 225 225 200 600 Upper subsoil Lower subsoil t=2.3mm 。。。。。。。。。 。。。。。。。。。
Gravelly soil Case 2
84 5 25 0 250 2 50 150 800 450 300 450 800 400 400 225 175 50150 150 50175 225 200 600 10 0 125 12 5 75 75 50 50 70 80 Upper subsoil Lower subsoil t=1.6mm 。。。。。。。。。 。。。。。。。。。 Tie-rod
Gravelly soil Case 3
Figure 1. Cross-section of test models
2.3 Modeling of sheet piles
A steel plate with a thickness of 1.6 or 2.3 mm was employed as the sheet pile model. It was embedded to the lower subsoil layer by 15 cm. These thickness and embedment depth were determined based on simplified computations that simulate the behavior during the horizontal excitation with an assumption that the upper subsoil layer undergoes full liquefaction.
In order to reduce the effects of friction at the side boundaries, the sheet pile model was divided into three pieces, and measurement of bending strain with strain gauges was made at the center piece. In addition, in order to maintain the water tightness, all the vertical interfaces among the pieces of the sheet pile model and those with the side wall of the soil container was sealed with a plastic sheet that had an initial wrinkle to allow for differential movements.
2.4 Application of external loads
External loads were applied in the following four steps.
Step 1: High water condition without the seismic loading history was simulated by raising the water level on one side of the embankment (herein referred to as “upstream” side), while keeping the water level on the other side (i.e., “downstream” side) at the subsoil surface. The water level on the upstream side was
raised up to 20 cm above the subsoil surface at a rate of about 1 cm/min with several intermissions to measure the distributions of pore water pressure and the corresponding steady state flow rate of ground water.
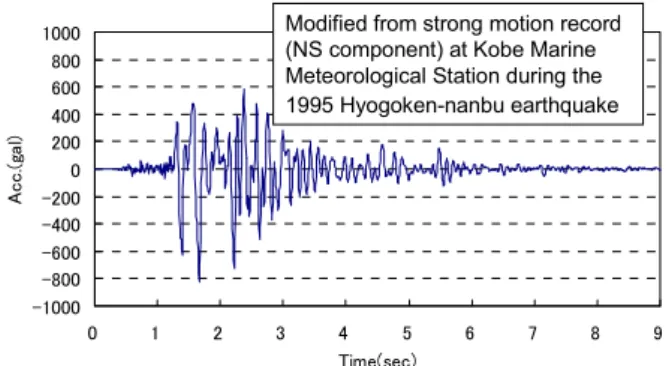
Step 2: After restoring the water level on the upstream side at the subsoil surface, a horizontal excitation by using an input wave as shown in Fig. 2 was applied to simulate severe seismic loading history. This input wave was prepared based on the strong motion record (NS component) observed at Kobe Marine Meteorological Station during the 1995 Hyogoken-nanbu earthquake, where the time scale was modified so that the predominant frequency became 5 Hz, considering the limited size of the model as compared to the prototype one.
Step 3: While keeping the model conditions that were altered by the seismic loading history in step 2, the water level on the upstream side was again raised up to 20 cm (or lower in case the embankment suffered extensive settlement) above the subsoil surface.
Step 4: Following the above step 3, the water level on the upstream side was further raised until overflow was initiated. Then, it was attempted to maintain the water level by providing additional water for the upstream side to the maximum capacity of the available water supply (about 20 liter per min.).
調整後波形(卓越周波数5Hz) -1000 -800 -600 -400 -200 0 200 400 600 800 1000 0 1 2 3 4 5 6 7 8 9 Time(sec) Ac c. (g a l) 入力波形 Modified from strong motion record (NS component) at Kobe Marine Meteorological Station during the 1995 Hyogoken-nanbu earthquake
Figure 2. Input wave motion for horizontal excitation in step 2
3 TEST RESULTS AND DISCUSSIONS
The test results are described for each of the test cases, accompanied by discussions on the effect of seismic loading history and applicability of the levee reinforcement method with steel sheet piles.
3.1 Case 1
In step 1, local seepage failure was triggered at the foot of the embankment on the downstream side, when the water level on the upstream side was raised by 6 cm above the subsoil surface. As shown in Fig. 3, the failure progressed to the middle height of the embankment when the water level was further raised to 20 cm and kept for 20 min.
Downstream side
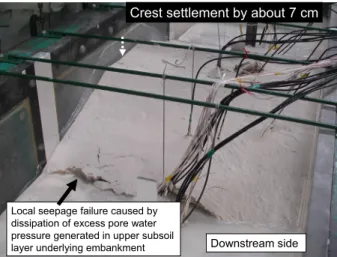
Figure 3. Embankment failure in step 1, case 1 After lowering the water level on the upstream side, the collapsed part of the embankment was restored to the initial condition. Then the horizontal excitation was conducted in step 2. As shown in Fig. 4, the crest of the embankment subsided by about 7 cm, accompanied by re-occurrence of local seepage failure at its foot that was caused by dissipation of excess pore water pressure generated in the upper subsoil layer. The sheet piles installed at the foot of the embankment suffered large residual tilting (refer to Fig. 5 for their location).
Crest settlement by about 7 cm
Downstream side
Local seepage failure caused by dissipation of excess pore water pressure generated in upper subsoil layer underlying embankment
Figure 4. Embankment settlement in step 2, case 1 In step 3, the water level on the upstream side was raised up to 15 cm above the subsoil surface, while observing the seepage behavior by using colored water. As shown in Fig. 5, the water permeated predominantly through the top part of the upper subsoil layer (i.e., immediately below the embankment) and flowed out from the foot of the embankment on the downstream side.
Subsequently, the water level on the upstream side was further raised to trigger the overflow in step 4. Due to the erosion by the overflowing water, a part of the embankment was completely broken as shown in Fig. 6. It took 162 seconds for such breakage to take place
after the triggering of overflow, during which 134 liters of water flowed out in total.
With this case, since the water seepage through the upper subsoil layer was blocked by the sheet piles, the hydraulic gradient became very high at the foot of the embankment on the downstream side, resulting into the local failure as observed in step 1. In order to avoid such local failure, in cases 2 and 3, the foot of the embankment on the downstream side was replaced with drainage works using a gravelly material that exhibits much higher permeability than the embankment material (sand and clay mixture as described in 2.2).
15 cm
Location of sheet piles after excitation
Downstream side Upstream side
Figure 5. Seepage of colored water in step 3, case 1
Erosion
Figure 6. Breakage of eroded embankment in step 4, case 1 It should be noted that another case of model test was conducted under otherwise the same conditions as in case 1 except for the replacement with the gravelly material. As a result, no local failure at the foot of the embankment in step 1 was observed. This confirms the effectiveness of enhancing the drainage capacity at the foot of the embankment.
Note also that, in step 3 of case 1, such local failure was not observed, either. This is possibly affected by the deformation of the sheet piles that was caused by the seismic loading in step 2 (Fig. 4). Since opening had been created in step 3 between the foot of the embankment and the sheet pile on the downstream side, the hydraulic gradient in this step may have been much lower than the one in step 1.
3.2 Case 2
In step 1, as shown in Fig. 7, the water permeated predominantly by passing around the tip of the embedded sheet pile. The photo shown in this figure was taken in about 300 min. after raising the water level on the upstream side to 20 cm above the subsoil surface. The amount of water that flowed out at this state was 0.68 liter per min., which was about half of the corresponding value (about 1.5 liter/min.) in case 1. Such change in the water flow rates was affected by the longer seepage distance in case 2 and the reduced permeability of the lower subsoil layer as compared to that of the upper one.
Sheet pile 20 cm Upper subsoil Lower subsoil Gravelly soil Upstream side Downstream side
Figure 7. Seepage of colored water in step 1, case 2
By the excitation in step 2, the embankment subsided by about 7 cm (Fig. 8a). The sheet pile remained at its original position, since it was located along the symmetrical line. In addition, the embankment suffered lateral displacement as well, creating openings with a width of about 3 cm at its interface with the sheet pile (Fig. 8b). In these openings, sand particles that were boiled from the liquefied upper subsoil layer deposited to a height of about 6 cm.
Sheet pile
Sand boiling
Settlement by about 7 cm
* Observation was made through side wall opposite to the one used in Fig. 7.
Downstream side Upstream side
About 3 cm-wide openings on both sides
Sheet pile
Embankment crest
Top beam to stiffen soil container Figure 8. a) Deformed embankment and upper subsoil layer, and b) openings in between the embankment and
the sheet pile in step 2, case 2
In step 3, the water level on the upstream side was raised up to 20 cm above the subsoil surface, while observing the seepage behavior by using water that was colored differently from the one employed in step 1. As a result, change in the seepage behavior including the water flow rate (see Table 1 to be shown in 3.3) from the one observed in step 1 was not significant, suggesting that the seismic loading history did not affect the seepage behavior.
Subsequently, the water level on the upstream side was further raised up to 24 cm above the subsoil surface, while no local failure of the embankment or the subsoil layers was observed.
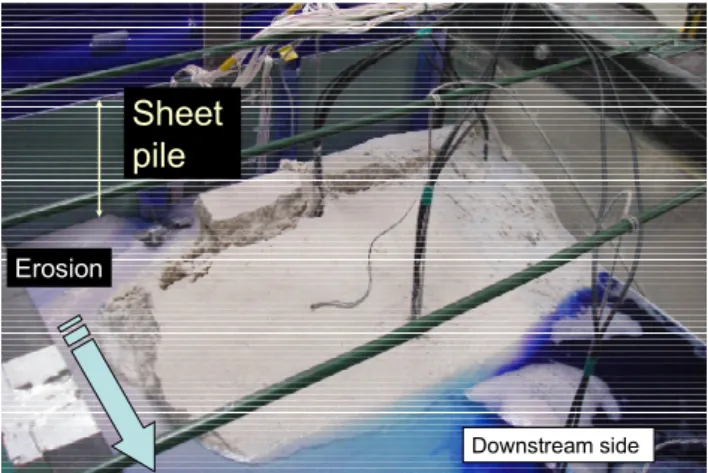
In step 4, the water overflowed the sheet pile. At first, it filled the opening on the downstream side, and flowed out while eroding the interface between the embankment and the side wall of the soil container. As shown in Fig. 9, a part of the embankment on the downstream side was completely eroded, while the sheet pile could retain the water on the upstream side up to its full height.
Sheet
pile
Downstream side
Erosion
Figure 9. Erosion of embankment on downstream side in step 4, case 2
It took 581 seconds for the above erosion on the downstream side to take place after the triggering of overflow, during which 210 liters of water flowed out in total. In terms of the average flow rate of water, it was much smaller in case 2 (=21.7 liter/min.) than in case 1 (=49.6 liter/min.), due to the following two reasons.
a) The amount of overflowing water was much smaller in case 2, because the sheet pile retained the water on the upstream side.
b) As mentioned previously, the amount of seepage water through the subsoil layers was also smaller in case 2, because the sheet pile blocked the seepage through the upper subsoil layer that had higher permeability than the lower one.
After step 4, it was attempted to induce instability of the sheet pile by removing the embankment on the downstream side and excavating the underlying subsoil layer gradually, while maintaining the water level on a)
the upstream side at 20 cm above the subsoil surface and lowering the water level on the downstream side down to the elevation of the interface between the upper and lower subsoil layers. As shown in Fig. 10, the sheet pile tilted largely when the excavation was made down to the depth of 20 cm below the original subsoil surface. At this state, the embedded depth of the sheet pile on the passive side was 20 cm, which had been 40 cm before the excavation. Therefore, it could be inferred that the sheet pile before the excavation should have been stable against high water condition with an ample safety margin.
Difference in water levels: about 40cm
Sheet pile
Downstream side
(excavated by 20 cm)
Figure 10. Tilting of sheet pile with excavation of subsoil layer on downstream side after step 4, case 2 It should be noted that, during and immediately after the excitation in step 2, the subgrade reaction on the passive side should have been reduced due to the generation of excess pore water pressure in the upper subsoil layer. On the other hand, after the dissipation of the excess pore water pressure, the subgrade reaction could be restored, as was confirmed with the above excavation test.
3.3 Case 3
In step 1, as shown in Fig. 11, the water predominantly permeated by passing around the tip of the embedded two sheet piles. The photo shown in this figure was taken in about 420 min. after raising the water level on the upstream side to 20 cm above the subsoil surface. The amount of water that flowed out at this state was 0.41 liter per min., which was even lower than the corresponding value (0.68 liter/min.) in case 2. Such change in the water flow rates was affected by the longer seepage distance through the less-permeable lower subsoil layer in case 3.
Sheet piles & tie-rod
20 cm
Upper subsoil Lower subsoil
Upstream side Downstream side
Figure 11. Seepage of colored water in step 1, case 3
By the excitation in step 2, the crest of the embankment, which was surrounded by the pair of sheet piles, subsided by about 5 cm (Fig. 12), while leaving the sheet piles almost at their original elevation. Such settlement was possibly caused by the following two mechanisms.
a) The upper subsoil layer that liquefied by the excitation suffered one-dimensional compression due to dissipation of excess pore water pressure.
b) The sheet piles suffered bulging-type deformation as indicated in Fig. 12 due to liquefaction-induced reduction of the subgrade reaction of the upper subsoil layer on the passive side.
Settlement by about 5 cm
* Observation was made through side wall opposite to the one used in Fig. 11.
Downstream side Upstream side
Sheet piles & tie-rod
Figure 12. Deformed embankment and upper subsoil layer in step 2, case 3
In addition, in step 2, openings were created on the outer side surfaces of the sheet piles. The width of the openings was about 3 and 1 cm, respectively, on the upstream and downstream sides.
The seepage behavior that was observed in step 3 with the seismic loading history did not significantly change from the one observed in step 1 without the seismic loading history. The flow rates of seepage water measured with cases 2 and 3 before and after the excitation are summarized in Table 1.
Table 1. Flow rates of seepage water under high water condition in steps 1 and 3
Water level on upstream side Step 1 (before excitation) Step 3 (after excitation) 10 (cm) 0.31 (liter/min.) 0.29 (liter/min.) Case 2 20 0.68 0.62 10 0.18 0.18 Case 3 20 0.41 0.38
* No comparison was made in case 1 due to local seepage failure in step 1 and excessive crest settlement in step 2.
In step 4, as shown in Fig. 13, erosion occurred at two interfaces between the embankment on the downstream side and the side walls of the soil container. Similarly to case 2, the sheet piles could retain the water on the upstream side. Thus, as summarized in Table 2, the average flow rate of water during overflow in step 4 of case 3 was much smaller than the corresponding value of case 1.
Sheet pile
Downstream side
Erosion
Figure 13. Embankment erosion on downstream side in step 4, case 3
Table 2. Flow rates of water during overflow in step 4
Duration of overflow Total volume of water* Average flow rate Case 1 162
(second) 134.0 (liter) 49.6 (liter/min.)
Case 2 581 210.0 21.7
Case 3 419 130.5 18.7
* Sum of water which overflowed above the embankment and permeated through the subsoil layers
After step 4, it was attempted to induce instability of the sheet pile by following the same procedures as were taken in case 2. As shown in Fig. 14, the sheet piles were stable even after excavating the whole part of the upper subsoil layer. When the lower subsoil layer was subsequently excavated by 10 cm, boiling of sand particles was observed around the sheet pile on the downstream side, causing extensive overturning of the pair of the sheet piles that was connected to each other with the tie-rod. Note that the embedment depth at this state was as small as 5 cm on the passive side.
Sheet piles & tie-rod Difference in water levels: about 50 cm
Upstream side Downstream side
(excavated by 30 cm)
Figure 14. Excavation of subsoil layer on downstream side after step 4, case 3
The following advantages of using sheet pile(s) driven from the crest or shoulder of embankments could be confirmed from the observations made in cases 2 and 3. Note again that, as mentioned in 3.2, recovery of the subgrade reaction in the upper subsoil layer that underwent dissipation of earthquake-induced excess pore water pressure was one of the key features for achieving these advantages.
a) Even with a single sheet pile, the water on the upstream side can be retained up to its full height. b) With a pair of sheet piles that are connected with each other with a tie-rod, the stability against high water condition can be further enhanced.
4 SUMMARY
Major findings from the present model tests on levees reinforced with sheet piles can be summarized as follows.
a) No significant effect of severe seismic loading history on the seepage properties of the subsoil layers underlying the levee under high water condition was observed.
b) Irrespective of the seismic loading history, the sheet piles installed at the levee crest or shoulder were effective in preventing breakage of levees caused by overflow under extremely high water condition.
c) Applicability of drainage works at the foot of the levee on the downstream side in preventing seepage failure was confirmed.
Quantitative analyses of the measured data, such as distributions of pore water pressure in the subsoil layers and bending strain of sheet piles, and their numerical simulation are currently conducted, which will be reported elsewhere.
REFERENCES
1) Japanese Geotechnical Society (1998): Remedial Measures against Soil Liquefaction –from investigation and design to implementation, Balkema, pp.403-415.
2) Kaneko, M. and Koseki, J. (2009): “Behavior of levee models reinforced with cutoff steel sheet-piles during earthquake”, Proc. of 8th International Symposium on New
Technologies for Urban Safety of Mega Cities in Asia,
Incheon, Korea, pp. 57-65.
3) Okamura, M. and Matsuo, O. (2002): “Effects of remedial measures for mitigating embankment settlement due to foundation liquefaction”, International Journal of Physical