저작자표시-비영리-동일조건변경허락 2.0 대한민국 이용자는 아래의 조건을 따르는 경우에 한하여 자유롭게 l 이 저작물을 복제, 배포, 전송, 전시, 공연 및 방송할 수 있습니다. l 이차적 저작물을 작성할 수 있습니다. 다음과 같은 조건을 따라야 합니다: l 귀하는, 이 저작물의 재이용이나 배포의 경우, 이 저작물에 적용된 이용허락조건 을 명확하게 나타내어야 합니다. l 저작권자로부터 별도의 허가를 받으면 이러한 조건들은 적용되지 않습니다. 저작권법에 따른 이용자의 권리는 위의 내용에 의하여 영향을 받지 않습니다. 이것은 이용허락규약(Legal Code)을 이해하기 쉽게 요약한 것입니다. Disclaimer 저작자표시. 귀하는 원저작자를 표시하여야 합니다. 비영리. 귀하는 이 저작물을 영리 목적으로 이용할 수 없습니다. 동일조건변경허락. 귀하가 이 저작물을 개작, 변형 또는 가공했을 경우 에는, 이 저작물과 동일한 이용허락조건하에서만 배포할 수 있습니다.
Significance of Osteoporosis in Facial Bone
Density using the Computed Tomography Scan
by
Jong Joo Lee
Major in Medicine
Department of Medical Sciences
The Graduate School, Ajou University
Significance of Osteoporosis in Facial Bone
Density using the Computed Tomography Scan
by
Jong Joo Lee
A Dissertation Submitted to The Graduate School of
Ajou University in Partial Fulfillment of the
Requirements for the Degree of Master of Medicine
Supervised by
Hyun Jun Kim, M.D., Ph.D.
Major in Medicine
Department of Medical Sciences
The Graduate School, Ajou University
This certifies that the dissertation
of Jong Joo Lee is approved.
SUPERVISORY COMMITTEE
Keehyun Park
Yun-Hoon Choung
Hyun Jun Kim
The Graduate School, Ajou University
December, 23rd, 2010
i
ACKNOWLEDGEMENTS
I am thankful to my supervisor, Professor Hyun-Jun Kim, whose encouragement, guidance, and support from the initial to the final level enabled me to develop the understanding of the subject. This study would not have been possible unless the encouragement and support from Professor Keehyun Park and Professor Yun-Hoon Choung. Special thanks go to Professor Jun-Ho Bae, without whose knowledge and guidance this study would not have been successful.
Lastly, I offer my regards and blessings to all of those who supported me in any respects during the completions of the study.
ii
- ABSTRACT -
Significance of Osteoporosis in Facial Bone Density using
the Computed Tomography Scan
The study was to compare the variations of bone density in the mid-facial bones as measured by quantitative CT scans between the osteoporosis and control groups, and to evaluate the regions that facial trauma and iatrogenic problem often occurs in the mid face. The 96 patients who underwent both OMU CT scans and Dual-Energy X-ray Absorptiometries at Ajou University Hospital were included in this study retrospectively. 7 skeletal regions were chosen for evaluation; Group A (Orbital floor, Nasal bone), Group B (Zygomaticomaxillary suture, Zygomatic arch, Zygomaticofrontal suture), Group C (Anterior wall of the maxillary antrum, Maxillary process). 47 patients were in the osteoporosis group, and 49 patients were in the control group. On a PACS, Pixel intensity was analyzed in the region of interest, and the Hounsfield units were measured. There was a significant difference in the mean bone density of the mid-facial bones between the osteoporosis group and the control group (p=0.000). For both groups, each of comparison of the 7 skeletal regions was greater as Group A<Group B<Group C in this order (p=0.000). We can see the independent affects of
iii
osteoporosis in the mid-facial bones using QCT scans.
Key words : Osteoporosis, quantitative computed tomography scan, osteotomy, bone density, rhinoplasty
iv
TABLE OF CONTENTS
ACKNOWLEDGEMENTS ··· i ABSTRACT ··· ii TABLE OF CONTENTS ··· iv LIST OF FIGURES ··· v LIST OF TABLES··· vi . Ⅰ INTRODUCTION ··· 1 . Ⅱ MATERIALS AND METHODS ··· 3A. PATIENTS··· 3 B. RADIOLOGICAL ANALYSIS ··· 3 C. DATA ANALYSIS ··· 5 . Ⅲ RESULTS··· 7 . Ⅳ DISCUSSION ··· 15 . Ⅴ CONCLUSION ··· 21 REFERENCES ··· 22 국문요약 ··· 25
v
Lists of Figures
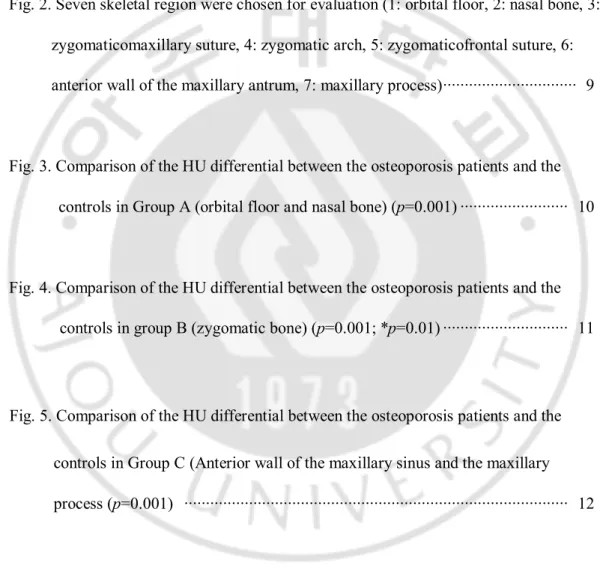
Fig. 1. The white round circle in the axial view indicates the region of interest (ROI). Pixel intensities were analyzed by dragging the mouse in the ROI, and the HUs were measured ··· 8
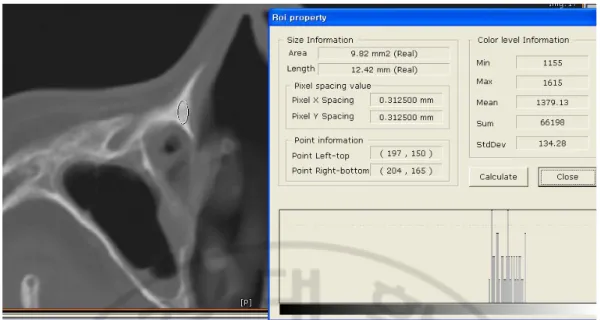
Fig. 2. Seven skeletal region were chosen for evaluation (1: orbital floor, 2: nasal bone, 3: zygomaticomaxillary suture, 4: zygomatic arch, 5: zygomaticofrontal suture, 6: anterior wall of the maxillary antrum, 7: maxillary process)··· 9
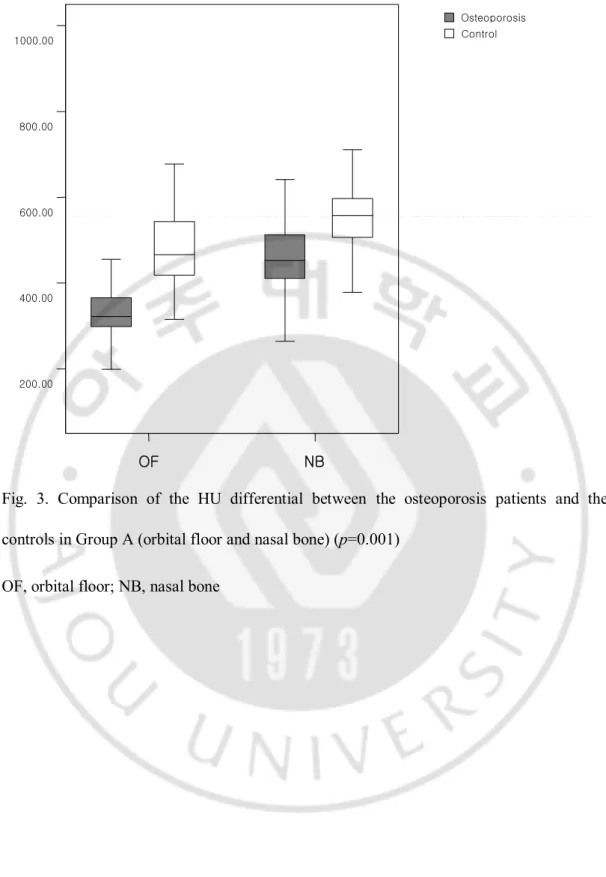
Fig. 3. Comparison of the HU differential between the osteoporosis patients and the controls in Group A (orbital floor and nasal bone) (p=0.001) ··· 10
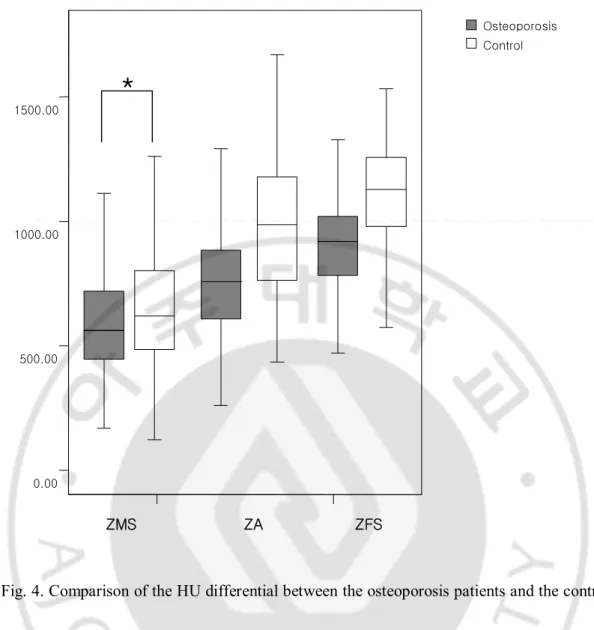
Fig. 4. Comparison of the HU differential between the osteoporosis patients and the controls in group B (zygomatic bone) (p=0.001; *p=0.01) ··· 11
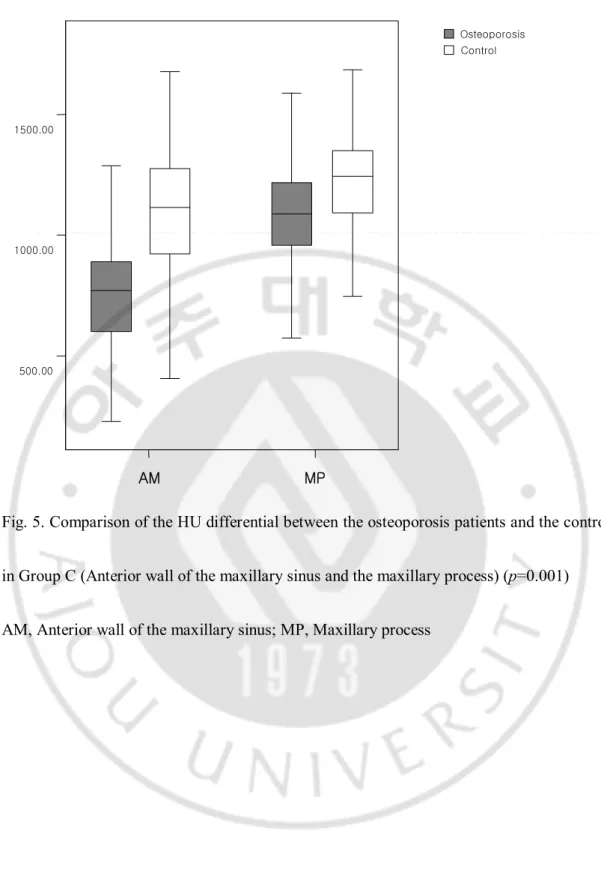
Fig. 5. Comparison of the HU differential between the osteoporosis patients and the controls in Group C (Anterior wall of the maxillary sinus and the maxillary process (p=0.001) ··· 12
vi
Lists of Tables
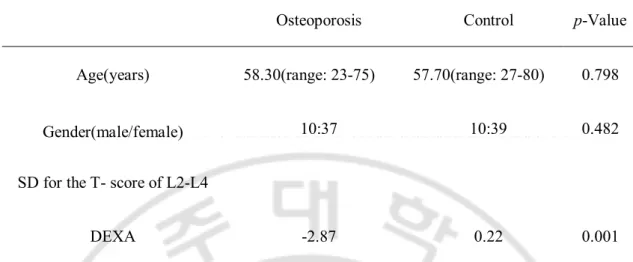
Table 1. Baseline characteristics of the osteoporosis and control groups··· 13
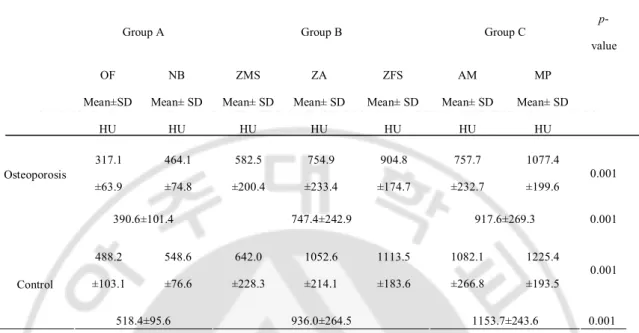
Table 2. For both groups, each of the comparisons of the seven skeletal region
- 1 -
I. INTRODUCTION
Osteoporosis is one of the most common metabolic bony skeletal diseases and is characterized by reduced bone mineral density, disrupted bone microarchitecture, altered non-collagenous proteins, higher bone fragility and an increased fracture risk. Due to the increasing age of the population in many countries, it is one of the most important common disorders of the elderly and it is estimated that 75 million people in Europe, Japan and the USA have osteoporosis (White, 2002). Many studies have reported that the compressive mechanical properties of cancellous bone and cortical bone are closely related to physical bone density (Keller, 1994). Traditionally, both two- and three-dimensional methods such as dual-energy X-ray absorptiometry (DEXA) or peripheral quantitative computed tomography (QCT) have been used for evaluating bone density. The Hounsfield unit (HU) is used to represent the attenuation coefficient measurement obtained in an x-ray CT reconstruction. Therefore, the measurement of HUs can also be used as one of the methods for assessing osteoporosis.
Osteoporosis was initially thought to be confined to long bones such as the spine and extremities. Some researchers have recently reported that the disease can also involve the
- 2 -
skull (White, 2002; Hohlweg-Majert et al, 2006; Taguchi et al, 1999; von Wowern & Kollerup, 1992). In the skull, osteoporosis can affect both the maxilla (White, 2002; Taguchi et al, 1999; von Wowern & Kollerup, 1992) and the mandible (White, 2002; Taguchi et al, 1996; Horner et al, 1996). Because many countries populations are aging, there has been increasing dental implantation, traumatic facial bone fracture and iatrogenic facial osteotomy for the elderly. To develop dental implants, many dental studies have evaluated the impact of osteoporosis in the maxilla and mandibular bone. Yet there are few reports in the literature regarding the impact of osteoporosis in the mid-facial bones, including the maxilla, zygoma and nasal bone. The aim of our study was to evaluate and compare the differences of bone densities in mid-facial bones between the osteoporosis group and the control groups using QCT scan measurements. We also tried to identify the regions that need careful attention after facial trauma and facial iatrogenic osteotomy in osteoporosis patients.
- 3 -
II. MATERIALS AND METHODS
A. Patients
From March 2001 to March 2007, we retrospectively analyzed the osteoporosis and control groups that underwent both osteomeatal unit computerized tomography (OMU CT) scans and Dual-Energy X-ray Absorptiometries (DEXA). The osteoporosis group was determined as satisfying the condition, <-2.5 SD for T score of L2-4 DEXA. In the L2-4 DEXA, the osteoporosis group had a significantly decreased T score than that of the control group (-2.87 vs. 0.22, p=0.000) (Table 1). A total of ninety-six patients (76 females and 20 males, mean age: 57.99) were include in this study. Forty-seven patients (37 females and 10 males, mean age: 58.30) were in the osteoporosis group and forty-nine patients (39 females and 10 males, mean age: 57.70) were in the control group. To determine the independent factors of osteoporosis that are not affected by age or gender, there was no statistically significant difference of mean age and gender between the osteoporosis group and control group.
- 4 -
The CT (scan parameters: 120 kVp, 250 mAs, scan time: 1000 ms, matrix size: 512x512, Philips. Brilliance, Netherlands) examinations were performed with spiral CT. The QCT scans were reviewed with a PACS (Picture Archiving and Communication System, Piview STAR, INFINITT, Seoul, Korea). Pixel intensity was analyzed by dragging the mouse in the region of interest (ROI) and the HUs were measured (Fig. 1). Seven skeletal regions were chosen for evaluation; Group A [Orbital floor (OF), Nasal bone (NB)], Group B [Zygomaticomaxillary suture (ZMS), Zygomatic arch (ZA), Zygomaticofrontal suture (ZFS)] and Group C [Anterior wall of the maxillary antrum (AM), Maxillary process (MP)] (Fig. 2). These seven regions were chosen because they were the most common traumatic or iatrogenic fracture sites of the facial bones. For the orbital floor (OF), the region was estimated to be at the medial side of the orbital floor. For the nasal bone (NB), the calculated region was the lowest area of the nasal bone showing whole nasal bone thickness. This region was the most common traumatic fracture site of the facial bones, and it is also the medial osteotomy site during rhinoplasty operations. In the zygoma, this region is the second most common isolated fracture site of the mid-face. If fractured, it becomes separated from its three attachment points; the zygomaticofrontal suture (ZFS), the inferior orbital rim
- 5 -
involving the postero-lateral wall of the maxillary sinus (zygomaticomaxillary suture (ZMS)) and the zygomatic arch (ZA). After checking the suture line on the coronal plane of the CT scan, we estimated these regions in the zygomatic bone areas. In the maxillay process (MP), the estimated region was a triangular area superior to the inferior turbinate and the starting point of the frontal process. This region is also the starting point of lateral osteotomy for iatrogenic fracture of the facial skeleton during a rhinoplasty operation. The anterior wall of the maxillary antrum (AM) was estimated at the most prominent region in the same plane showing the infra-orbital foramen in the axial plane of a CT scan. The measurements were randomly performed three times each by two otorhinolaryngologists and a radiologist, and the mean and standard deviation (SD) were calculated.
C. Data analysis
Comparative analysis of the raw data was performed with SPSS ver. 17.0.0 for Windows Statistical Software (SPSS Inc., Chicago, IL, USA). The data was subjected to statistical analysis to determine the correlation, if any, between the osteoporosis and control groups by using independent T-tests. ANOVA and Tukey’s Post Hoc comparisons were used for
- 6 -
comparing the recorded bone density (HU) in the different regions of the mid-face. P-Values < 0.01 were considered significant.
- 7 -
III. RESULTS
A total of 96 patients who had 1344 ROIs were assessed for this study. As a whole, there was a significant difference in the mean bone density of the mid-facial bones between the osteoporosis group and the control group. Group A indicated that the differences in bone density of the OF between the osteoporosis group and the control group was much greater than in the NB (Fig. 3). In group B, we noticed statistical differences of bone density in the ZA (p=0.001), the ZFS (p=0.000) and the ZMS (p=0.001). In addition, the standard deviation of the HU values in all the osteoporosis and control groups was much smaller in the ZFS region than in the ZA (Fig. 4). Group C indicated that differences in the mean bone density between the osteoporosis and control groups were greater in the AM than in the MP (Fig. 5). When comparing areas of the mid-facial bones by HU measurements, the highest value was Group C(AM,MP), followed by Group B(ZMS,ZFS,ZA) and Group A(IW,NB) in all of the osteoporosis and control groups (Table 2).
- 8 -
Fig. 1. The white round circle in the axial view indicates the region of interest (ROI). Pixel intensities were analyzed by dragging the mouse in the ROI, and the HUs were measured.
- 9 -
Fig. 2. Seven skeletal region were chosen for evaluation (1: orbital floor, 2: nasal bone, 3: zygomaticomaxillary suture, 4: zygomatic arch, 5: zygomaticofrontal suture, 6: anterior wall of the maxillary antrum, 7: maxillary process)
1 7 6 4 5 2 3 1 2 7 6 3 4 5
- 10 -
Fig. 3. Comparison of the HU differential between the osteoporosis patients and the controls in Group A (orbital floor and nasal bone) (p=0.001)
OF, orbital floor; NB, nasal bone
OF NB 200.00 400.00 600.00 800.00 1000.00 Osteoporosis Control
- 11 -
Fig. 4. Comparison of the HU differential between the osteoporosis patients and the controls in group B (zygomatic bone) (p=0.001; *p=0.01)
ZMS, zygomaticomaxillary suture; ZA, zygomatic arch; ZFS, zygomaticofrontal suture
ZMS 0.00 500.00 1000.00 1500.00 Osteoporosis Control ZA ZFS
*
- 12 -
AM, anterior wall of the maxillary antrum; MP, maxillary process
Fig. 5. Comparison of the HU differential between the osteoporosis patients and the controls in Group C (Anterior wall of the maxillary sinus and the maxillary process) (p=0.001) AM, Anterior wall of the maxillary sinus; MP, Maxillary process
AM MP 500.00 1000.00 1500.00 Osteoporosis Control
- 13 -
Table 1. Baseline characteristics of the osteoporosis and control groups.
Osteoporosis Control p-Value
Age(years) 58.30(range: 23-75) 57.70(range: 27-80) 0.798
Gender(male/female) 10:37 10:39 0.482
SD for the T- score of L2-L4
DEXA -2.87 0.22 0.001
Statistical significance test was done by independent t-test (SD, Standard Deviation; DEXA, Dual-Energy X-ray Absorptiometries)
- 14 -
Table 2. For both groups, each of the comparisons of the seven skeletal region were greater in the order of Group A<Group B< Group C (p=0.001).
Group A Group B Group C p-value OF Mean±SD HU NB Mean± SD HU ZMS Mean± SD HU ZA Mean± SD HU ZFS Mean± SD HU AM Mean± SD HU MP Mean± SD HU 317.1 ±63.9 464.1 ±74.8 582.5 ±200.4 754.9 ±233.4 904.8 ±174.7 757.7 ±232.7 1077.4 ±199.6 0.001 Osteoporosis 390.6±101.4 747.4±242.9 917.6±269.3 0.001 488.2 ±103.1 548.6 ±76.6 642.0 ±228.3 1052.6 ±214.1 1113.5 ±183.6 1082.1 ±266.8 1225.4 ±193.5 0.001 Control 518.4±95.6 936.0±264.5 1153.7±243.6 0.001
Statistical significance test was done by ANOVA test (OF, orbital floor; NB, nasal bone; ZMS, zygomaticomaxillary suture; ZA, zygomatic arch; ZFS, zygomaticofrontal suture; AM, anterior wall of the maxillary antrum; MP, maxillary process; SD, Standard Deviation; HU, Hounsfield units)
- 15 -
IV. DISCUSSION
Osteoporosis became clearly distinguishable from osteomalacia after Albright first mentioned the relationship between sclerosis and osteoporosis in 1930, and this theory is still widely accepted. As a result of the increasing average life span of humans, the rate of osteoporosis is also increasing. Women in menopause are particularly more disposed to osteoporosis due to the loss of estrogen secretion. According to the International Osteoporosis Foundation (IOF), osteoporosis affects approximately 1 in 3 women and 1 in 8 men worldwide. The current gold standard for diagnosing osteoporosis is estimating the bone mineral density. There are currently two ways to measure bone density: a DEXA examination and a QCT. The latter allows separate measurements of the density of cortical and trabecular bone (Cann, 1988) and precise three-dimensional anatomic localization, and provides direct density measurements stated in HUs. These methods could assess those changes that might lead to an improved ability to predict fracture risk non-invasively and they enable earlier interventional therapies (Dougherty, 1996). The HU is a standardized and accepted unit for reporting and displaying reconstructed x-ray CT values. This unit system
- 16 -
represents a line transformation from the original linear attenuation coefficient measurements into one where water is assigned a value of 0 and air is assigned a value of -1000. Cortical bone may range in value from +1000 to +1600. Trabecular bone shows a lower HU value. The CT appearance of osteoporotic bone is characterized by a general reduction of the HU value and a coarsening of the trabecular pattern on the scan (Kazakia & Majumdar, 2006).
The internationally agreed upon definition of osteoporosis is that it is characterized by low bone mass and microarchitectural deterioration of bone tissue leading to enhanced bone fragility and a consequent increase in fracture risk (Consensus development conference, 1991). A few studies have mentioned osteoporosis as a condition present in the medical histories of elderly patients with maxillofacial trauma (Gerbino et al, 1999). Werning et al. stated that elderly patients with osteoporosis are more likely to develop maxillofacial fractures in spite of suffering only low-impact trauma. Worsening osteoporosis is significantly associated with higher numbers of maxillofacial fracture (Werning et al, 2004). The nose is generally the most prominent projected part of the face and so it sustains the largest numbers of fractures. Fractures of the nose account for half of all facial bone
- 17 -
fractures. Tripod fracture or zygomaticomaxillary complex fracture is the second most common isolated trauma of the mid-face. The principal lines of fracture involve the three distinct processes of the zygomatic bone: the orbital, zygomatic and maxillary processes. In 1995, Hampson reviewed several previous articles and determined the biomechanical tolerances of the facial bones. The clinical tolerances of the facial bone areas were zygoma: 489~2401N, zygomatic arch: 890~1779N, maxilla: 668~1801N and nose: 342~450N. According to Hampson’s article, the zygoma and zygomatic arch were the strongest and thickest areas and the nasal bone was the weakest (Hampson, 1995). Thus, in our study, the values we measured were in the common regions of facial fracture. In this context, osteoporosis patients have been clearly identified to be in more dangerous situations than average people in the fortuitous fracture of the face. The HU values of the osteoporosis patients were less than those of the control group. This represents that osteoporosis itself can be an independent risk factor of accidental fracture, and the number of fracture sites may increase due to it. Similar conclusions were reached by other previous studies. In addition, the order of the facial bone regions with the lowest to highest density values was the same in both groups. This is the same as the order of the least to most common fracture sites of the
- 18 -
facial bone, which indicates the correlation between the changing mechanical bone properties in osteoporosis and the HU measurements.
In the facial bone, the values of QCT are difficult to predict because there are inter-individual and regional variations as well as site-to-site differences (Lindh et al, 1996; von Wowern & Stoltze, 1979). First, among the components of the facial bone, the trabecular bone is more sensitively affected by an operation than that of the cortical bone. The trabecular bone is influenced by the presence of varying amounts of fatty (yellow) bone marrow (Dougherty, 1996). It is becoming increasingly realized that the bone architecture, and particularly the connectivity of the trabecular bone, are important determinants of the mechanical strength of bone and fracture risk (Parfitt, 1987; Goldstein et al, 1993). Second, operator-dependent sizing and placement of these ROI can lead to significant precision error. A number of additional authors have insisted there is close correlation of the facial bone density and osteoporosis in the other parts of the skeleton. However, no one has agreed that this method of measuring is sufficient to use for properly predicting facial bone density. Thus, to reduce the odds in our study, we used anatomical landmarks to equalize the measuring regions when necessary, and we used relatively large ROIs. For dental
- 19 -
implantation, pre-operatively evaluating the bone density is essential to assist the clinician with the treatment planning for implant therapy. To improve the success rate of the procedures, detailed information on bone density will help the surgeon to identify suitable implant sites. Precise, quantitative, radiographic examination is required to obtain this pre-operative information (von Wowern & Stoltze, 1979). To develop dental implantation, many previous studies by dentists have focused on evaluating the bone density of the mandible and maxilla. von Wowern N. et al. demonstrated that bone marrow density in the oral cavity is significantly lower in patients with systemic osteoporosis than density in normal subjects (von Wowern et al, 1994).
Similar to dental implantation, we were able to apply these concepts to mid-facial operations, including corrective septorhinoplasty, reduction malarplasty and facial reconstructive surgery. When doing corrective septorhinoplasty, the medial, intermediate and lateral osteotomies are delicate procedures that require detailed information on bone density. Osteotomy in osteoporosis patients is not frequently done, but it is important for prevention of disastrous complications, including saddle nose and injury to the medial canthal ligament. In our research, the osteoporosis patients had smaller bone density values than that of the
- 20 -
control group in the medial osteotomy site of the nasal bone and the lateral osteotomy site of the maxillary process. Thus, in the case of osteoporosis, the bony nasal pyramid itself becomes more fragile, and it is therefore more susceptible to comminuted fracture. To prevent serious complication, we insist that osteotomies be done at the correct site and the operator should be well-acquainted with the bone density of the osteotomy line. Rod J. Rorich et al recommended that osteotomies should be avoided, if possible, in the aging patients (Rohrich et al, 2004). If osteotomies must be performed in the elderly, they should be done in low-to-low type using the percutaneous external technique, and be in a complete way rather than in greensticking to obtain a more even break. In our research, these proposals for osteotomy procedures in elderly patients were also suitable for other osteoporosis patients even though they are not elderly. More meticulous and careful osteotomies are required due to the fragility of the operating fields.
- 21 -
V. CONCLUSION
This study showed the direct and specific impacts of osteoporosis by performing QCT measurements. First, in the mid-facial bone, we were able to prove the correlation of osteoporosis with osteoporosis in other skeletal areas (lumbar), and this indicated the efficiency of QCT. Second, precise and quantitative radiologic examination of bone density will help the surgeon to choose a suitable facial osteotomy procedure. Third, a more detailed evaluation may be essential in osteoporosis patients with facial trauma because of the higher potential for multi-fracture than other patients. Last, we insist that osteotomy be done at the correct site because such osteoporosis patients have smaller bone density values for the nasal bones during rhinoplasty of a deviated nasal vault. Operating at the correct site of the nasal bone can prevent serious complications when performing corrective rhinoplasty.
- 22 -
REFERENCES
1. Cann CE. Quantitative CT for determination of bone mineral density: a review. Radiology 166:509-522, 1988
2. Consensus development conference: prophylaxis and treatment of osteoporosis. Am J Med 90:107-110, 1991
3. Dougherty G. Quantitative CT in the measurement of bone quantity and bone quality for assessing osteoporosis. Med Eng Phys 18:557-568, 1996
4. Gerbino G, Roccia F, De Gioanni PP, Berrone S. Maxillofacial trauma in the elderly. J Oral Maxillofac Surg 57:777-782, 1999
5. Goldstein SA, Goulet R, McCubbrey D. Measurement and significance of three-dimensional architecture to the mechanical integrity of trabecular bone. Calcif Tissue Int 53 (suppl 1):S127-132, 1993
6. Hampson D. Facial injury: a review of biomechanical studies and test procedures for facial injury assessment. J Biomech 28:1-7, 1995
- 23 -
osteoporosis in craniomaxillofacial surgery: a review of the literature. Osteoporos Int 17:167-179, 2006.
8. Horner K, Devlin H, Alsop CW, Hodgkinson IM, Adams JE. Mandibular bone mineral density as a predictor of skeletal osteoporosis. Br J Radiol 69:1019-1025, 1996
9. Kazakia GJ, Majumdar S. New imaging technologies in the diagnosis of osteoporosis. Rev Endocr Metab Disord 7:67-74, 2006
10. Keller TS. Predicting the compressive mechanical behavior of bone. J Biomech 27:1159-1168, 1994
11. Lindh C, Nilsson M, Klinge B, Petersson A. Quantitative computed tomography of trabecular bone in the mandible. Dentomaxillofac Radiol 25:146-150, 1996
12. Parfitt AM. Trabecular bone architecture in the pathogenesis and prevention of fracture. Am J Med 82:68-72, 1987
13. Rohrich RJ, Hollier LH, Jr., Janis JE, Kim J. Rhinoplasty with advancing age. Plast Reconstr Surg 114:1936-194, 2004
14. Taguchi A, Tanimoto K, Suei Y, Ohama K, Wada T. Relationship between the mandibular and lumbar vertebral bone mineral density at different postmenopausal stages.
- 24 -
Dentomaxillofac Radiol 25:130-135, 1996
15. Taguchi A, Suei Y, Ohtsuka M, Otani K, Tanimoto K, Hollender LG. Relationship between bone mineral density and tooth loss in elderly Japanese women. Dentomaxillofac Radiol 28:219-223, 1999
16. von Wowern N, Stoltze K. Age differences in cortical width of mandibles determined by histoquantitation. Scand J Dent Res 87:225-233, 1979
17. von Wowern N, Kollerup G. Symptomatic osteoporosis: a risk factor for residual ridge reduction of the jaws. J Prosthet Dent 67:656-660, 1992
18. von Wowern N, Klausen B, Kollerup G. Osteoporosis: a risk factor in periodontal disease. J Periodontol 65:1134-1138, 1994
19. Werning JW, Downey NM, Brinker RA et al. The impact of osteoporosis on patients with maxillofacial trauma. Arch Otolaryngol Head Neck Surg 130:353-356, 2004.
20. White SC. Oral radiographic predictors of osteoporosis. Dentomaxillofac Radiol 31:84-92, 2002
- 25 - - 국문요약 -
전산화단층촬영술을 이용한 골다공증 환자에서의 안면골
골밀도의 유의성
아주대학교 대학원의학과 이 종 주 (지도교수 : 김 현 준)본 연구는 안면골의 골밀도를 QCT(Quantitative computed tomography)를 이용하여 측정해서 골다공증 환자와 정상군을 비교하고 평가할 뿐만 아니라 안면 외상이 발생하거나 의원성 절골술 시행 시 안면골에서의 ROI(region of intrest)를 모색하고자 하였다. 아주대학교병원에서 OMU CT 와 DEXA(Dual-Energy X-ray Absorptiometries)를 같이 시행한 96 명의 환자에 대해서 후향적으로 분석하였다. 47 명의 골다공증 환자군과 49 명의 정상 대조군에 대해서 PACS(Picture Archiving and Commincation System, Piveiw Star; INFINNIT, Seoul, Korea.)에서 QCT 를 이용하여 ROI(region of intrest)에 마우스를 지정하는 방법으로 Pixel intensity 를 분석하여 HU(Hounsfield
unit)를 측정해서 골밀도를 간접적으로 구하여 비교하고 분석하였다.
ROI(region of intrest)는 A 군(orbital floor, nasal bone),
B 군(zygomaticomaxillary suture, zygomatic arch, zygomaticofrontal suture), C 군(anterior wall of maxillary antrum, maxillary process)로 지정하고 세 군으로 나누었다. 안면골의 평균 골밀도에 대해서 골다공증 환자군과 정상 대조군 간에 유의한 차이가 있었다(p=0.000). 골다골증 환자군과 정상
- 26 -
대조군에서 세 군을 비교하였을 때 A 군<B 군<C 군의 순으로 안면골의 골밀도 값이 증가하였다(p=0.000). QCT 를 이용하여 골다공증이 안면골에 미치는 영향을 관찰할 수 있었다.
핵심어 : 골다공증, Quantitative computed tomography scan, 절골술, 골밀도, 외비성형술