토양수분관측망을 활용한 토양수분의 실측값과 추정값 상관성 평가
옥정훈
1
⋅김동진1*
⋅한경화1
⋅정강호2
⋅이경도3
⋅장용선1
⋅조희래1
⋅황선아1
1)1
농촌진흥청 국립농업과학원 토양비료과,2
농촌진흥청 국립농업과학원 기획조정과,3
농촌진흥청 국립농업과학원 기후변화생태과(2019년 10월 22일 접수; 2019년 11월 26일 수정; 2019년 11월 29일 수락)
Relationship between Measured and Predicted Soil Water Content using Soil Moisture Monitoring Network
Jung-hun Ok 1 , Dong-Jin Kim 1* , Kyung-hwa Han 1 , Kang-Ho Jung 2 , Kyung-Do Lee 3 , Yong-seon Zhang 1 , Hee-rae Cho 1 and Seon-ah Hwang 1
1 Divison of Soil and Fertilizer, National Institute of Agricultural Sciences, Rural Development Administration, Wanju, Jeonbuk 55365, Republic of Korea
2 Divison of Planning and Coordination, National Institute of Agricultural Sciences, Rural Development Administration, Wanju, Jeonbuk 55365, Republic of Korea
3 Divison of Climate Change and Agroecology, National Institute of Agricultural Sciences, Rural Development Administration, Wanju, Jeonbuk 55365, Republic of Korea (Received October 22, 2019; Revised November 26, 2019; Accepted November 29, 2019)
ABSTRACT
Soil moisture monitoring is an important task to cope with climate change, and soil water prediction can provide large-scale soil moisture information. Therefore, this study was conducted to evaluate the relationship between the measured and predicted soil water content, and to estimate the correlation between the soil characteristics and soil water content. The selected sites in soil moisture monitoring network were 76, and the soil with high sand content (sand, loamy sand, and sandy loam in soil texture) accounted for 77% of the total.
Organic matter and bulk density were 0.03 to 3.50% and 1.01 to 1.69 Mg m -3 , respectively.
Predicting values of field capacity and wilting point were lower than the measured soil water content, and the correlation coefficient between the measured and predicted values were low as 0.548 to 0.748. However, a significantly high positive correlation (p<0.01) found between the measured and predicted soil water content. Soil water (field water capacity and wilting point) content was highly positively correlated with silt, clay, and organic matter (p<0.01) and highly negatively correlated with sand (p<0.01).
Key words: Field capacity, Wilting point, Soil water, Predicting equation, Soil characteristics
I. 서 론
전 세계적으로 물 공급량의 70%가 농업용수로 사
용되고 있으며, 국내에서도 수자원 중 농업용수의 비 율이 62%를 차지하고 있다(MOLIT, 2011; Saccon, 2018). 하지만 최근 가뭄 빈도와 강도가 증가하고 물
* Corresponding Author : Dong-Jin Kim ([email protected])
DOI: 10.5532/KJAFM.2019.21.4.297
ⓒ Author(s) 2019. CC Attribution 3.0 License.
부족 현상이 심화되면서 농업 분야에서 기후변화 대응 을 위한 토양수분 변동 예측에 대한 평가가 중요시 되고 있으며(Wang and Qu, 2009; Hanjra and Qureshi, 2010), 라이시미터 등을 활용하여 강우 및 물관리 방법에 따른 토양내 수분의 이동, 토양특성에 따른 토양수분변동에 대한 연구가 활발히 이루어지고 있다(Seo et al., 2017; Kim et al., 2018; Ok et al., 2018).
토양수분 측정은 현장에서 토양시료를 채취하여 분 석하는 중량법, 토양 중에서의 물과 토양입자 표면의 결합력을 측정하는 텐시오미터법, 전기저항 또는 전자 파의 변화를 이용하는 센서 활용법 등이 있으나(Seo
et al., 2012), 분석시간, 설치환경의 제한, 비용, 측정
오차 등의 문제점을 가지고 있다(Seo et al., 2012; Huret al., 2014). 강우 등 기상변화와 토양 특성에 따라
토양내의 수분함량 변화를 정확하게 예측하고 이를 검 증할 수 있다면 기후변화에 보다 효율적으로 대응할 수 있을 것으로 생각된다. 토양내 수분이동 및 토양수 분은 토양입자분포, 용적밀도, 유기물 함량 등 토양 특성에 따라 많은 영향을 받으며(Durner, 1994;Assouline, 2006; Jung et al., 2015), 이러한 토양 인자 를 활용한 토양수분 추정식이 여러 학자들에 의하여 제안되었다(Gupta and Larson, 1979; Rawls et al., 1982; Oliveira et al., 2002; Reichert et al., 2009).
특히 토양수분 중 포장용수량과 위조점은 관개시점을 설정하고 식물의 유효수분을 평가하는 측면에서 중요 하게 다루어진다(Grewal et al., 1990). 국립농업과학 원에서는 전국의 농업기상대 관리 지점에 토양수분센 서를 설치하여 토양수분 변화를 모니터링하고 그 정보 를 농업기상정보서비스(weather.rda.go.kr)에서 제공 하고 있다. 향후 토양수분센서로 측정된 토양수분 정 보를 체계적으로 관리하고 양질의 서비스를 제공하기 위하여 토양수분관측망에 대한 기초 토양조사가 필요 하다. 대단위 토양수분 정보를 관리하고 장기적 관점 에서 기후변화에 대응하기 위해서는 토양 인자를 바탕 으로 한 토양수분 예측이 요구된다.
따라서 본 연구에서는 토양수분관측망(soil moisture monitoring network)에서 토양 특성과 토양수분 함량 을 조사하여 포장용수량 및 위조점에 대한 실측값과 추정값을 비교 평가하였으며 토양 인자와 토양수분의 상관성 분석을 통해 기초자료를 제공하고자 한다.
II. 재료 및 방법
2.1. 토양수분관측망 개요
토양수분관측망은 전국 농업기상대와 연계하여 표 토 10 cm 에 토양수분센서를 전체 168 지점에 설치하 여 운영되고 있다. 전체 168 지점 중 Pico-64 토양수분 센서(Trime-pico, IMKO, German)는 121 지점에 설치 되어 있다. Pico-64 토양수분센서는 TDR (time domain reflectometry) 방식으로 토양수분함량을 비파과적으 로 측정하며 측정 매질의 토성, 유기물함량, 하전특성 에 의한 영향이 적어 비교적 정확한 측정값을 얻을 수 있다. 본 연구에서는 조사지점 선정을 위하여 주변 환경을 고려하였으며, 농업기상대 주변이 논으로 관리 되는 지점, 관수시설이 있는 과수원 지점, 콘크리트 시설물 주위나 도로 인근에 위치한 지점 등과 같이 토양수분변화에 영향을 줄 것으로 예상되는 지점과 석 비례나 자갈함량이 높은 토양으로 복토한 지점 등은 상관성 분석 지점에서 제외하였다. 이러한 환경을 고 려한 결과, 121 지점 중 76 지점이 선정되었으며 토성, 유기물함량, 용적밀도, 토양수분(포장용수량 및 위조 점) 등 토양 특성을 조사하였다.
2.2. 선정 지점의 토양 특성 조사
토양수분센서로 측정된 장기 모니터링 자료를 검 증하고 체계적인 관리 시스템을 구축하고자 토양수 분관측망에 대한 토양 기초조사가 요구된다. 선정 지 점의의 토양 물리성 분석을 위해 토양시료는 2 인치 코어를 이용하여 채취하였다. 토양수분센서가 설치된 지점으로부터 반경 1 m이내의 지점을 채취지점으로 하였으며 표면으로부터 10 cm에 해당하는 깊이에서 채취하였다. 채취한 토양은 토성 및 용적밀도를 분석하 였으며, 토성(soil texture)은 비중계법(Gee and Bauder, 1986)에 따라 토양입자분포 비율을 산정 후 미국 농무성 (United States Department of Agriculuture, USDA)의 토성삼각표(soil texture triangle)를 이용하여 결정하였 다. 용적밀도(bulk density, BD)는 코아법(Blake and Hartge, 1986)에 따라 실시하였다.
토양수분 함량은 포장용수량(field capacity, FC)과 위조점(wilting point, WP)을 조사하였으며, 국립농업 과학원의 토양물리성 조사방법(NIAS, 2017)에 준하 여 분석하였다. 포장용수량은 압력챔버(pressure porous plate chamber)를 이용하여 33 kPa 에서, 위조
점은 압력멤브레인(mambrance plate apparatus)을 이 용하여 1500 kPa 에서 해당 압력을 수시간 동안 가한 후 토양에 남은 수분함량을 계산하여 산출하였다.
토양 유기물(organic matter, OM) 분석을 위한 토양 시료는 토양 표면의 부유물을 걷어낸 후 토양시료채취 기(augar)를 이용하여 표토(5∼15 cm)에서 채취하였 으며, 풍건쇄토하여 2.0 mm 체를 통과시킨 후 Tyurin 법에 따라 분석하였다(NAAS, 2010).
2.3. 토양수분 실측값과 추정값의 상관관계 분석
토양 특성의 기초 인자를 바탕으로 광범위한 토양 의 수분함량을 추정하는 것은 다양한 토양 환경에 적 용할 수 점에서 중요한 의미를 갖는다. 실측값은 현장 에서 채취한 토양으로 33 kPa 및 1500 kPa 조건에서 토양수분함량을 측정한 포장용수량과 위조점을 사용 하였다. 그 분석 방법은 “2.2. 선정 지점의 토양 특성 조사”에 제시되어 있다. 포장용수량 및 위조점의 추정 값은 Gupta and Larson(1979), Rawls et al.(1982), Oliveira et al.(2002) 및 Reichert et al.(2009)가 제안 한 4 종류의 추정공식을 사용하였다. 이들 추정공식은 모래, 미사, 점토, 유기물, 용적밀도 등의 기본 토양 인자를 적용하여 비교적 간단히 토양수분 추정값을 계 산할 수 있다.Gupta and Larson(1979)이 제안한 포장용수량 (field capacity, FC) 및 위조점(wilting point, WP) 추 정공식은 각각 Eq. 1 및 Eq. 2 와 같다.
Rawls et al.(1982)이 제안한 추정공식은 Eq. 3(포 장용수량) 및 Eq. 4(위조점)와 같다.
Oliveira et al.(2002)은 다음 Eq. 5(포장용수량) 및 Eq. 6(위조점)와 같은 산출공식을 제안하였다.
Reichert et al.(2009)은 포장용수량 및 위조점 추정 을 위하여 각각 다음의 Eq. 7 및 Eq. 8 와 같은 산출공 식을 제안하였다.
위 4 종류의 추정공식으로 산출된 포장용수량과 위 조점의 추정값과 실험으로 측정된 실측값의 상관관계 분석을 위하여 Pearson’s correlation analysis 를 실시 하였으며, 통계프로그램으로 SPSS (statistical package for the social sciences, ver. 18.0, SPSS, Inc., Chicago, IL, USA)를 사용하였다. 추정값들 간 상관성을 확인 하고자 이 또한 Pearson’s correlation analysis 를 실시 하였다.
2.4. 토양 인자와 토양수분의 상관관계 분석
토양 인자로서 모래, 미사, 점토, 유기물, 용적밀도 등이 토양수분 함량에 관여하며, 토양수분 추정공식에 이들 인자가 적용된다. 토양 인자와 토양수분의 상관 성을 확인하는 것은 토양수분을 추정하는데 있어 중요 한 사항이다. 토양 인자와 토양수분의 상관관계 분석 은 SPSS (statistical package for the social sciences, ver. 18.0, SPSS, Inc., Chicago, IL, USA)의 Pearson’s correlation analysis 를 이용하였다.III. 결과 및 고찰
3.1. 토양수분관측망 토양 분석 결과
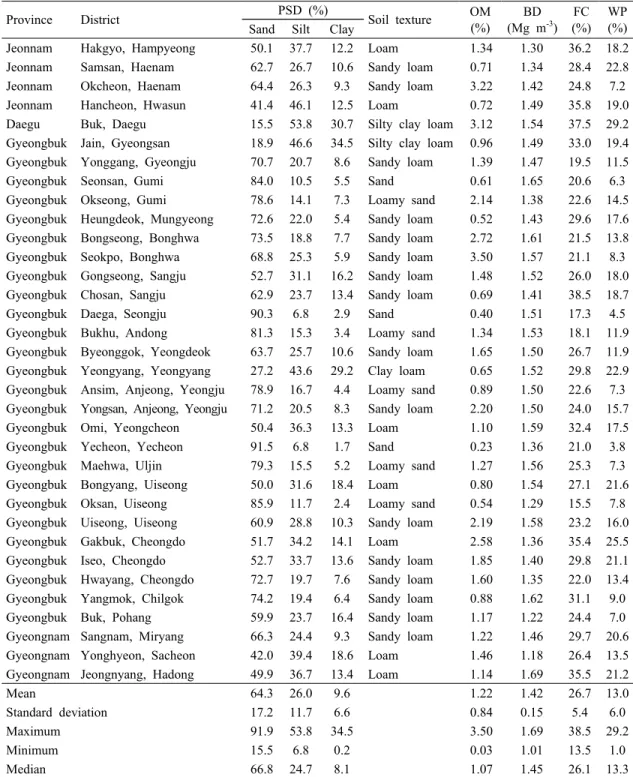
전국 토양수분관측망 중 본 연구에 선정된 76 지점 의 토양특성 분석결과는 Table 1 과 같다. 토성은 모래 함량이 높은 사토(11%), 양질사토(17%), 사양토 (49%)가 전체의 77%를 차지하였으며 양토는 17%, 점 토함량이 18%이상인 지점은 전체의 8% 수준이었다.
FC-GL θ = 0.003075×SA+0.005886×SI+0.008039×CL+0.002208×OM-0.1434×BD (Eq. 1) WP-GL θ = -0.000059×SA+0.001142×SI+0.005766×CL+0.002228×OM+0.02671×BD (Eq. 2)
θ, cm
3
cm-3
; SA, sand (%); SI, silt (%); CL, clay (%); OM, organic matter (%);BD, bulk density (g cm
-3
).FC-RA θ = 0.2576-0.0020×SA+0.0036×CL+0.0299×OM (Eq. 3)
WP-RA θ = 0.026+0.005×CL+0.0158×OM (Eq. 4)
θ, cm
3
cm-3
; SA,sand (%); CL, clay (%); OM, organic matter (%).FC-OL θ = 0.000333×SI+0.000387×CL (Eq. 5)
WP-OL θ = 0.000038×SA+0.000153×SI+0.000341×CL-0.030861×BD (Eq. 6) θ, kg kg
-1
; SA, sand (g kg-1
); SI, silt (g kg-1
); CL, clay (g kg-1
); BD, bulk density (kg dm-3
).FC-RE θ = 0.106+0.29×(CL+SI)+0.93×OM-0.048×BD (Eq. 7)
WP-RE θ = -0.04+0.15×CL+0.17×(CL+SI)+0.91×OM+0.026×BD (Eq. 8) θ, kg kg
-1
; SI, silt (kg kg-1
); CL, clay (kg kg-1
); OM, organic matter (kg kg-1
);BD, bulk density (kg dm
-3
).Province District PSD (%)
Soil texture OM (%)
BD (Mg m
-3
)FC (%)
WP Sand Silt Clay (%)
Gyeonggi Deogyang, Goyang 66.6 27.2 6.2 Sandy loam 1.16 1.48 22.9 14.6 Gyeonggi Gwonseon, Suwon 76.0 17.9 6.1 Sandy loam 0.18 1.37 26.1 9.5 Gyeonggi Danwon, Ansan 53.2 30.6 16.2 Sandy loam 0.16 1.01 35.0 21.3 Gyeonggi Sangnok, Ansan 66.2 23.9 9.9 Sandy loam 0.59 1.45 32.1 17.4 Gyeonggi Gwangjeok, Yangju 70.5 22.9 6.6 Sandy loam 0.05 1.33 19.3 1.0 Gyeonggi Sinseo, Yeoncheon 65.4 26.5 8.1 Sandy loam 1.68 1.25 24.9 13.5 Gyeonggi Bongdam, Hwaseong 52.6 41.6 5.8 Sandy loam 0.12 1.44 30.5 9.8 Gangwon Bukpyeng, Donghae 69.6 24.3 6.1 Sandy loam 2.11 1.49 25.0 10.9 Gangwon Geundeok, Samcheok 74.8 25.0 0.2 Loamy sand 1.70 1.53 26.5 14.6 Gangwon Daepo, Sokcho 80.6 17.4 2.0 Loamy sand 0.32 1.45 17.9 8.4 Gangwon Mandae, Haean, Yanggu 59.8 30.3 9.9 Sandy loam 2.32 1.31 31.4 14.7 Gangwon Mandae, Haean, Yanggu 91.9 7.0 1.1 Sand 0.59 1.49 20.9 5.2 Gangwon Yeongwol, Yeongwol 80.3 15.5 4.2 Loamy sand 0.80 1.33 21.2 6.5 Gangwon Inje, Inje 69.9 25.5 4.6 Sandy loam 0.68 1.37 24.5 13.4 Gangwon Jeongseon, Jeongseon 87.9 10.4 1.7 Sand 1.24 1.22 19.8 1.8 Gangwon Hwangji, Taebaek 56.6 35.3 8.1 Sandy loam 2.94 1.05 24.9 21.1 Gangwon Bangnim, Pyeongchang 38.6 49.3 12.1 Loam 1.69 1.31 24.3 9.2 Gangwon Jinbu, Pyeongchang 68.0 30.1 1.9 Sandy loam 2.41 1.13 24.3 2.9 Gangwon Hwacheon, Hwacheon 64.4 25.7 9.9 Sandy loam 0.03 1.65 24.4 13.2 Gangwon Gonggeun, Hoengseong 70.1 24.1 5.8 Sandy loam 1.24 1.46 27.7 7.8 Chungbuk Okcheon, Okcheon 85.0 11.5 3.5 Sand 0.36 1.54 24.1 6.9 Chungbuk Bongyang, Jecheon 91.1 7.8 1.1 Sand 0.59 1.53 13.5 4.6 Chungbuk Namil, Cheongju 82.3 12.6 5.1 Loamy sand 0.54 1.67 27.5 7.9 Chungnam Duman, Gyeryong 82.2 12.5 5.3 Loamy sand 0.67 1.39 25.6 11.5 Chungnam Geumseong, Geumsan 77.7 17.6 4.7 Loamy sand 0.71 1.50 24.5 6.6 Chungnam Gyuam, Buyeo 72.0 21.4 6.6 Sandy loam 0.67 1.58 34.5 9.0 Chungnam Sinam, Yesan 39.7 39.7 20.6 Loam 1.06 1.55 27.2 11.0 Chungnam Taean, Taean 61.6 32.2 6.2 Sandy loam 0.58 1.17 26.1 7.7 Jeonbuk Buryang, Gimje 66.9 25.3 7.8 Sandy loam 2.64 1.22 32.5 11.7 Jeonbuk Ibaek, Namwon 70.3 21.3 8.4 Sandy loam 0.32 1.41 22.5 12.1 Jeonbuk Muju, Muju 83.1 7.7 9.2 Loamy sand 0.58 1.50 25.9 5.6 Jeonbuk Jangsu, Jangsu 62.8 23.4 13.8 Sandy loam 1.08 1.30 31.8 10.0 Jeonbuk Jeongu, Jeongeup 69.7 24.0 6.3 Sandy loam 0.98 1.34 35.6 15.0 Jeonbuk Jinan, Jinan 85.6 10.5 3.9 Sand 0.15 1.50 25.5 5.9 Jeonnam Pungyang, Goheung 32.6 50.8 16.6 Silt loam 2.57 1.20 33.4 20.2 Jeonnam Gurye, Gurye 45.8 39.4 14.8 Loam 1.19 1.13 32.4 18.5 Jeonnam Hyeongyeong, Muan 46.2 37.0 16.8 Loam 0.67 1.42 26.4 15.7 Jeonnam Ungchi, Boseong 31.6 52.0 16.4 Silt loam 2.48 1.46 27.3 17.9 Jeonnam Jusam, Yeosu 46.9 37.1 16.0 Loam 1.98 1.26 30.9 16.2 Jeonnam Jangseong, Jangseong 61.1 28.4 10.5 Sandy loam 1.09 1.21 30.8 15.2 Jeonnam Jangheung, Jangheung 75.5 19.0 5.5 Loamy sand 0.31 1.29 28.3 17.5 Jeonnam Gunnae, Jindo 40.2 43.0 16.8 Loam 0.97 1.39 29.9 16.9 (continued on next page)
Table 1. Soil characteristics in soil moisture monitoring network (n=76)
Province District PSD (%)
Soil texture OM (%)
BD (Mg m
-3
)FC (%)
WP Sand Silt Clay (%)
Jeonnam Hakgyo, Hampyeong 50.1 37.7 12.2 Loam 1.34 1.30 36.2 18.2 Jeonnam Samsan, Haenam 62.7 26.7 10.6 Sandy loam 0.71 1.34 28.4 22.8 Jeonnam Okcheon, Haenam 64.4 26.3 9.3 Sandy loam 3.22 1.42 24.8 7.2 Jeonnam Hancheon, Hwasun 41.4 46.1 12.5 Loam 0.72 1.49 35.8 19.0 Daegu Buk, Daegu 15.5 53.8 30.7 Silty clay loam 3.12 1.54 37.5 29.2 Gyeongbuk Jain, Gyeongsan 18.9 46.6 34.5 Silty clay loam 0.96 1.49 33.0 19.4 Gyeongbuk Yonggang, Gyeongju 70.7 20.7 8.6 Sandy loam 1.39 1.47 19.5 11.5 Gyeongbuk Seonsan, Gumi 84.0 10.5 5.5 Sand 0.61 1.65 20.6 6.3 Gyeongbuk Okseong, Gumi 78.6 14.1 7.3 Loamy sand 2.14 1.38 22.6 14.5 Gyeongbuk Heungdeok, Mungyeong 72.6 22.0 5.4 Sandy loam 0.52 1.43 29.6 17.6 Gyeongbuk Bongseong, Bonghwa 73.5 18.8 7.7 Sandy loam 2.72 1.61 21.5 13.8 Gyeongbuk Seokpo, Bonghwa 68.8 25.3 5.9 Sandy loam 3.50 1.57 21.1 8.3 Gyeongbuk Gongseong, Sangju 52.7 31.1 16.2 Sandy loam 1.48 1.52 26.0 18.0 Gyeongbuk Chosan, Sangju 62.9 23.7 13.4 Sandy loam 0.69 1.41 38.5 18.7 Gyeongbuk Daega, Seongju 90.3 6.8 2.9 Sand 0.40 1.51 17.3 4.5 Gyeongbuk Bukhu, Andong 81.3 15.3 3.4 Loamy sand 1.34 1.53 18.1 11.9 Gyeongbuk Byeonggok, Yeongdeok 63.7 25.7 10.6 Sandy loam 1.65 1.50 26.7 11.9 Gyeongbuk Yeongyang, Yeongyang 27.2 43.6 29.2 Clay loam 0.65 1.52 29.8 22.9 Gyeongbuk Ansim, Anjeong, Yeongju 78.9 16.7 4.4 Loamy sand 0.89 1.50 22.6 7.3 Gyeongbuk Yongsan, Anjeong, Yeongju 71.2 20.5 8.3 Sandy loam 2.20 1.50 24.0 15.7 Gyeongbuk Omi, Yeongcheon 50.4 36.3 13.3 Loam 1.10 1.59 32.4 17.5 Gyeongbuk Yecheon, Yecheon 91.5 6.8 1.7 Sand 0.23 1.36 21.0 3.8 Gyeongbuk Maehwa, Uljin 79.3 15.5 5.2 Loamy sand 1.27 1.56 25.3 7.3 Gyeongbuk Bongyang, Uiseong 50.0 31.6 18.4 Loam 0.80 1.54 27.1 21.6 Gyeongbuk Oksan, Uiseong 85.9 11.7 2.4 Loamy sand 0.54 1.29 15.5 7.8 Gyeongbuk Uiseong, Uiseong 60.9 28.8 10.3 Sandy loam 2.19 1.58 23.2 16.0 Gyeongbuk Gakbuk, Cheongdo 51.7 34.2 14.1 Loam 2.58 1.36 35.4 25.5 Gyeongbuk Iseo, Cheongdo 52.7 33.7 13.6 Sandy loam 1.85 1.40 29.8 21.1 Gyeongbuk Hwayang, Cheongdo 72.7 19.7 7.6 Sandy loam 1.60 1.35 22.0 13.4 Gyeongbuk Yangmok, Chilgok 74.2 19.4 6.4 Sandy loam 0.88 1.62 31.1 9.0 Gyeongbuk Buk, Pohang 59.9 23.7 16.4 Sandy loam 1.17 1.22 24.4 7.0 Gyeongnam Sangnam, Miryang 66.3 24.4 9.3 Sandy loam 1.22 1.46 29.7 20.6 Gyeongnam Yonghyeon, Sacheon 42.0 39.4 18.6 Loam 1.46 1.18 26.4 13.5 Gyeongnam Jeongnyang, Hadong 49.9 36.7 13.4 Loam 1.14 1.69 35.5 21.2
Mean 64.3 26.0 9.6 1.22 1.42 26.7 13.0
Standard deviation 17.2 11.7 6.6 0.84 0.15 5.4 6.0
Maximum 91.9 53.8 34.5 3.50 1.69 38.5 29.2
Minimum 15.5 6.8 0.2 0.03 1.01 13.5 1.0
Median 66.8 24.7 8.1 1.07 1.45 26.1 13.3
†
PSD, particle size distribution; OM, organic matter; BD, bulk density; FC, field capacity; WP, wilting point.Table 1. Continued
유기물 함량은 0.03∼3.50%(평균 1.22%)의 범위로 지 점에 따라 많은 차이를 보였다. 용적밀도는 1.01∼1.69 Mg m
-3
의 범위였으며 전체 평균은 1.42 Mg m-3
로 나타났다. 2017 년도 우리나라 밭토양의 유기물 및 용 적밀도 평균은 각각 1.83%, 1.50 Mg m-3
이었으며 (Cho et al., 2018), 토양수분관측망의 유기물 함량과 용적밀도는 우리나라 밭토양과 비교하여 낮은 수준이 었다. 토양수분으로 측정된 포장용수량과 위조점은 각 각 13.5∼38.5%(평균 26.7%), 1.0∼29.2%(평균 13.0%) 범위였다. 토양수분관측지점은 농업기상대와 연계하여 설치되어 있으며, 농업기상대 설치시 표토를 석비례로 복토하는 경우가 많아 모래함량이 높은 토성 이 많이 분포하는 것으로 판단된다. 이러한 지점은 향 후 토양수분 데이터 분석이나 활용에 충분히 고려되어 야 할 것이다.3.2. 토양수분 실측값과 추정값의 비교
광범위한 토양 조건에서 토양수분 함량을 추정하기 위해 토양수분관측망 연구에서 얻어진 76 지점의 실 측값과 추정식으로부터 산출된 추정값을 비교 평가하 였다. 추정식은 Gupta and Larson(1979), Rawls et
al.(1982), Oliveira et al.(2002)와 Reichert et
al.(2009)이 제안한 방법을 사용하였다. 토양수분은 포
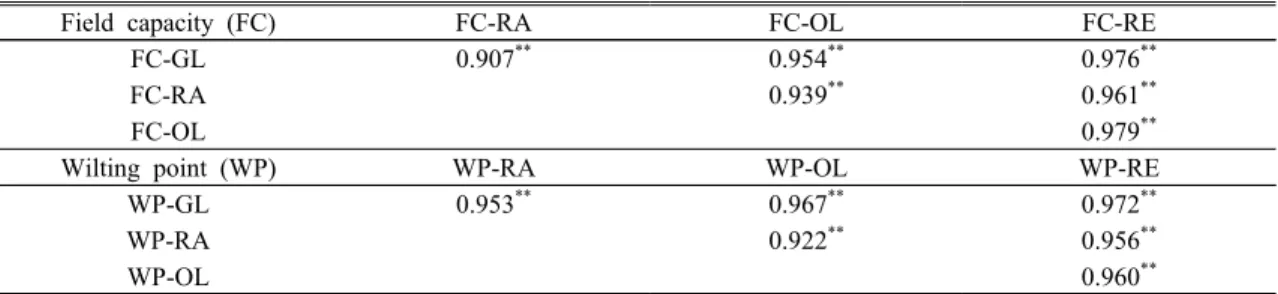
장용수량과 위조점 상태를 선정하였으며, 포장용수량 과 위조점의 추정식들 간 상관성은 Table 2 에 나타내었 다. 포장용수량에서 각 추정식들의 상관계수는 0.907∼0.979 로서 고도로 유의한 정의 상관관계(p<0.01) 였으 며, 위조점 또한 상관계수 0.922∼0.972 로서 고도로 유 의한 정의 상관관계(p<0.01)가 나타났다.
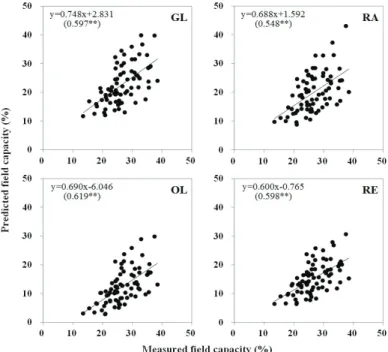
포장용수량의 실측값과 추정값의 상관관계는 Fig.
1 과 같다. 실측값을 x 축, 추정값을 y 축으로 하여 상 관성을 조사한 결과, 기울기는 0.600∼0.748, 상관계수 는 0.548∼0.619 로서 기울기와 상관계수 모두 낮게 나 타났다. 기울기가 낮아 포장용수량의 추정값은 과소 산 정된 것으로 볼 수 있다. 포장용수량의 추정식들 간 상관계수가 0.9 이상인 것(Table 2)을 감안하면 실측값 과 추정값의 상관성은 상대적으로 낮게 나타났다. 하지 만 상관관계는 정의상관으로서 고도로 유의(p<0.01) 하여 유의적 상관성이 있는 것으로 판단할 수 있다.
위조점의 실측값과 추정값의 상관관계는 Fig. 2 에 나타내었다. 실측값과 추정값의 상관관계에서 기울기 는 0.371∼0.580, 상관계수는 0.676∼0.706 으로서 위 조점의 추정값은 과소 추정되었으며, 상관성 역시 상대 적으로 낮게 나타났다. 하지만 고도로 유의한 정의 상관
FC-ME WP-ME FC-GL WP-GL FC-RA WP-RA FC-OL WP-OL FC-RE WP-RE Sand -0.619
**
-0.699**
-0.953**
-0.957**
-0.937**
-0.894**
-1.000**
-0.981**
-0.981**
-0.977**
Silt 0.598
**
0.655**
0.918**
0.856**
0.888**
0.787**
0.961**
0.914**
0.964**
0.924**
Clay 0.558
**
0.664**
0.864**
0.982**
0.876**
0.940**
0.908**
0.942**
0.855**
0.916**
OM 0.111 0.285
*
0.341**
0.287*
0.604**
0.526**
0.323**
0.297**
0.459**
0.459**
BD -0.119 -0.064 -0.426
**
-0.009 -0.131 -0.073 -0.142 -0.245*
-0.282*
-0.043†
OM, organic matter; BD, bulk density; ME, measured by laboratory experiment; GL, Gupta and Larson (1979); RA, Rawls et al.(1982); OL, Oliveira et al.(2002); RE, Reichert et al.(2009).Table 3. The correlation coefficient (r) between the soil characteristics and soil water content (n=76)
Field capacity (FC) FC-RA FC-OL FC-RE
FC-GL 0.907
**
0.954**
0.976**
FC-RA 0.939
**
0.961**
FC-OL 0.979
**
Wilting point (WP) WP-RA WP-OL WP-RE
WP-GL 0.953
**
0.967**
0.972**
WP-RA 0.922
**
0.956**
WP-OL 0.960
**
†
GL, Gupta and Larson(1979); RA, Rawls et al. (1982); OL, Oliveira et al.(2002); RE, Reichert et al.(2009).Table 2. The correlation coefficient (r) among the soil water content predicted by various equations (n=76)
Fig. 1. Relationship between the measured field capacity and predicted field capacity (n=76). GL, Gupta
and Larson(1979); RA, Rawls et al.(1982); OL, Oliveira et al.(2002); RE, Reichert et al.(2009). Correlation coefficient (r) in brackets was determined by Pearson correlation analysis to evaluate the relationship between parameters; *, significant at p < 0.05, and **, significant at p < 0.01.Fig. 2. Relationship between the measured wilting point and predicted wilting point (n=76). GL, Gupta and
Larson(1979); RA, Rawls et al.(1982); OL, Oliveira et al.(2002); RE, Reichert et al.(2009). Correlation coefficient (r) in brackets was determined by Pearson correlation analysis to evaluate the relationship between parameters; *, significant at p < 0.05, and **, significant at p < 0.01.관계(p<0.01)가 나타나 상관성이 유의함을 알 수 있다.
Gupta and Larson(1979)과 Rawls et al.(1982)이 제 안한 추정식은 미국 토양을 활용하였고, Oliveira et
al.(2002)와 Reichert et al.(2009)이 제안한 추정식은
브라질 토양을 사용하였다. 본 연구에서는 국내 토양 수분관측망 토양 76 점으로 표본수가 작고, 국외 토양 특성과는 차이가 있는바 상관계수가 낮았을 것으로 판 단된다. 하지만 실측값과 추정값 간에 고도의 유의성 이 나타났고, 토양 인자와 토양수분의 상관관계(Table 3)에서 용적밀도를 제외한 모래, 미사, 점토, 유기물함 량과 토양수분이 고도로 유의한 상관성이 있음이 나타 났다. 따라서 조사지점 표본수를 확대하고 토양 인자 의 토양수분 영향지수 등을 평가한다면 국내 실정에 맞는 토양수분 추정식 산정이 가능할 것이다.3.3. 토양 인자와 토양수분의 상관관계
토양수분 함량은 토양입자 비율, 유기물 함량, 용적 밀도 등 토양 특성의 영향을 받으며, 토양수분의 추정 값 산정에 모래, 미사, 점토, 유기물 함량, 용적밀도의 토양 특성 인자가 적용되었다. 따라서 토양 인자와 토 양수분의 상관관계를 조사하는 것은 중요한 의미가 있 다. 토양 인자와 토양수분의 상관분석 결과는 Table 3 에 나타내었다. 모래는 포장용수량 및 위조점과 고 도로 유의한 부의 상관관계(p<0.01)가 나타났으며, 미 사 및 점토는 토양수분(포장용수량, 위조점)과 고도로 유의한 정의 상관관계(p<0.01)를 보였다. 토양 입자 비율에서 모래함량 증가는 토양수분 함량을 낮출 수 있으며, 미사 및 점토는 토양수분을 증대시키는 인자 로 작용한다. 유기물은 포장용수량 실측값과 유의적 상관이 나타나지 않았고, 위조점 실측값과는 유의한 정의상관(p<0.05)을 나타내었다. 유기물과 위조점 GL 추정값은 유의한 정의상관(p<0.05)이 나타났고, 다른 토양수분 추정값과는 고도로 유의한 정의상관 (p<0.01)이 나타났다. 용적밀도와 토양수분은 부의상 관이었으나 상관관계 유의성이 낮은 것으로 나타났으 며, 포장용수량 GL 추정값(p<0.01), 위조점 OL 추정 값 및 포장용수량 RE 추정값(p<0.05)과 관계에서만 유의적 상관이 나타났다.
토양입자 중 점토 및 미사 비율이 높을수록 토양수 분 함량이 높고, 반대로 모래 비율이 높을수록 토양수 분 함량은 낮아진다(Agassi et al., 1994). Seo et
al.(2017)의 연구에서 점토함량이 높은 토양이 보수력
이 높음을 보고하였다. 또한 점토함량이 높은 토양은 용적밀도가 높은 것으로 알려져 있으나(Cho et al., 2016), 본 연구에서는 용적밀도와 토양수분 간 상관관 계 유의성이 낮아 추정식 산정시 고려할 필요가 있을 것이다. 토양유기물은 토양의 수분 보유력 및 흡착력을 증대시켜 토양 중 유효수분을 증대시키는 중요한 역할 을 한다(Maynard, 2000; Minasny and McBratney, 2018). 토양수분 추정식 산정에 모래, 미사, 점토, 유기 물 등 인자를 고려하여야 한다.
적 요
기후변화 대응을 위한 토양수분 관리는 중요한 과 제이며, 최적의 토양수분 함량을 예측할 수 있다면 대 단위 토양수분 정보를 제공할 수 있다. 본 연구에서는 포장용수량 및 위조점의 실측값과 추정값에 대한 상관 관계를 분석하였으며, 토양특성 인자와 토양수분 간 상관성을 조사하였다. 선정된 토양수분관측망 지점은 76 개이며, 모래함량이 높은 사토, 양질사토, 사양토가 77%를 차지하였으며, 유기물은 0.03∼3.50%, 용적밀 도는 1.01∼1.69 Mg m
-3
범위로 조사되었다. 포장용수 량 및 위조점의 추정값은 실측값과 상관계수가 낮고 실측값보다 과소 평가되었으나 추정값과 실측값 간에 는 고도로 유의한 정의상관관계(p<0.01)가 나타났다.토양수분(포장용수량 및 위조점)은 미사, 점토, 유기물 과는 고도로 유의한 정의상관(p<0.01)이었으며, 모래 와는 고도로 유의한 부의상관(p<0.01)이었다. 하지만 본 연구에서 조사된 토양수분관측망 토양은 농업기상 대 설치를 위하여 인위적으로 조성된 지점이 포함되어 있어 일반농경지 토양 특성을 그대로 반영하기 다소 어려움이 있다. 따라서 토양수분 측정 조사지점을 농 경지까지 포함하여 표본수를 확대하고 토양 인자를 적 절하게 활용할 경우 국내 실정에 맞는 토양수분 추정 식을 도출할 수 있을 것으로 기대된다.
감사의 글
This work was supported by the “Cooperative Research Program for Agriculture Science &
Technology Development (Project No. PJ01351201)”, Rural Development Administration, Republic of Korea.
REFERENCES
Agassi, M., D. Bloem, and M. Ben-Hur, 1994: Effect of drop energy and soil and water chemistry on infiltration and erosion. Water Resource Research
30(4), 1187-1193.
Assouline, S., 2006: Modeling the relationship between soil bulk density and the hydraulic conductivity function. Vadose Zone Journal 5(2), 697-705.
Blake, G. R., and K. H. Hartge, 1986: Bulk density.
Methods of soil analysis. Part 1. (2nd edition), A.
Klute (Ed.), American Society of Agronomy, Madison, WI, USA, 363–375.
Cho, H. R., K. H. Han, Y. S. Zhang, K. H. Jung, Y.
K. Sonn, M. S. Kim, and S. E. Choi, 2016:
Threshold subsoil bulk density for optimal soil physical quality in upland: Inferred through parameter interactions and crop growth inhibition.
Korean Journal of Soil Science and Fertilizer 49(5),
548-554.Cho, H. R., Y. S. Zhang, K. H. Han, J. H. Ok, S. A.
Hwang, H. S. Lee, and D. J. Kim, 2018: Decadal changes in subsoil physical properties as affected by agricultural land use types in Korea. Korean
Journal of Environmental Biology 36(4), 567-575.
Durner, W., 1994: Hydraulic conductivity estimation for soils with heterogeneous pore structure. Water
Resource Research 30(2), 211-223.
Gee, G. W., and J. W. Bauder, 1986: Particle size analysis. Method of soil analysis. Part 1. (2nd edition), A. Klute (Ed.), American Society of Agronomy, Madison, WI, USA, 383-411.
Grewal, K. S., G. D. Buchan, and P. J. Tonkin, 1990:
Estimating of field capacity and wilting point of some New Zealand soils from their saturation percentage. New Zealand Journal of Crop and
Horticultural Science 18, 241-246.
Gupta, S. C., and W. E. Larson, 1979: Estimating soil water retention characteristics from particle size distribution, organic matter percent, and bulk density.
Water Resources Research 15(6),
1633-1635.Hanjra, M. A., and M. E. Qureshi, 2010: Global water crisis and future food security in an era of climate change. Food Policy 35, 365-377.
Hur, S. O., Y. G. Sonn, B. K. Hyun, K. S. Shin, T.
K. Oh, and J. G. Kim, 2014: Verification on PTE (Pedo-Transfer Function) estimating soil water retention based on soil properties. CNU Journal of
Agricultural Science 41(4), 393-400.
Jung, Y. S., H. D. Sa, S. Kang, S. B. Oh, and J. S.
Lee, 2015: Soil water characteristic curve using volumetric pressure plate extractor incorporated with TDR system. Journal of the Korean Geotechnical
Society 31(8), 17-28.
Kim, D. J., K. H. Han, Y. S. Zhang, H. R. Cho, S. A.
Hwang, J. H. Ok, K. S. Choi, and J. S. Choi, 2018:
Evaluation of evapotranspiration in different paddy soils using weighable lysimeter before flooding stage. Korean Journal of Soil Science and Fertilizer
51(4), 510-521.
Maynard, A. A., 2000: Compost: The process and research. Bulletin-Connecticut Agricultural Experiment Station No 966. Conecticut Agricultural
Experiment Station, New Haven, CT.
Minasny, B., and A. B. McBratney, 2018: Limited effect of organic matter on soil available water capacity. European Journal of Soil Science 69, 39-47.
MOLIT, 2011: Water resource long-term plan (2011∼
2020). Ministry of Land, Infrastructure and Transport, Gwacheon, Korea.
NAAS, 2010: Methods of soil chemical analysis.
National Academy of Agricultural Sciences, RDA, Suwon, Korea, 51-60.
NIAS, 2017: Methods of soil physical analysis.
National Institute of Agricultural Sciences, RDA, Wanju, Korea, 53-57.
Ok, J. H., K. H. Han, Y. J. Lee, Y. S. Zhang, H. R.
Cho, S. A. Hwang, S. S. Kim, J. H. Lee, and D. J.
Kim, 2018: Water balance for Chinese cabbage in spring season with different upland soils evaluated using weighable lysimeters. Korean Journal of Soil
Science and Fertilizer 51(4), 555-563.
Oliveira, L. B., M. R. Riveiro, P. K. T. Jacomine, J. J.
V. Rodrigues, and F. A. Marques, 2002: Funções de pedotransferência para predição da umidade retida a potenciais específicos em solos do Estado de Pernambuco. Revista Brasileira de Ciência do
Solo 26(26), 315-323 (in Brazilian with English
abstract).Rawls, W. J., D. L. Brakensiek, and K. E. Saxton, 1982: Estimation of soil water properties.
Transactions of the American Society Agricultural Engineers 25(5), 1316-1320.
Reichert, J. M., J. A. Albuquerque, D. R. Kaiser, D. J.
Reinert, F. L. Urach, and R. Carlesso, 2009.
Estimation of water retention and availability in soils of Rio Grande do Sul. Revista Brasileira de
Ciência do Solo 33, 1547-1560.
Saccon, P., 2018: Water for agriculture, irrigation
management. Applied Soil Ecology 123, 793-796.
Seo, M. C., S. O. Hur, Y. K. Sonn, H. S. Cho, W. T.
Jeon, M. K. Kim, and M. T. Kim, 2012: The development of estimation model (AFKAE0.5) for water balance and soil water content using daily weather data. Korean Journal of Soil Science and
Fertilizer 45(6), 1203-1210.
Seo, M. J., K. H. Han, H. R. Cho, J. H. Ok, Y. S.
Zhang, Y. H. Seo, K. H. Jung, H. S. Lee, and G.
S. Kim, 2017: Interpreting in situ soil water characteristics curve under different paddy soil types using undisturbed lysimeter with soil sensor.
Korean Journal of Soil Science and Fertilizer 50(5),
336-344.Wang, L., and J. J. Qu, 2009: Satellite remote sensing applications for surface soil moisture monitoring: A review. Frontiers of Earth Science in China 3(2), 237-247.