RGB 컬러 이미지를 이용한 콩의 군락 피복과 엽면적에 대한 저비용 평가
이윤호⋅상완규⋅백재경⋅김준환⋅조정일⋅서명철*2) 농촌진흥청 국립식량과학원 작물재배생리과
(2020년 2월 17일 접수; 2020년 3월 5일 수정; 2020년 3월 9일 수락)
Low-cost Assessment of Canopy Light Interception and Leaf Area in Soybean Canopy Cover using RGB Color Images
Yun-Ho Lee, Wan-Gyu Sang, Jae-Kyeong Baek, Jun-Hwan Kim, Jung-Il Cho, Myung-Chul Seo
*Crop Physiology and Production, National Institute of Crop Science,
Rural Development Administration, 181, Hyeoksin-ro, Iseo-myeon, Wanju-gun, Jeollabuk-do 55365, Republic of Korea
(Received February 17, 2020; Revised March 5, 2020; Accepted March 9, 2020)ABSTRACT
This study compared RGB color images with canopy light interception (LI) and leaf area index (LAI) measurements for low cost and low labor. LAI and LI were measured from vertical gap fraction derived from top of digital image in soybean canopy cover (cv Daewonkong, Deapongkong and Pungsannamulkong). RGB color images, LAI, and LI were collected from V4.5 stage to R5stage. Image segmentation was based on excess green minus excess red index (ExG-ExR). There was a linear relationship between LAI measured with LI (r
2=0.84). There was alinear relation ship between LI measured with canopy cover on image (CCI) (r
2=0.94).
There was a significant positive relationship(r
2=0.74) between LAI and CCI at all grow ingseason. Therefore, it is expected that in the future, the RGB color image could be able to easily measure the LAI and the LI at low cost and low labor.
Key words: Soybean, RGB color image, Leaf area, Canopy cover light interception, ExGR
I. 서 언
과학기술의 발달로 직접 작물에 접촉하지 않고 작 물에 대한 생육 진단 정보를 수치와 영상으로 취급할 수 있는 다양한 기법이 개발되고 있다. 그 중 다중분광, 초분광, 열 적외선 카메라 및 RGB 카메라와 같은 광학 센서를 이용하여 작물 생육 모니터링 기술이 개발되고 있다(Li et al., 2014; Anderson, 2016; Araus et al.,
2018). 특히 다중분광, 초분광, 열 적외선 센서는 눈으 로 보고 판단할 수 없는 각각의 파장에 대한 정보를 영상으로 취득하여 넓은 범위의 식생을 모니터링할 수 있는 큰 장점을 가지고 있다(Li et al., 2014; Araus
et al., 2018). 그러나 취득한 자료를 활용하기 위해서
는 다양한 환경조건에 따라 피사체에 대한 분광 반사 특성을 확보해야 하는 단점을 가지고 있다. 또한 공간 해상도가 높을수록 많은 비용이 발생하기 때문에 농가* Corresponding Author : Myung-Chul Seo ([email protected])
DOI: 10.5532/KJAFM.2020.22.1.13
ⓒ Author(s) 2020. CC Attribution 3.0 License.
에서 직접 자기 포장을 진단하기에는 어려운 점이 있다. 작물 생육 진단에 있어서 엽면적과 군락 피복에 의 한 빛의 차단은 작물 생육 진단 지표로 매우 중요하게 이용되고 있다(Shiraiwa et al., 2011; Tagliapietra et
al., 2018). 일반적으로 작물은 생육 초기에 엽면적의
수광량이 적지만 생육이 진행되면서 엽면적은 커지고 수광량이 높아진다. 그러나 개화를 하면 엽면적의 발 달은 정지가 된다. 따라서 개화 이전에 충분한 광합성 을 확보하여 최대 엽면적을 극대화하는 것이 필수적이 다. 그러나 포장내에서 직접 엽면적과 군락 피복 측정 은 시간과 노력 및 경제적 비용 등이 많이 소요되는 단점을 가지고 있다.현재까지 포장내에서 엽면적과 군락 피복 측정 방 법은 Plant canopy analyzer와 Line quantum sensor로 이용되고 있다(Purcell, 2000; Park et al., 2004; Bruin and Pedersen, 2009; Garcia et al., 2012; Jovanovic and Annandale et al., 2013). 이러한 센서는 광 조건에 따 라 시간적인 제약을 받는다. Plant canopy analyzer의 경 우 이른 아침 또는 흐른 날에 측정을 한다(Garcia et al., 2012). 반면 Line quantum sensor는 태양에서 가장 근 접한 시간인 오전 11:00에서 정오 12:00 사이에 측정을 한다(Shepherd et al., 2018). 이러한 결과 일부 연구에 서 RGB 컬러 이미지로 Plant canopy analyzer와 Line quantum sensor를 대신하여 비 접촉 방법으로 엽면적 과 군락 피복을 측정하였다(Nasirzadehdizaji et al., 2019).
일반적으로 군락에서 획득한 RGB 컬러 이미지 분 석 방법은 Adobe Photoshop과 Sigma Scan을 사용하 여 토양(배경)과 식물(녹색)을 분리하여 각각의 픽셀 값을 계산하는 방법이다(Stewart et al., 2007). RGB 컬러 이미지의 색상은 0-255 범위로 표현된다(Gée et
al., 2008). 일부 연구에 의해 RGB 컬러 이미지 지수가
제안되면서부터 보다 정확하게 토양으로부터 녹색 영 역을 분리할 수 있는 분석 기술이 개발되었다(Mao etal., 2003; Perez et al., 2000; Yang et al., 2015;
Hamuda et al., 2016; Netto et al., 2018). 대표적인 RGB 컬러 이미지 지수들로는 토양으로부터 식물의 녹 색영역을 분리하는 색정규화지수(Normalized difference index: NDI) 가 Wobbecke et al.(1993)에 의해 제안되 었다. 이후 Wobbecke et al.(1995)에 의해 색좌표를 응용하여 토양으로 녹색 영역을 분리할 수 있는 초과 녹색지수(Excess greenness index: ExG) 가 제안되었 다. Meyer et al.(1998) 에 의해 토양과 식물체의 녹색 영역에서 빨간색을 뺀 초과빨간지수(Excess red index:
ExR) 가 제안되었지만, 녹색 영역 추출에 있어서 ExG 보다는 정확성이 떨어진다. 또한 배경으로부터 녹색 영역을 분리하여 정규화녹색지수(Normalized green minus red difference index: NGRDI)가 제안되었다 (Perez et al., 2000; Gitelson et al., 2002). 그리고 ExG 와 ExR 지수를 보다 효과적으로 배경과 토양으로부터 녹색 영역만을 분리할 수 있는 녹색 지수에서 빨간색 지수를 뺀 지수(Excess green-Excess red: ExGR) 가 Meyer and Neto(2008)에 제안되었다.
이러한 기술을 바탕으로 최근 Matlab 프로그램으로 Canopeo라는 소프트웨어가 개발되었다(http://canopeoapp.
com/). 이 소프트웨어는 초과녹색지수(2g–r–b)의 색상 비율을 기반으로 되어 있다(Patrignani and Ochener, 2015). 그러나 Matlab 같은 프로그램은 유료로서 일반 인이 사용하기에는 많은 비용이 발생할 수 있다. 한편, 일부 연구에서는 소프트웨어의 개발 비용 절감을 위해 Python으로 RGB 컬러 이미지 지수를 활용하여 분석 을 하고 있다(Easlon et al., 2014).
따라서 본 연구는 포장에서 RGB 컬러 이미지로 저 비용ㆍ저 노동력으로 생육 진단을 위해 수행하였다.
또한 대표적인 RGB 컬러 이미지 지수인 ExGR을 사 용하여 군락 엽면적과 군락 피복 측정을 평가하는 동 시에 향후 농가에서 손쉽게 자가 생육 진단을 하기 위한 기초 자료로 활용하고자 수행하였다.
II. 재료 및 방법
2.1. 작물재배
본 연구는 2019년 전라북도 완주군 이서면에 위치 한 국립식량과학원(35° 84’ 34" N, 127° 04’ 84" E)에 서 수행하였다. 시험 품종은 국내에서 가장 많이 재배 되고 있는 대원콩, 대풍콩, 풍산나물콩으로 하였다. 모 래 37.1%와 실트 35.7% 및 점토 27.2%로 구성된 사양 에서 6월 24일에 주당 2립씩 파종을 하였다. 재식 간격 은 60cm×15cm로 하였다. 시비량은 N-P2O5-K2O를 10a당 3.0-3.0-3.4kg을 파종전에 전량 시비하였다. 관 수는 점적 호스로 주 2-3회 공급하였다.
2.2. 군락 엽면적과 피복 측정
군락 엽면적과 피복 측정은 엽의 4.5엽기(7월 20일) 부터 종실비대(8월20일)기까지 품종당 주 3회씩 총 12 회를 하였다. 군락 엽면적은 Plant canopy analyzer (LAI-2000, LI-COR Biosciences Inc., NE, USA)로
측정을 하였다. 측정방법은 동이 뜰 무렵(06:10-06:40) 에 군락 상부의 입사 광을 1회 측정한 다음 군락 하부 투광 량을 4회 측정하여 1반복으로 하였다. 모든 측정 시기에 Plant canopy analyzer는 90°를 유지하면서 품 종당 5반복으로 측정하였다.
가장 일반적으로 군락 피복에 의해 광 차단된 방사 선 율을 측정 방법은 라인 퀀텀 센서(LI-191R, LI- COR Biosciences Inc., NE, USA)와 LI-250A light meter(LI-COR Biosciences Inc., NE, USA)으로 사용 하였다. 측정 시간은 태양 광이 가장 근접한 오전 11시 에서 11시 40분 사이에 하였다. 측정 방법은 군락 상부 의 입사 광을 1회 측정한 다음 군락 하부 투광 량을 4회 측정하여 1반복으로 하였다. 품종당 5번으로 하였 다. 측정된 군락 피복(Canopy Cover Light Interception:
LI) 계산은 다음과 같다(Purcell et al., 2002; Shepherd
et al., 2018).
(Eq. 1)
여기서 PAR below는 군락 하부의 광합성유효방사 (umol s-1m-2)이고 PAR above는 군락 상부의 광합성 유효방사(umol s-1m-2)이다.
2.3. RGB 이미지 획득
RGB 이미지의 획득은 군락 엽면적과 군락 피복 측 정 일과 동일한 날에 수행하였다. RGB 카메라(Canon, PowershotN2, Osaka, Japan)를 약 2.0m 높이에서 수 평 구조로 품종 당 3회씩 촬영하였다. 카메라 렌즈 크 기는 5.0-4.0mm이고, 픽셀은 4608 × 3456으로 색대 표는 sRGB이었다. 카메라에서 획득한 이미지는 JPG 로 저장되었다. 이미지의 화이트 밸런스는 자동을 설 정하였으며, 카메라의 노출은 ISO 200이었고 조리개 값은 f/3에 셔터속도는 1/60초로 하였다.
2.4. RGB 컬러 이미지 분석
획득한 RGB 이미지 분석을 위해 Pyhton3.8(www.
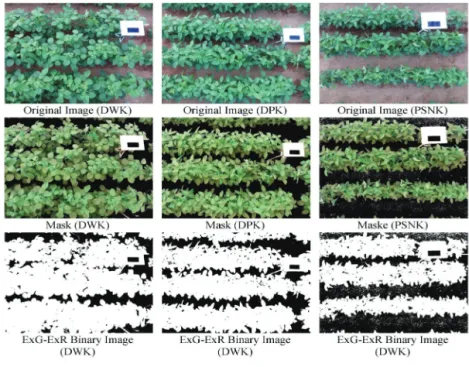
pyton.org)을 설치하였다. Pyhton에서 RGB 컬러 이미 지 분석을 위해 cv2, numpy, os 및 tkinter, matplotlib 등 오픈소스를 설치하였다. 분석 방법은 Fig. 1과 같이 Pyhton에서 획득한 RGB 원본 이미지를 열어서 관심 영역(region of interest: ROI)을 정해 해당 영역에만 이미지를 보이게 하고 나머지 부분은 감춰지도록 Mask를 사용하였다. ROI 영역에 임계 값[0과 1]을 주 어 이진화 하였다(Otsu, 1979).
그리고 Table 1에서 나온 RGB 컬러 이미지 지수 중 배경과 토양으로부터 식물체의 녹색 영역을 잘 분
Fig. 1. Original and mask using the ExG-ExR binary image for soybean
Daewonkong: DWK, Deapongkong: DPK, Pungsannamulkong: PSNK.리할 수 있는 ExGR을 사용하였다. 배경과 토양으로부 터 분리된 녹색 영역에 대한 픽셀 값은 엑셀로 자동 저장되었다.
분리된 이미지는 PNG (Portable Network Graphics) 파일로 저장되었다. ExG로부터 분리한 녹색 영역에 대한 군락 피폭 이미지(Canopy Cover on Image)계산 은 다음과 같다(Geé et al., 2008).
(Eq. 2)
여기서 Number of green leaf pixels은 ExGR로 분리 한 녹색 영역의 픽셀 값이고, Number of background pixels은 토양과 녹색 영역의 전체 픽셀 값이다.
III. 결 과
3.1. 군락 엽면적과 군락 피복관계
실제 측정한 군락 엽면적과 군락 피복과의 상관관 계를 알기 위하여 대원콩, 대풍콩 및 풍산나물콩에서 엽의 4.5엽기부터 종실비대기까지에 대한 결과는 Fig. 2 와 같다. 대원콩, 대풍콩 및 풍산나물콩의 군락 엽면적 RGB vegetation indices Abbreviation Equation
Normalized difference index NDI (g−r)/(g+r), Woebbecke et al., 1992 Excess green index ExG 2g-r-b, Woebbecke et al., 1995
Excess red index ExR 1.4r-g, Meyer et al., 1999 Excess green minus excess red index ExG-ExR 3g−2.4r−b, Meyer and Neto, 2008 Normalized green minus red difference index NGRDI (G-R)/(G+R), Gitelson et al., 2002
Green leaf index GLI (2g−b−r)/(2g+b+r), Louhaichi et al., 2001 Colorur index of vegetation Extraction CIVE 0.441r-0.811g+0.385b+18.78745, Katatoka et al., 2003 R=red, G=green, B=blue.
Table 1. Common color vegetation indices based on RGB images
Fig. 2. Relationship between LAI and canopy cover
light interceptionDaewonkong: DWK, Deapongkong: DPK, Pungsannamulkong: PSNK.
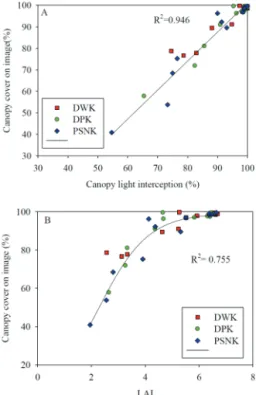
Fig. 3. (A) Relationship between canopy cover light
interception and canopy cover on image and (B) LAI and canopy cover image.Daewonkong: DWK, Deapongkong: DPK, Pungsannamulkong: PSNK.
과 군락 피복은 정의상관관계(r2=0.86)를 보였다. 풍산 나물콩은 대원콩과 대풍콩에 비하여 생육 초기 군락 엽면적과 군락 피복이 낮았으나, 개화기에는 모든 품 종의 군락 피복이 90% 이상이었다. 종실비대기의 엽 면적은 품종에 따라 차이를 보였지만 6.0-6.5 사이였 다. 본 연구 결과에서 알 수 있듯이 개화기 이후 엽면 적의 증가는 보이지 않았다.
3.2. RGB 컬러 이미지와 군락 엽면적 및 군락
피복관계대원콩, 대풍콩 및 풍산나물콩에서 엽의 4.5엽기부 터 종실비대기까지의 실측한 군락 피복, 군락 엽면적 그리고 ExGR로 분리한 군락 피복 이미지 값에 대한 결과는 Fig. 3과 같다. 군락 피복 이미지와 실측한 군 락 피복과는 고도의 정의상관관계(r2=0.94)를 보였다 (Fig. 3A). 그리고 군락 피복 이미지와 실측한 군락 엽면적과는 상관관계(r2=0.75)를 보였다(Fig. 3B).
연구 결과 ExGR로 분리한 군락 피복 이미지 값은 실 측한 군락 피복과 군락 엽면적과는 정의상관관계를 보 였다.
IV. 고 찰
본 연구는 ExGR을 사용하여 녹색 영역에 대한 픽 셀 값과 실측한 군락 엽면적과 군락 피복 값을 비교한 연구 결과이다. 본 연구 결과 콩의 개화기에는 군락 피복이 90% 이상이라는 보고와 일치하였으며(Setiyono
et al., 2008; Tagliapietra et al., 2018), 종실비대기의
엽면적은 6.0에서 6.5사이가 최대 엽면적이라는 결과 와 일치하는 경향을 보였다(Setiyono et al., 2008;Richter et al., 2014; Tagliapietra et al., 2018).
본 연구 결과 획득한 RGB 컬러 이미지를 ExGR를 사용하여 토양으로부터 녹색영역은 잘 분리가 되었다 (Fig. 1). 또한 ExGR로 분리한 군락 이미지와 실측한 군락 피복과 군락 엽면적은 고도의 정의상관관계를 보 였다(Fig 3). 일부 연구의 결과에 따르면 면화의 군락 조건에서 RGB 컬러 이미지를 획득하여 Adobe Photoshop으로 분석 값과 실측한 군락 엽면적과는 정 의상관관계(r2=0.74)를 보였다(Stewart, 2007). 콩과 면화를 SigmaScan을 사용하여 피복 이미와 실측한 군 락 피복과는 고도의 정의상관관계(r2=0.93-0.97)를 보 였다(Purcell, 2000; Gonias et al., 2012). 콩, 옥수수,
수수 및 잔디에서 획득한 RGB 컬러 이미지를 2g-r-b 로 분리하여 분석한 값과 실측한 군락 피복간에 고도 의상관관계(r2=0.84)를 보였다(Patrignani and Ochener, 2015). 최근 콩 군락 조건에서 2엽기부터 종실비대기 까지 RGB 컬러 이미지 피복과 실측한 군락 피복을 측정한 결과 고도의 정의상관관계(r2=0.94)를 보였다 (Shepherd et al., 2018). 일부 연구에서 ExGR로 군락 엽면적과 분석한 결과 정의상관관계(r2=0.83)를 보였 다(Lui and Pattey, 2010; Das et al., 2016).
기존 연구결과를 종합해 보았을 때 본 연구의 RGB 컬러 이미지를 이용하여 비 접촉 방법으로 군락 엽면 적과 피복 측정 방법이 가능할 것으로 판단되었다. 한 편 일부 연구에서는 자연광 조건에서 피사체로부터 반 사된 광에 대해 문제점을 제시하였다. 그러나 본 연구 에서는 open cv2에서 Gaussianblur필터를 주어 피사 체로부터 반사되는 광에 대한 노이즈를 다소 제거하여 보다 정확하게 이미지 분석을 할 수 있었다. 향후 다양 한 환경조건에서 RGB 컬러 이미지 획득과 양질의 정 보를 확보한다면 저비용⋅저 노동력으로 군락 엽면적 과 군락 피복을 손쉽게 측정할 것으로 기대된다.
적 요
본 연구는 저비용⋅저 노동력을 위해 RGB 컬러 이 미지에서 획득한 녹색영역 값과 엽면적 그리고 군락 피복 측정을 비교하였다. 시험에 사용된 품종은 국내 에서 가장 많이 재배되고 있는 대원콩, 대풍콩 및 풍산 나물콩을 재배하였다. 측정 시기는 엽의 4.5엽기부터 종실비대기까지 RGB 컬러 이미지를 획득하여 군락 엽면적과 피복을 비교하였다. 이미지 분석은 ExGR로 토양으로부터 식물체의 녹색 영역을 분리하였다. 분리 한 녹색 영역과 실제 측정한 엽면적과 피복과는 고도 의 유의성을 보였다. 본 연구 결과에서 알 수 있듯이 실제 측정한 군락 엽면적과 군락 피복과는 정의 상관 관계(r2=0.84)를 보였다. 군락 이미지와 실제 측정한 군락 피복과는 고도의 정의상관관계(r2=0.94)를 보였 다. 또한 군락 이미지와 실제 측정한 군락 엽면적과는 고도의 정의상관관계(r2=0.74)를 보였다. 따라서 향후 RGB 컬러 이미지로 저비용⋅저 노동력으로 군락 단 위에서 엽면적과 피복을 손쉽게 측정할 수 있을 것으 로 기대된다.
감사의 글
본 연구는 농촌진흥청 작물시험연구사업(과제 번 호: PJ013521032020)의 지원에 의해 수행되었다.
REFERENCES
Anderson, H. B., H. Nilsen, H, Tommervik, S. R.
Karlsen, S. Nagai, and E. J. Cooper, 2016: Using ordinary digital cameras in place of near-infrared sensors to derive vegetation indices for phenology studies of high arctic vegetation. Remote Sensing
8, 847pp.
Araus, J. L., S. C. Kefauver, M. Z. Allah, M. S.
Olsen, and J. E. Cairns, 2018: Translating high- throughput phenotyping into genetic gain. Trends
in Plant Science 23, 451-466.
Bruin, J. L. D., and P. Pedersen, 2009: New and old soybean cultivar responses to plant density and intercepted light. Crop Science 49(6), 2225-2232.
Das, B., R. N. Sahoo, S. Pargal, G. Krishna, V. K.
Gupta, R. Verma, and C. Viswanathan, 2016: Measuring leaf index from color digital image of wheat crop.
Journal of Agrometeorology 18(1), 22-28.
Easlon, H. M., and A. J. Bloom, 2014: Easy Leaf Area: Automated digital image analysis for rapid and accurate measurement. Applications in Plant
Science. doi: 10.3732/apps.1400033
Garcia, J. R., P. Almendros, and M. Quemada, 2012:
Ground cover and leaf area index relationship in grass, legume and crucifer crop. Plant Soil Environment
50(8), 385-390.
Gée, C. H., and J. Bossu, 2008: Crop/weed discrimination in perspective agronomic images. Computers and
Electronic in Agriculture 60(1), 49-59.
Gitelsona, A. A., Y. J. Kaufmanb, R. Starkc, and D.
Rundquista, 2002: Novel algorithms for remote estimation of vegetation fraction. Remote Sensing
of Environment 80, 76–87.
Gonia, E. D., D. M. Oosterhuis, A. C. Bibi, and L.
C. Purcell, 2012: Estimating light interception by cotton using a digital imaging technique. American
Journal of Experimental Agriculture 2(1), 1-8.
Hamuda, E., M. Glavin, and E. Jones. 2016: A survey of image processing techniques for plant extraction and segmentation in the field. Computers
and Electronic in Agriculture 125, 184-199.
Jovanovic, N. Z., and G. Annandale, 1998: Measurement of radiant interception of crop canopies with the
LAI-2000 plant canopy analyzer. South African
Journal of Plant and Soil 15(1), 6-13.
Kataoka, T., T. Kaneko, H. Okamoto, and S. Hata, 2003: Crop growth estimation system using machine vision. In Proceedings 2003 IEEE/ASME International
Conference on Advanced Intelligent Mechatronics (AIM 2003).
Li, L., Q, Zhabg, and D. Huang, 2014: A review of imaging techniques for plant phenotyping. Sensors
14, 20078-20111.
Liu, J., and E. Pattey, 2010: Retrieval of leaf area index from top-of canopy digital photography over agricultural crops. Agricultural and Forest Meteorology
150(11), 1485-1490.
Louhaichi, M., M. M. Borman, and D. E. Johnson, 2001: Spatially located platform and aerial photography for documentation of grazing impacts on wheat.
Geocarto International 16, 65-70.
Mao, W., Y. Wang, and Y. Wang, 2003: Real-time detection of between-row weeds using machine vision.
Written for presentation at the 2003 ASAE Annual International Meeting Sponsored by ASAE Riviera Hotel and Convention Center Las Vegas, Nevada, USA 27-30 July 2003 Paper Number 031004.
Meyer, G. E., T. W. Hindman, and K. Lakshmi, 1999:
Machine vison detection parameters for plant species identification. Meyer, G. E., J. A. De Shazer (Eds), Precision Agriculture and Biological Quality,
Proceeding of SPIE Vol 3543, 327-335.
Meyer, G. E., and J. C. Neto, 2008: Verification of color vegetation indices for automated crop imaging applications. Computers and Electronic in Agriculture
63(2), 282-293.
Nasirzadehdizaji, R., F. B. Sanli, S. Abdikan, Z. Cakir, A. Sekertekin, and M. Ustuner, 2019: Sensitivity analysis of multi-temporal sentinel-1 SAR parameters to crop height and canopy coverage. Applied Science 9, 655pp.
Neeto, A. F. A., R. N. Martins, G. S. A. Souza, G.
M. Araujo, S. L. H. Almeida, and V. A. Capelini, 2018: Segmentation of RGB images using different vegetation indices and thresholding methods. Nativa
Sinop 6(4), 389-394.
Otus, N., 1979: A threshold selection method from gray-level histogram. IEEE transactions on Systems,
Man, and Cybernetics 9, 62-66.
Park, H. K., W. Y. Choi, N. H. Back, S. S. Kim, B. K. Kim, and K. K. Kim, 2004: Estimation of leaf area index by plant canopy analyzer in rice.
Korean Journal of Crop Science 49(6), 463-467.
Patrignani, A., and T. E. Ochsner, 2015: Canopeo A powerful new tool for measuring fractional green
canopy cover. Agronomy Journal 107(6), 2312-2320.
Perez, A. J., F. Lopez, J. V. Benlloch, and S.
Christensen, 2000: Color and shape analysis techniques for weed detection in cereal fields. Computers and
Electronic in Agriculture 25(3), 197-212.
Purcell, L. C., 2000: Soybean canopy coverage and light interception measurements using digital imagery.
Crop Science 40(3), 834-837.
Richter, G. L., A. J. Zanon, N. A. Streck, J. V. C.
Guedes, B. Kraulich, T. S. M. D Rocha, J. E. M.
Winck, and J. C. Cera, 2014: Estimating leaf area of modern soybean cultivars by a non-destructive method. Crop Production and Management 73(4), 416-425.
Setiyono, T. D., A. Weiss, J. E. Specht, K. G.
Cassman, and A. Dobermann, 2008: Leaf area index simulation in soybean grown udder near- optimal conditions. Field Crops Research 108(1), 82-92.
Shepherd, M. J., L. E. Lindey, and A. J. Lindsey, 2018: Soybean canopy cover measured with Canopeo compared with light interception. Agricultural &
Environmental Letters 3(1), 1-3.
Shiraiw, T., Y. Kawasaki, and K. Homma, 2011:
Estimation of crop radiation use efficiency. Japanese
Journal of Crop Science 80(3), 360-364.
Stewart, A. M., 2007: Measuring canopy coverage with digital imaging. Communication in Soil Science
and Plant Analysis 38, 895-902.
Tagliapietra, E. L., N. A. Streck, T. S. M. Rocha, G. L. Richter, M. R. Silva, J. C. Cera, J. V. C.
G. Guedes, and A. J. Zanon, 2018: Optimum leaf area index to reach soybean yield potential in subtropical environment. Agronomy Journal 1109(3), 932-938.
Woebbecke, D., G. M. Meyer, K. Von, and D.
Mortensen, 1993: Plant species identification, size, and enumeration using machine vision techniques on near-binary images, in SPIE Conference on Optics in Agriculture and Forestry, Boston, USA, 208-219.
Woebbecke, D. M., G. M. Meyer, K. V. Bargen, and D. A. Mortensen, 1995: Color indices for weed identification under various soil, residue, and lighting conditions. Transaction of the American
Society of Agricultural and Biological Engineers 38(1), 259-269.
Yang, W., S. Wang, X. Zhao, J. Zhang, and J.
Feng, 2015: Greenness identification based on HSV decision tree. Information Processing in Agriculture