논 문
* 강원대학교 농업생명과학대학 ([email protected])
** 강원대학교 농업생명과학대학 ([email protected])
*** 농촌진흥청 고령지 농업연구소 ([email protected])
**** 강원대학교 농업생명과학대학교수 ([email protected])
***** 강원대학교 농업생명과학대학교수 ([email protected])
키워드 : SWAT, HRU, 수질, 유출량, 유사량
소유역구분이 SWAT 예측치에 미치는 영향 평가
Effects of Subwatershed Delineation on SWAT Estimation
Abstract
The Soil and Water Assessment Tool (SWAT) model has been widely used in hydrology and sediment simulation worldwide. In most cases, the SWAT model is first calibrated with adjustments in model parameters, and then the validation is performed. However, very little study regarding the effects on SWAT estimation of subwatershed delineation was performed. Thus, the SWAT model was applied to the Doam-dam watershed with various threshold values in subwatershed delineation in this study to examine the effects of the number of subwatershed delineated on SWAT estimation. It was found the flow effect of subwatershed delineation is negligible. However there were huge variations in SWAT estimated sediment, T-N, and T-P values with the use of various threshold value in watershed delineation. Sometimes these variations due to watershed delineation are beyond the effects of parameter adjustment in model calibration and validation. The SWAT is a semi-distributed modeling system, thus, the subwatershed characteristics are assumed to be the same for all Hydrologic Response Unit (HRU) within that subwatershed. This assumption leads to variations in the SWAT estimated sediment and nutrient output values. Therefore, it is strongly recommended the SWAT users need to use the HUR specific slope length and slope value in model runs, instead of using the slope and the corresponding slope length of the subwatershed to exclude the effects of the number of subwatershed delineated on the SWAT estimation.
한국관개배수 제13권 제2호
KCID J. VOL. 13, No.2 (2006. 12) pp.74-85
Heo, Sung-Gu∙Kim, Ki-Sung∙Ahn, Jae-Hun
Lim, Kyoung Jae ∙ Choi, Joong Dae 안 재 훈***
김 기 성**
최 중 대*****
임 경 재****
허 성 구*
Ⅰ. 서 론
Ⅱ. 연구지역 선정 및 분석방법
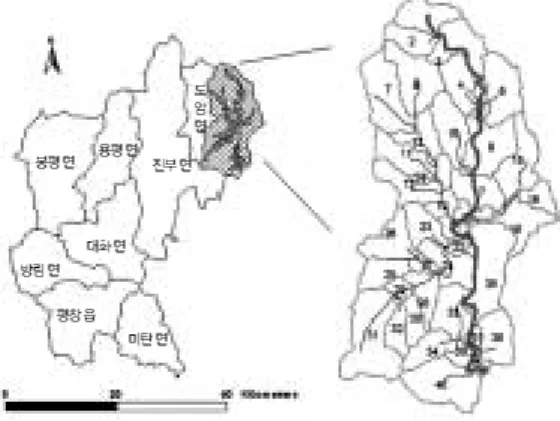
Fig. 1. Study watershed - Doam-dam watershed at Pyoeng-chang, kangwon
Fig. 2. Monthly precipitation and temperature at Doam-dam watershed
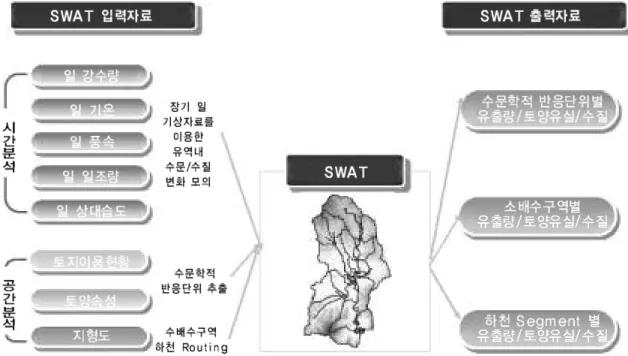
Fig. 3. Overview of the SWAT - Model input/output (허 , 2006)
Fig. 4. Land use at Doam-dam watershed
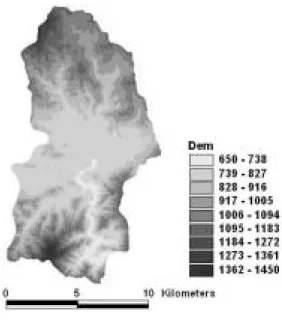
Fig. 5. Soil map at Doam-dam watershed Fig. 6. Digital elevation model (DEM) at Doam-dam watershed
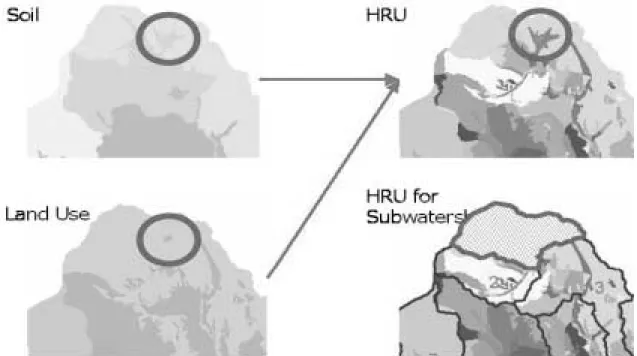
Fig. 7. Hydrological response Unit (HRU) in SWAT
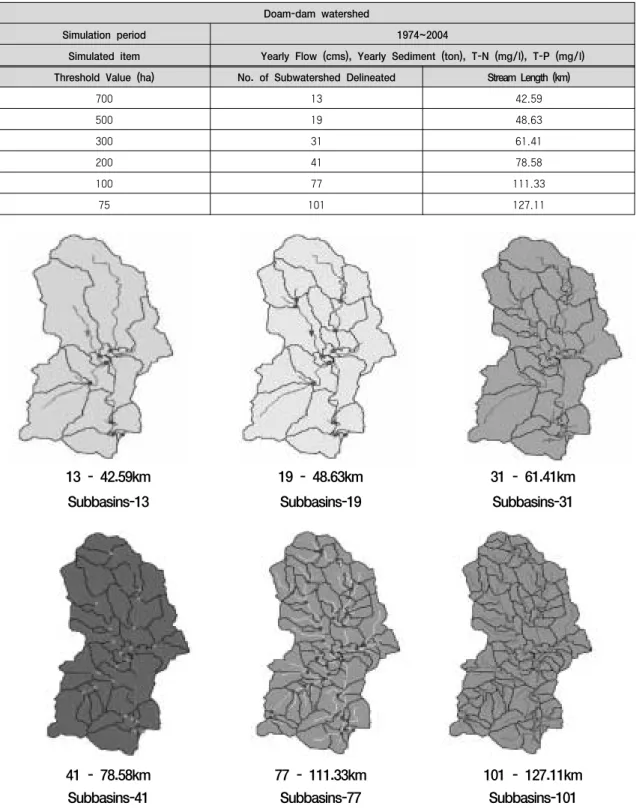
Fig. 8. Subwatershed delineation at the Doam-dam watershed with various threshold value Table 1. Details of SWAT simulation at the Doam-dam watershed to investigate the effects on SWAT
estimation of subwatershed delineation
Doam-dam watershed
Simulation period 1974~2004
Simulated item
Threshold Value (ha) No. of Subwatershed Delineated Stream Length (km)
700 13 42.59
500 19 48.63
300 31 61.41
200 41 78.58
100 77 111.33
75 101 127.11
Yearly Flow (cms), Yearly Sediment (ton), T-N (mg/l), T-P (mg/l)
Subbasins-13 Subbasins-19 Subbasins-31
Subbasins-41 Subbasins-77 Subbasins-101
13 - 42.59km 19 - 48.63km 31 - 61.41km
41 - 78.58km 77 - 111.33km 101 - 127.11km
Ⅲ. 결과 및 고찰
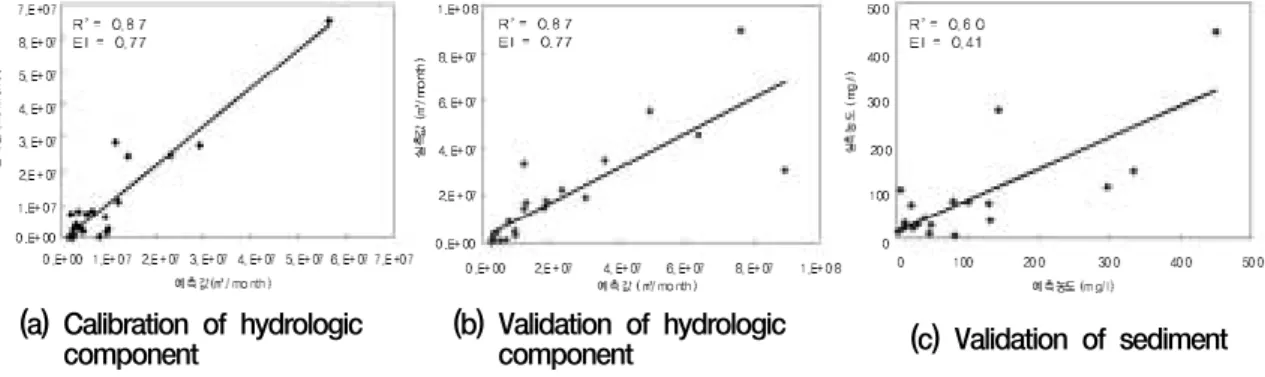
Fig. 9. Assesment of SWAT accuracy in predicting hydrologic and sediment component at the Doam-dam watershed (허 등, 2005)
(a) Calibration of hydrologic
component (b) Validation of hydrologic
component (c) Validation of sediment
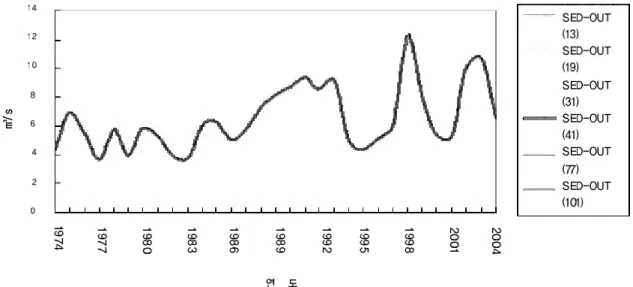
Fig. 10. Annual average flow with various threshold value for subwatershed delineation at the Doam-dam watershed
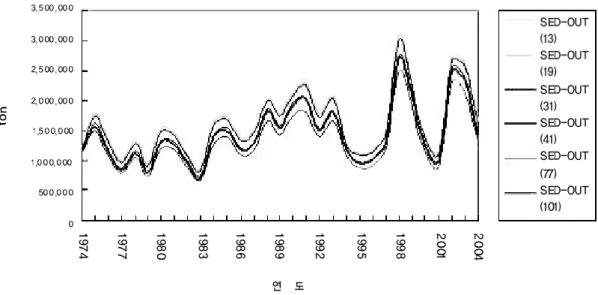
Fig. 11. Annual average sediment with various threshold value for subwatershed delineation at the Doam-dam watershed
Fig. 12. Annual average T-N loads with various threshold value for subwatershed delineation at the Doam-dam watershed
Ⅳ. 요약 및 결론
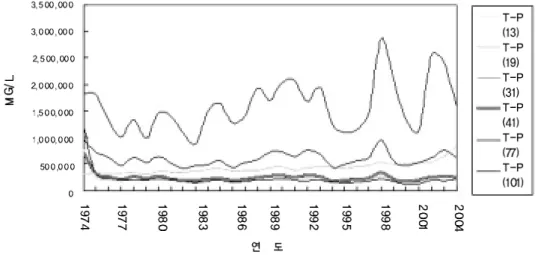
Fig. 13. Annual average T-P loads with various threshold value for subwatershed delineation at the Doam-dam watershed
1. 권명준, 권순국, 1998, SWAT 모형에서의 유출량 에 대한 HRU의 영향, 한국농공학회 학술발표회 논문집.
2. 김철겸, 김남원, 2005, SWAT 모형에서의 소유역 및 HRU 수에 따른 유사량 변화, 한국수자원학회 학술발표회 포스터발표 논문.
3. 김철겸, 김남원, 이정은, 2005, SWAT 모형을 이용 한 소양강댐 유역의 비점오염 모델링, 한국농공학 회 학술발표회 논문집.
4. 농촌진흥청 고령지농업시험장, 2000, 고랭지 채소 재배기술.
5. 물환경정보시스템, http://water.nier.go.kr/weis, Last accessed Nov. 5, 2006.
6. 조병옥, 1999, 고랭지 채소재배지의 토양환경 특성 과 비옥도 관리방안, 강원대학교 박사학위논문, p.81.
7. 최중대, 양재의, 박지성, 최병용, 김도환, 최경진, 1999, 농업 소유역의 토양유실량 예측을 위한 RUSLE의 적용, 한국농공학회 학술발표회 논문집.
8. 허성구, 김기성, 사공명, 안재훈, 임경재, 2005, 고랭 지 농경지의 토양유실 모의를 위한 SWAT 모형의 적용성 평가, 한국농촌계획학회, 11(4): pp.67-75.
본 연구는 농촌진흥청 고령지 농업연구소와 강원대학교 농업과학연구소의 지원을 받아 수행된 연구임.
9. 한국수력원자력(주), http://www.khnp.co.kr, Last accessed Nov. 5, 2006.
10. 허성구, 2006, 도암댐 유역의 산림파편화에 따른 수( ) 환경영향 평가, 강원대학교 석사학위논문.
11. 허성구, 김기성, 김재영, 유동선, 임경재, 윤정숙, 안 재훈. 2006, 객토를 고려한 도암댐 유역에서의 수문 및 유사 거동 모의, In Review, 한국농공학회지.
12. Arnold, J. G, P.M. Allen, and G. Bernhardt, 1993, A comprehensive surface-groundwater flow model J Hydrol, pp.43-69.
13. Arnold, J. G., Srinivasan, R. 1994, "Integration of a BASIN-SCALE Water Quality Model with GIS." Water Resources Bulletin, American Water Resources Association, pp.453-462.
14. Neitsch, S.L.. J.G. Arnold, J.R. Kiniry, and J.R.
Williams 2001, Soil and Water Assessment Tool;
theoretical documention, U.S Agricultural Research Service.
15. Srinivasan. R., and B.A. Engel. 1991, A Knowledge based approach to extract input data from Gis, ASAE Paper No. 91-7045, American Socity of Agricultural Enginneers, Summer Meeting Albuquerque, NW.