A New Ptosis Auto Analysis System and Algorithms Based on Surface Electromyography Sensor
Wan-Seok Noh
1, Dae Gu Son
2, Seon-Chil Kim
1, and Jong-Ha Lee
1, a*1
Department of Biomedical Engineering, School of Medicine, Keimyung University, 1095 Dalgubeol-daero, Daegu 42601, South Korea
2
Department of Plastic Surgery, Keimyung University Dongsan Medical Center 41931 Junggu Dalseongro 56, Daegu 41931, South Korea
a
[email protected]
Keywords: Ptosis, Eyelid, Auto analysis, Computer aided diagnosis, EMG
Abstract. The ‘Ptosis’ is a phenomenon that eyelid droops and cannot lifts on normal level. If somebody has the ptosis, they use the frontalis muscle in forehead when the eyes open. In this paper, the frontalis muscle’s EMG was measured about stare angle. People who have the ptosis were confirmed that they use the frontalis muscle more than normal people. Also, this paper verified that the ptosis is concerned movement of muscles around the eyes. Therefore, this paper proposes a system to quantify the ptosis as EMG signal level of the frontalis muscle.
Introduction
If the lifting power of eyelid from the levator palpebrae muscle becomes weak, eyelid is drooped and edge of eyelid cannot be lifted on normal level. This symptom is called the ‘Ptosis’.
Ptosis is the state that the upper eyelid is drooped and blepharophimosis caused by levator palpebrae superioris muscle itself or disorder of neurarchy. This can bring visual field defect. Ptosis largely classified nature and nurture, according to causes, neurogenic ptosis, myogenic ptosis, mechanical ptosis, aponeurotic ptosis. Levator palpebrae superioris muscle. If someone has ptosis, they probably have habit keeping their eyes lifted. Because of this habit, ptosis can bring secondary problems like beauty problem having wrinkles on forehead or trying to head back. To prevent these problems, we need fast diagnosis and surgical treatment.
Currently, the standardized way to diagnose ptosis is Margin Reflex Distance 1 (MRD_1) or Levator Function (LF). To measure the degree of ptosis, measurers use meter like ruler after block frontalis muscle of patient by pressing with the thumb. These ways are convenient to measure in a hospital. But these are subjective tests because many doctors diagnose the ptosis with the naked eye.
In other words, it is hard to express numerically.
In this paper, a system is designed for quantified the ptosis using the Electromyography (EMG) signal. The EMG is a technique for measuring and recording the electric signal generated by the skeletal muscle. Through experiment was proved the valid relation between the ptosis index (MRD_1 and LF) and EMG signal level of frontalis muscle’s movement.
Materials
The facial muscle’s movement measuring based on the EMG. The EMG is system that consists of various modules. For example, there are bio signal acquisition module that can obtain a signals, analog amplifier module that signals obtained, and filter module for removing noise of signals [1].
Usually, information of the surface EMG signal is measured at 8~500Hz are used [2].
Definition and Type of the EMG. The EMG is measured electrical signal evoked by the skeletal
muscle and peripheral nerve. After measuring, the EMG signal is recording. Thus, the measured
EMG evaluates the muscle’s function and exercise capacity. One of the EMG test type, the Nerve
Conduction Study (NCS) is measured by giving electrical stimulation to the peripheral nerve. The
other type of the EMG test, the Needle EMG (nEMG) test is measured by inserting a needle into the
muscle. Recently, the Surface EMG (sEMG) test is widely used due to its non-invasive and easy to measure. The Surface EMG test is measured by attaching electrode to the skin surface. This paper used the surface EMG to measure the movement of frontalis muscle.
The Caused and Symtoms of the Ptosis. There are two reasons of the ptosis that innate reason and acquired reason. The innate reason, levator palpebrae muscle is not developed properly. If the muscle has some problem, the ptosis can occurs. In contrast, the acquired reason is due to the aging and injury.
The eyelid of most patient who have the ptosis, their eyelid dropped and pupil covered. Dropped eyelid covered person’s sight. Therefore, eyes open by lifting the eyebrows, forehead and chin.
Finally, the ptosis patients are prone to wrinkles on the forehead. Also, this phenomenon cause the amblyopia [3, 4].
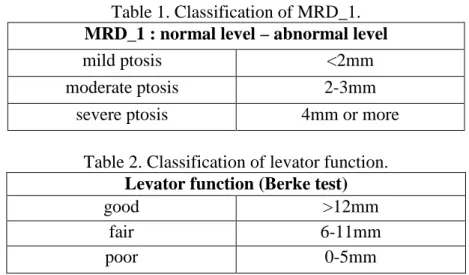
The Diagnosis of the Ptosis. Today, standardized ways to diagnose the ptosis are Margin Reflex Distance_1 (MRD_1) and Levator Function (LF). The MRD_1 is distance between center of the pupil and the upper eyelid when staring at the front. Normal level of MRD_1 is 4-5mm. Severity of the ptosis can be measured by difference between normal level to MRD_1 (normal level of MRD_1 – abnormal level of MRD_1). Degree of the ptosis can be determined as Table 1 [1].
Levator muscle function can be measured with Berke test. Measurer block frontalis muscle of a patient by pressing with the thumb. Then, upper eyelid to measure the distance moved when open the eye as much as possible after the eye let down. The shorter moving distance of eyelid, can be doubt the ptosis (Table 2) [3].
Table 1. Classification of MRD_1.
MRD_1 : normal level – abnormal level
mild ptosis <2mm
moderate ptosis 2-3mm
severe ptosis 4mm or more
Table 2. Classification of levator function.
Levator function (Berke test)
good >12mm
fair 6-11mm
poor 0-5mm
EMG Measurement Method Based the Ptosis. Eye’s movement is influenced by the frontalis muscel, corrugator supercilii muscle, orbicularis oculi muscle and levator palpebrae muscle. In order to measure the EMG of these muscles can be used the needle EMG (nEMG) test and the surface EMG (sEMG) test. The nEMG test is invasive method, whereas sEMG test is non-invasive method.
Therefore, non-invasive sEMG is suitable to use for measuring. The exact system design of filtering and signal processing algorithms, it is important to reduce the nosie.
Levator muscle function can be measured with Berke test. Measurer block frontalis muscle of a patient by pressing with the thumb. Then, upper eyelid to measure the distance moved when open the eye as much as possible after the eye let down. The shorter moving distance of eyelid, can be doubt the ptosis (Table 2) [3].
Methods
The Ptosis measured using EMG. In this experiment, association confirmed between stare angle and frontalis muscle’s EMG signal. Then, the EMG signals were compared with the ptosis index (MRD_1 and LF).
Subject and Method of Experiment. This experiment was conducted to subject Korean men and
women aged 20 to 24 years (n=17; mean age, 21.4 years). All people who participated the experiment
were performed at the same facility and same method. Muscle activity was recorded with a QEMG-4 system (LXM 3204, Laxtha, Korea). It is possible to measure the surface EMG of up to 4 channels.
These experiments were attached to a total of 4 electrodes on the left and right frontalis muscle using QEMG-4. Ground was attached electrodes began experiment without movement while they sat in a comfortable position. Also, experiment step was as follows: to had 7 seconds take each step.
1) Closing eyes in a comfortable position.
2) Opening eyes in same way.
3) Staring 15°downwards from the front.
4) Staring forward.
5) Staring 15° upwards from the front.
6) Staring 30° upwards from the front.
7) Staring upward more superiorly.
The reason for started the experiment while the eyes are closed in order to 1minimize unwanted movement of the eyes. This experiment is due to indicate a difference in the data resulting in a fine movement. Therefore, EMG measurements when closed eyes were not used in data analysis EMG.
All people who participated experiment maintained position while experiment.
ECG Data Analysis. The average of the frontalis muscle’s EMG that was measured by QEMG-4 calculated by the analysis program. For noise removal of the EMG signal used Band Pass Filter (BPF) and Fast Fourier Transform (FFT) algorithm, only the signal was filtered using 10Hz~400Hz. Also, average value of frontalis’s EMG is shown as the Root Mean Square (RMS) about stare angle. Eq. (1) is RMS.
RMS = ∑ ( − ) (1)
n is the number of people who participated in the experiment. is EMG average of i-th people and c is EMG average of all people in the experiment. Each EMG average value about staring angle analyze only recorded for 5 seconds exclude first 1 second and last 1 second of each segment. Stare angle is changed with the movement of the instantaneous recording it is because the muscles can lead to error.
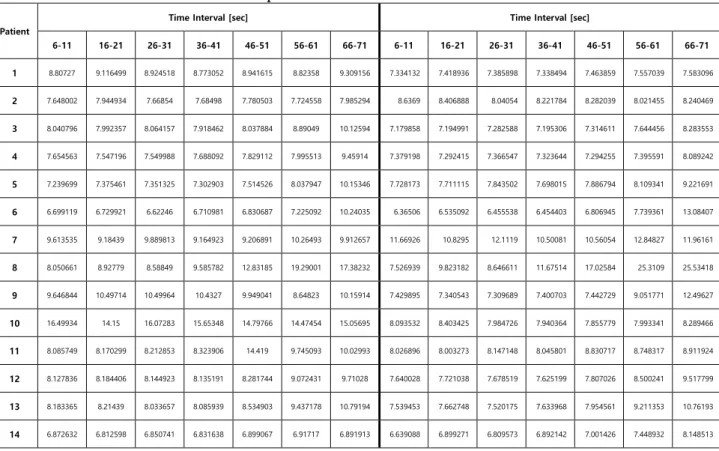
Table 3. Comparisons on RMS data for each interval.
Patient
Time Interval [sec] Time Interval [sec]
6-11 16-21 26-31 36-41 46-51 56-61 66-71 6-11 16-21 26-31 36-41 46-51 56-61 66-71
1 8.80727 9.116499 8.924518 8.773052 8.941615 8.82358 9.309156 7.334132 7.418936 7.385898 7.338494 7.463859 7.557039 7.583096 2 7.648002 7.944934 7.66854 7.68498 7.780503 7.724558 7.985294 8.6369 8.406888 8.04054 8.221784 8.282039 8.021455 8.240469 3 8.040796 7.992357 8.064157 7.918462 8.037884 8.89049 10.12594 7.179858 7.194991 7.282588 7.195306 7.314611 7.644456 8.283553 4 7.654563 7.547196 7.549988 7.688092 7.829112 7.995513 9.45914 7.379198 7.292415 7.366547 7.323644 7.294255 7.395591 8.089242 5 7.239699 7.375461 7.351325 7.302903 7.514526 8.037947 10.15346 7.728173 7.711115 7.843502 7.698015 7.886794 8.109341 9.221691 6 6.699119 6.729921 6.62246 6.710981 6.830687 7.225092 10.24035 6.36506 6.535092 6.455538 6.454403 6.806945 7.739361 13.08407 7 9.613535 9.18439 9.889813 9.164923 9.206891 10.26493 9.912657 11.66926 10.8295 12.1119 10.50081 10.56054 12.84827 11.96161 8 8.050661 8.92779 8.58849 9.585782 12.83185 19.29001 17.38232 7.526939 9.823182 8.646611 11.67514 17.02584 25.3109 25.53418 9 9.646844 10.49714 10.49964 10.4327 9.949041 8.64823 10.15914 7.429895 7.340543 7.309689 7.400703 7.442729 9.051771 12.49627 10 16.49934 14.15 16.07283 15.65348 14.79766 14.47454 15.05695 8.093532 8.403425 7.984726 7.940364 7.855779 7.993341 8.289466 11 8.085749 8.170299 8.212853 8.323906 14.419 9.745093 10.02993 8.026896 8.003273 8.147148 8.045801 8.830717 8.748317 8.911924 12 8.127836 8.184406 8.144923 8.135191 8.281744 9.072431 9.71028 7.640028 7.721038 7.678519 7.625199 7.807026 8.500241 9.517799 13 8.183365 8.21439 8.033657 8.085939 8.534903 9.437178 10.79194 7.539453 7.662748 7.520175 7.633968 7.954561 9.211353 10.76193 14 6.872632 6.812598 6.850741 6.831638 6.899067 6.91717 6.891913 6.639088 6.899271 6.809573 6.892142 7.001426 7.448932 8.148513
Result
We analyzed our results with averaged form of RMS. We segmented section according to height of the eyes and measured EMG of frontalis muscle. We measured three times for each patient and averaged each RMS data. If patients are not having the ptosis, they should be no much change in value. Most patients are few changes with time. However, Patient 8 is unusually large change in value.
We can assume that Patient 8 has a ptosis. Other case, Patient 10’s data are abnormally high. Patient 10 is hard to say ptosis, but we can assume Patient 10 uses frontalis muscle more than levator palpebrae muscle. Patient 10 is easy to wrinkles.
(a) (b)
Fig. 1 Seperated Averaging RMS Data.
Left and right EMG average of all people each stare angle section. The EMG levels have increased more people looked at the high angle.
Fig. 1 is graph that indicated variety of RMS value about stare angle of people who participated in the experiment. Fig. 1 (a) is graph of left eye’s variations and Fig. 1 (b) is graph of right eye’s variations. Each people had different RMS value.
Changing patterns of slope is sure that they are normal or having a ptosis. Normal RMS values of frontalis muscle belong to the ranges from 6 to 10mV. Except two data are greater variation when move on to the next step in the upper 30 degrees. However, People suspected ptosis going gaze upwards has increased dramatically change. Regardless of the experiment, one Patient 10’s action of the frontalis muscle did not show the tendency of ptosis but it remains high.
Compared with an error of the data groups using relative error Eq. (2), patient who can suspect ptosis has shown 58% on the left side and 71% on the right. When considering that most of the values are around 10%, patient 8 is noticeable.
e =
∆= (2)
Conclusion
This paper composed a system to quantify the ptosis by using the EMG signal of frontalis muscle.
Through experiment, the high stare angle was found to increase the average EMG levels. People who suspected ptosis increased tension of frontalis muscle by raising their eyes. Changes of data was evident enough to be sensitive. This system improves more objective and accurate than current diagnosis of the ptosis.
Acknowledgements
This work was supported by the Technological Innovation R&D Program (S2173477) funded by the Small and Medium Business Administration (SMBA, Korea) and supported by Basic Science Research Program through the National Research Foundation of Korea (NRF) funded by the Ministry of Education (2014R1A1A2056420).
Time Interval(sec)
6-11 16-21 26-31 36-41 46-51 56-61 66-71
Amplitude(mV)
4 6 8 10 12 14 16 18 20 22 24 26 28
T im e In terva l(s ec )
6-11 16-21 26-31 36 -41 4 6-51 5 6-6 1 66-71
Amplitude(mV)
4 6 8 10 12 14 16 18 20 22 24 26 28