보정 레이더 자료와 유출 모형을 이용한 홍수유출모의에 관한 연구
배 영 혜* / 김 병 식**+ / 김 형 수***
The Study on Flood Runoff Simulation using Runoff Model with Gauge-adjusted Radar data
Young Hye Bae* / Byung Sik Kim**+ / Hung Soo Kim***
요약 : 기후변화로 인하여 국지성 집중호우가 크게 늘어나고 그로인해 막대한 인적 및 물적 피해를 야기하고 있 다. 따라서 강우의 시간적·공간적 특성을 파악하는 것이 중요하다고 할 수 있다. 본 연구에서는 레이다 강우를 이 용하여 시공간적 변동성을 고려한 격자형 면적강우량을 산정하기 위하여 추계학적 방법인 칼만필터 기법을 이용 하여 지상 강우 관측망과 레이다 강우 관측망을 조합하여 면적강우량을 산정하였다. 또한 전통적인 지상 강우량 을 면적강우량으로 전환하는 기법인 Thiessen법, 역거리법, 크리깅 기법을 이용하여 면적강우량을 산정한 후 칼 만필터 기법에 의해 보정된 면적 레이다 강우와 비교하였다. 그 결과, 칼만필터 기법에 의해 보정된 레이다 강우 는 실제 강우 분포와 유사한 공간분포를 가지는 원시 레이다 강우 분포를 잘 재현하면서도 강우 체적은 우량계 자료의 체적과 유사하게 나타났다. 그리고 안성천 유역을 대상유역으로 선정하여 칼만필터 기법에 의해 보정된 레이다 강우를 물리적 기반의 분포형 모형인 VfloTM 모형과 준분포형 모형인 ModClark 모형에 적용하여 홍수유 출을 모의하였다. 그 결과, VfloTM 모형은 첨두시간과 첨두치가 관측 수문곡선과 유사하게 모의되었으며 ModClark 모형은 총 유출체적에서 좋은 결과를 나타냈다. 그러나 매개변수 검증에서는 VfloTM 모형이 ModClark 모형보다 관측 수문곡선을 잘 재현하였다. 이를 통해 지상강우와 레이더 강우를 적절하게 조합하여 정확도 높은 면적강우량을 산정하고 분포형 수문모형과 연계하여 홍수유출모의를 실시할 경우 충분한 적용성을 가지고 있음 을 확인할 수 있었다.
핵심용어 : 레이다 강우, 칼만필터, 분포형 모형, 홍수
Abstract : Changes in climate have largely increased concentrated heavy rainfall, which in turn is causing enormous damages to humans and properties. Therefore, it is important to understand the spatial-temporal features of rainfall.
In this study, RADAR rainfall was used to calculate gridded areal rainfall which reflects the spatial-temporal variability. In addition, Kalman-filter method, a stochastical technique, was used to combine ground rainfall network with RADAR rainfall network to calculate areal rainfall. Thiessen polygon method, Inverse distance weighting method, and Kriging method were used for calculating areal rainfall, and the calculated data was compared with adjusted areal RADAR rainfall measured using the Kalman-filter method. The result showed that RADAR rainfall adjusted with Kalman-filter method well-reproduced the distribution of raw RADAR rainfall which has a similar spatial distribution as the actual rainfall distribution. The adjusted RADAR rainfall also showed a similar rainfall volume as the volume shown in rain gauge data. Anseong-Cheon basin was used as a study area and the RADAR rainfall adjusted with Kalman-filter method was applied in VfloTM model, a physical-based distributed model, and ModClark model, a semi-distributed model. As a result, VfloTM model simulated peak time and peak value similar to that of observed hydrograph. ModClark model showed good results for total runoff volume. However, for verifying the parameter, VfloTM model showed better reproduction of observed hydrograph than ModClark model.
These results confirmed that flood runoff simulation is applicable in domestic settings(in South Korea) if highly
+ Corresponding author : [email protected]
* 비회원․한국건설기술연구원 연구원
** 정회원․한국건설기술연구원 수석연구원
*** 정회원․인하대학교 사회기반시스템공학부 정교수
accurate areal rainfall is calculated by combining gauge rainfall and RADAR rainfall data and the simulation is performed in link to the distributed hydrological model.
Keywords : RADAR rainfall, kalman filter, distributed hydrologic model, flood
1. Introduction
Conventionally, rainfall has been measured using rain gauges installed on the ground.
The rain gauges provide point rainfall, and the point rainfall is used for estimating the rainfall in region surrounding the rain gauges.
Rain gauge network is used for deciding the rainfall pattern in a basin or a certain region, but the network does not provide sufficient information for determining the spatial rainfall distribution between rain gauges. Therefore, hydrologists and hydrologic technicians apply spatial interpolation techniques such as Thiessen polygon technique, inverse distance weighting (IDW) method, or geographic statistical technique, Kriging, on point rainfall measured from rain gauges installed in proper spacing of low-resolution to convert the data from basin into spatial (areal) rainfall. Unfortunately, spatial distribution estimated using these techniques has almost no correlation with how the rain actually falls and leads to wrong rainfall for wrong time and place. Today, RADAR is being used as a tool for more accurate rainfall estimation.
RADAR provides high-resolution view of rainfall variability distant by sections and measures rainfall in grid of 1 ㎞ by l ㎞ or greater. This enables RADAR to provide information on rainfall with substantially greater spatial density than regular rain gauges. RADAR, nevertheless, does not directly measure the rainfall but measures reflectance within air and uses assumed
distribution of reflectance and rainfall intensity to estimate the rainfall. In other words, RADAR does not estimate accurate rainfall in a certain region, but rather estimates the relative rainfall in each region to derive at spatial variability.
The objective of this paper is to link adjusted RADAR rainfall with gridded rainfall- runoff model and simulate flood runoff for basins in South Korea. First, Kalman-Filter method, a stochastical technique, was used for adjusting the data from Imjin River rainfall RADAR in real-time. The adjusted RADAR rainfall data was inputted to ModClark (Modified Clark), a distributed model, and VfloTM model, a physical-based distributed model, to simulate flood runoff. In addition, methods used in today's practices, Thiessen polygon technique, inverse distance weighting (IDW) method, and Kriging method, were used for inputting the areal rainfall estimated from ground point rainfall data to the two models (as described before) to estimate flood runoff hydrograph and to compare the estimated hydrograph with the actual runoff hydrograph.
2. RADAR Rainfall Adjustment using Kalman-Filter Method
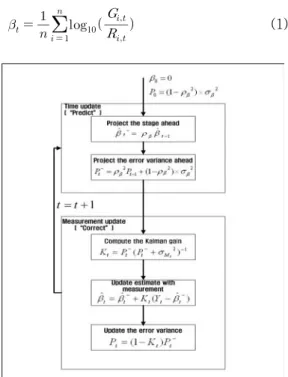
Ahnert (1986), Smith and Krajewski (1991), Anagnostou et al.(1998), Seo et al.(1999), and Dinku et al.(2002) used Kalman-filter method to forecast and update real-time MFB from RADAR data. In this paper, equation (1)
proposed by Chumchean et al.(2003) was used for estimating distribution over time.
MFB (logarithmic mean field RADAR rainfall bias) is defined as the following:
(1)
Figure 1. Kalman-Filter Method Flowchart (Chumchean et al., 2003)
refers to rainfall (㎜) for every hour measured at rain gauge i and time t;
refers to RADAR rainfall (㎜) not adjusted at ground rain gauge i and time t; lastly, n
refers to the number of data in pairs of RADAR-raingauge available at the time. Figure 1 is the flowchart for Kalman-filter method.
3. VfloTM Model and ModClark Model
VfloTM is a physical-based distributed hydrological model developed by Oklahoma University in the US. Spatially, the model uses finite element method for deriving numerical solutions (Vieux, 2001, 2002, 2004), and timely, the model uses finite difference method and kinematic wave equation to estimate surface runoff (Kim et al., 2007). Figure 2(a) shows the concept of VfloTM(Vieux, 2004).
John Peter from HEC developed ModClark to utilize spatial distribution in basins and spatial distribution of rainfall in real-time hydrological forecasting applications. The concept of ModClark model is based on fundamental principles of the conceptual rainfall-runoff model by Clark and is added with a function for simulating spatially distributed rainfall data. Real-time processing of ModClark was applied for gridded rainfall data of each cell, and the methodology is illustrated as in Figure 2(b).
(a) Concept Map of VfloTM Model (Vieux, 2004) (b) Runoff Concept Model of ModClark Model Figure 2. Concept Map of Distributed Model
4. Application and Analysis of the Model
Figure 3. Anseong-Cheon Basin
In this study, RADAR rainfall was estimated using the data obtained from Anseong basin, which has flood forecasting in operation, for flood simulation using RADAR rainfall and distributed models. Figure 3 is a basin map of Anseong observed from a RADAR.
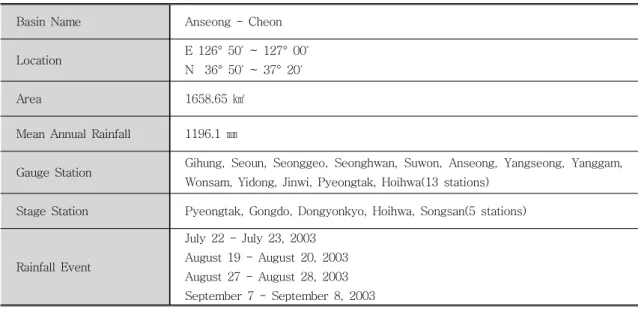
For target rainfall, data from 01:00, July 22 - 04:00, July 23, 2003, 11:00, August 19 - 01:00, August 20, 2003, 11:00 - 23:00, August 27, 2003, and 03:00, September 7 - 05:00, September 8, 2003 was used. Table 1 summarizes study area characteristics.
Basin Name Anseong - Cheon
Location E 126° 50′ ~ 127° 00′
N 36° 50′ ~ 37° 20′
Area 1658.65 ㎢
Mean Annual Rainfall 1196.1 ㎜
Gauge Station Gihung, Seoun, Seonggeo, Seonghwan, Suwon, Anseong, Yangseong, Yanggam, Wonsam, Yidong, Jinwi, Pyeongtak, Hoihwa(13 stations)
Stage Station Pyeongtak, Gongdo, Dongyonkyo, Hoihwa, Songsan(5 stations)
Rainfall Event
July 22 - July 23, 2003 August 19 - August 20, 2003 August 27 - August 28, 2003 September 7 - September 8, 2003
Table 1. Summary of Study Area
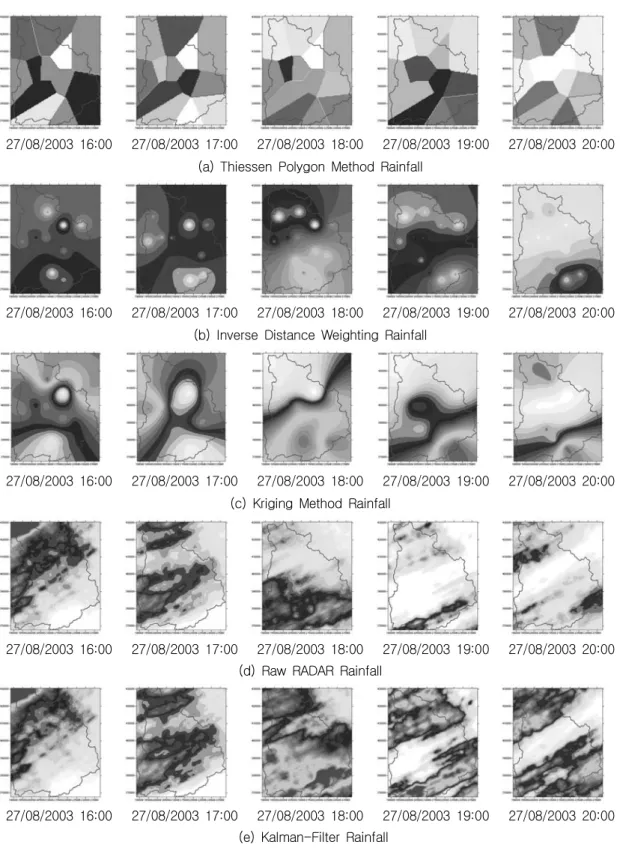
For the each event of rainfall, Thiessen polygon method, inverse distance weighting (IDW) method, and Kriging method were used to estimate adjusted RADAR rainfall and areal rainfall from the location of rain gauge station. The estimations were compared with gauge areal rainfall. Figure 4 shows spatial distribution of areal rainfall estimated from data obtained from 16:00 - 20:00, August 27, 2003 with areal rainfall estimation method.
As shown in Figure 4, when point rainfall is spatially distributed using areal rainfall estimation technique, spatial distribution different from that of actual rainfall was confirmed. Raw RADAR data showed a similar shape of spatial distribution as the actual rainfall distribution. But, raw RADAR rainfall often did not estimates accuracy the rainfall amount. Because of this, raw RADAR data has been adjusted with Kalman-filter method.
27/08/2003 16:00 27/08/2003 17:00 27/08/2003 18:00 27/08/2003 19:00 27/08/2003 20:00 (a) Thiessen Polygon Method Rainfall
27/08/2003 16:00 27/08/2003 17:00 27/08/2003 18:00 27/08/2003 19:00 27/08/2003 20:00 (b) Inverse Distance Weighting Rainfall
27/08/2003 16:00 27/08/2003 17:00 27/08/2003 18:00 27/08/2003 19:00 27/08/2003 20:00 (c) Kriging Method Rainfall
27/08/2003 16:00 27/08/2003 17:00 27/08/2003 18:00 27/08/2003 19:00 27/08/2003 20:00 (d) Raw RADAR Rainfall
27/08/2003 16:00 27/08/2003 17:00 27/08/2003 18:00 27/08/2003 19:00 27/08/2003 20:00 (e) Kalman-Filter Rainfall
Figure 4. Comparison of spatial-temporal Distributions of Areal Rainfalls
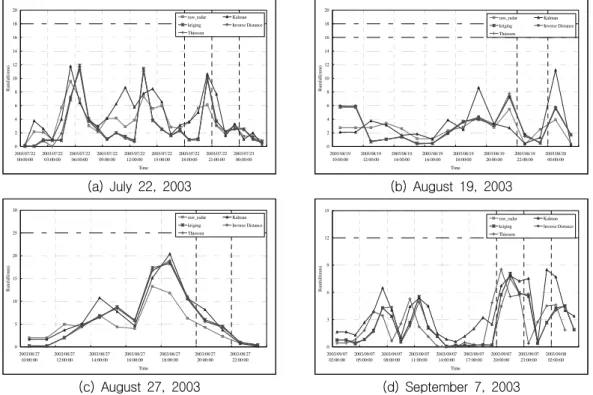
Figure 5 shows comparison between areal rainfalls estimated using each technique. Raw RADAR rainfall was mostly estimated to be greater than ground rainfall. RADAR rainfall adjusted with Kalman-filter showed an overall substantial change from the raw RADAR
rainfall. Accordingly, areal rainfall estimated using adjusted RADAR rainfall at the location of rain gauge station, which showed a big difference from areal rainfall estimated using gauge rainfall, displayed a value closer to the areal rainfall estimated using gauge rainfall.
0 2 4 6 8 10 12 14 16 18 20
2003/07/22 00:00:00
2003/07/22 03:00:00
2003/07/22 06:00:00
2003/07/22 09:00:00
2003/07/22 12:00:00
2003/07/22 15:00:00
2003/07/22 18:00:00
2003/07/22 21:00:00
2003/07/23 00:00:00 Time
Rainfall(mm)
raw_radar Kalman
kriging Inverse Distance Thiessen
0 2 4 6 8 10 12 14 16 18 20
2003/08/19 10:00:00
2003/08/19 12:00:00
2003/08/19 14:00:00
2003/08/19 16:00:00
2003/08/19 18:00:00
2003/08/19 20:00:00
2003/08/19 22:00:00
2003/08/20 00:00:00 Time
Rainfall(mm)
raw_radar Kalman
kriging Inverse Distance Thiessen
(a) July 22, 2003 (b) August 19, 2003
0 5 10 15 20 25 30
2003/08/27 10:00:00
2003/08/27 12:00:00
2003/08/27 14:00:00
2003/08/27 16:00:00
2003/08/27 18:00:00
2003/08/27 20:00:00
2003/08/27 22:00:00 Time
Rainfall(mm)
raw_radar Kalman
kriging Inverse Distance Thiessen
0 3 6 9 12 15
2003/09/07 02:00:00
2003/09/07 05:00:00
2003/09/07 08:00:00
2003/09/07 11:00:00
2003/09/07 14:00:00
2003/09/07 17:00:00
2003/09/07 20:00:00
2003/09/07 23:00:00
2003/09/08 02:00:00 Time
Rainfall(mm)
raw_radar Kalman
kriging Inverse Distance Thiessen
(c) August 27, 2003 (d) September 7, 2003 Figure 5. Areal Rainfall for each Event
In this study, the data whose cell size are 500m was inputted to VfloTM model, and four rainfall event data mentioned above were used to simulate the runoff amount. Of the five stage stations located in Anseong basin, flood runoff was simulated at Pyeongtaek and Gongdo location. Vieux (2004) defined parameter with large in fluence on infiltration within soil, which are sensitive to the amount of flood runoff, as hydraulic conductivity and parameter that decides the shape of hydrograph (peak discharge, lag time, and other) as roughness coefficient. According to
Vieux, the two can be used for adjusting parameters. In terms of application in South Korea, Kim et al.(2007) performed sensitivity analysis of VfloTM for Jungrang basin. Based on the analysis result, parameter was adjusted to make it suitable for Anseong basin for this research. To simulate flood runoff using ModClark model, a cell size 1㎞
RADAR rainfall adjusted by Kalman-filter.
ModClark adjusted parameters for time of concentration, storage constant, and Muskingum K. Total of three rainfall events from August 19, 27, and September 7 , 2003
were used for adjusting parameter, and each of other events was used for verification.
As shown in Figure 6 -8, runoff simulation result from VfloTM after parameter adjustment better reproduced the observed hydrograph than the simulation using ModClark model after parameter adjustment. In addition, as
shown in the results of event verification, VfloTM model well-reproduced the peak time, but under- estimated the peak value. On the other hand, verification using ModClark model failed to reproduce both peak time and peak value similar to observed hydrograph.
0 40 80 120 160 200 240 280 320 360 400
20030819 10:00
20030819 14:00
20030819 18:00
20030819 22:00
20030820 2:00
20030820 6:00
20030820 10:00
20030820 14:00
20030820 18:00
20030820 22:00 Time
Runoff(CMS)
0
10
20
30
40
50
Obs Vflo ModClark
0 200 400 600 800 1000 1200 1400
20030827 10:00
20030827 14:00
20030827 18:00
20030827 22:00
20030828 2:00
20030828 6:00
20030828 10:00
20030828 14:00
20030828 18:00
20030828 22:00 Time
Runoff(CMS)
0 10 20 30 40 50 60 70 80 90 100
Obs Vflo ModClark
(a) Adjusted August 19, 2003 Event (b) Verified August 27, 2003 Event Figure 6. Comparison of Results after Adjusting VfloTM and ModClark Model (Pyeongtaek Location)
0 200 400 600 800 1000 1200
20030827 10:00
20030827 14:00
20030827 18:00
20030827 22:00
20030828 2:00
20030828 6:00
20030828 10:00
20030828 14:00
20030828 18:00
20030828 22:00 Time
Runoff(CMS)
0
20
40
60
80
100
Obs Vflo ModClark
0 500 1000 1500 2000 2500 3000 3500 4000 4500 5000
20060727 15:30
20060727 21:00
20060728 2:30
20060728 8:00
20060728 13:30
20060728 19:00
20060729 00:30
20060729 6:00
20060729 11:30
20060729 17:00 Time
Runoff(CMS)
0
20
40
60
80
100
120
Obs Vflo ModClark
(a) Adjusted August 27, 2003 Event (b) Verified July 27, 2006 Event
Figure 7. Comparison of Results after Adjusting VfloTM and ModClark Model (Pyeongtaek Location)
0 100 200 300 400 500 600 700
20030907 3:00
20030907 8:00
20030907 13:00
20030907 18:00
20030907 23:00
20030908 4:00
20030908 9:00
20030908 14:00
20030908 19:00
20030908 24:00
20030909 5:00 Time
Runoff(CMS)
0
5
10
15
20
25
30
Obs Vflo ModClark
0 100 200 300 400 500 600 700
20030819 10:00
20030819 14:00
20030819 18:00
20030819 22:00
20030820 2:00
20030820 6:00
20030820 10:00
20030820 14:00
20030820 18:00
20030820 22:00 Time
Runoff(CMS)
0
10
20
30
40
50
60
70
Rainfall(mm)
Obs Vflo ModClark
(a) Adjusted September 7, 2003 Event (b) Verified August 19, 2003 Event Figure 8. Comparison of Results after Adjusting VfloTM and ModClark Model (Pyeongtaek Location)
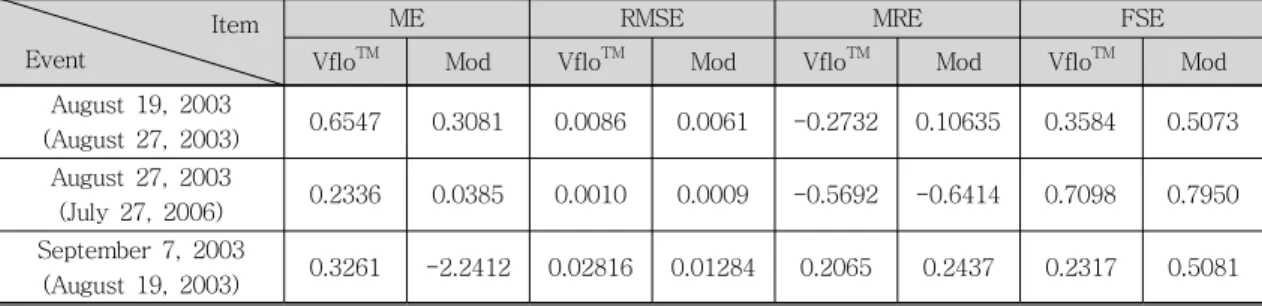
Table 2 and 3 shows ME (Model Efficiency), RMSE (Root Mean Square Error), MRE (Mean Relative), and FSE (Fractional Standard Error) for the simulation results of VfloTM and ModClark model for a quantitative comparison(Kim et al., 2007); those are defined as the following:
(2a)
(2b)
(2c)
(3)
where is simulated value, is average value of observation, and is the
number of time interval.
(4)
(5)
where is simulated value and is observed value.
As shown in table 2 and 3, the results are different according to the each event. In table 2, the ME of ModClark is near to 1, while MRE of it also shows appropriateness of the model. RMSE and FSE shows that VfloTM is also appropriate model. However, Table 3 shows that VfloTM is better than ModClark After adjustment in terms of ME, MRE and FSE.
· Item Event
ME RMSE MRE FSE
VfloTM Mod VfloTM Mod VfloTM Mod VfloTM Mod
August 19, 2003 0.9075 0.9914 0.0660 0.2436 -0.034 -0.0231 0.0882 0.077
August 27, 2003 0.7612 0.8592 0.0551 0.0135 0.0617 -0.2733 0.1261 0.3413
September 7, 2003 0.9445 0.8293 0.0242 0.0324 -0.1076 -0.3326 0.1563 0.4731
Table 2. Error Calculation Results of VfloTM and ModClark Model (After Parameter Adjustment)
Item Event
ME RMSE MRE FSE
VfloTM Mod VfloTM Mod VfloTM Mod VfloTM Mod
August 19, 2003
(August 27, 2003) 0.6547 0.3081 0.0086 0.0061 -0.2732 0.10635 0.3584 0.5073 August 27, 2003
(July 27, 2006) 0.2336 0.0385 0.0010 0.0009 -0.5692 -0.6414 0.7098 0.7950 September 7, 2003
(August 19, 2003) 0.3261 -2.2412 0.02816 0.01284 0.2065 0.2437 0.2317 0.5081
Table 3. Error Calculation Results of VfloTM and ModClark Model (Model Verification)
5. Summary and Conclusion
In this paper, Kalman-filter method was applied into estimation of areal rainfall distribution by adjusting RADAR rainfall in Anseong-Chen basin. The adjusted RADAR rainfall was used for simulating flood runoff with physical-based distributed model VfloTM and conceptual distributed model ModClark.
Applicability of Kalman-Filter method and distributed models was tested using the above procedure, and the results obtained from the research areas follows.
(1) As a result of using Kalman-Filter method, a stochastical technique, for adjusting the data from Imjin RADAR station, the adjusted RADAR rainfall maintained the features of spatial variability of raw RADAR rainfall distribution and well-reproduced the rainfall intensity of rain gauge rainfall.
(2) Of the techniques for converting point rainfall into areal rainfall, Thiessen polygon method, inverse distance weighting method, and Kriging method were used to compare with estimated areal rainfall. As the actual areal rainfall is unknown, it was impossible to determine which areal rainfall is accurate, but areal rainfall estimated using Kalman-filter method well- reflected rain gauge rainfall while well-reproducing the actual rainfall distribution.
(3) For three rainfall events at Anseong basin, VfloTM and ModClark model were used for adjusting parameters at Pyeongtaek and adjusting model for each of other events; runoff simulation
results were compared after ward. For comparison of runoff simulation results after parameter adjustment, VfloTM model showed the peak time and the peak value that match the observed hydrograph. However, when the total runoff volume was compared, runoff simulation using ModClark model better reproduced the observed value. When models were verified using other events, VfloTM model did not match measured hydrograph as in the parameter adjustment but well- reproduced the peak time and the hydrograph shape. ModClark, on the other hand, failed to well-reproduce both the peak time and the peak value.
These results infer that VfloTM model simulate parameter adjustment and model verification with high accuracy since the VfloTM considers impacts of changes in physical features within a basin and the actual data. ModClark model can not portray the physical features of a basin as it is a distributed model closer to conceptual definition. As parameter adjustment with ModClark is performed by optimization, its accuracy for adjustment is excellent but the accuracy for verification is low.
Acknowledgments
This study has been conducted under the funding of Construction Technology Innovation Project of Ministry of Land, Transport, and Maritime Affairs.
References
1. Ahnert, P.R., Krajewski, W.F., and Johnson, E. R., (1986), "Kalman filter estimation of radar-rainfall mean field bias", 23rd Radar Meteorology Conf.
Amer. Meteor. Soc., pp. JP33-37 2. Anagnostou, E.N., Krajewski, W.F., Seo,
D.-J., Johnson, E.R. (1998), "Mean-field rainfall bias studies for WSR-88D", Journal of hydrologic engineering, Vol.
3, No. 3, pp. 149–159
3. Byung Sik Kim, Jun Bum Hong, Bo Kyung Kim, Hung Soo Kim(2007).
"Sensitivity Analysis for VfloTM Model In Jungnang", 2007 Conf. Korea Society of Civil Engineers, Korea, pp. 2010- 2014
4. Byung Sik Kim, Jun Bum Hong , Hung Soo Kim, Seok Young Yoon ,Byung Ha Seoh(2007). "Flood simulation using rainfall data from rain gauges and radar by Conditional Merging method", IAHR 5. Chumchean, S., Sharma, A., Seed, A.
(2003). "Radar rainfall error variance and its impact on radar rainfall calibration", Journal of Physics and chemistry of the earth, Vol. 28 pp. 27–
39
6. Dinku, T., Ananostou, E.N., Borga, M.(2002). "Improving radar based estimation of rainfall over complex terrain", Journal of Applied Meteorology, Vol.41, pp. 1163–1178 7. Emerson, C.H. (2003), "Evaluation of the
additive Effects of storm water detention basins of the watershed", Univ. of Drexel, Philadelphia
8. Henry, H. R.(1998). "Kalman filter in real-time hydrologic forecasting", A
tutorial Third Water Resources Operation and Management Workshop, pp. 184-194
9. Hoblit, B.C. and D. C. Curtis (2005),
"Radar Estimates + gauge Data: A Perfect Union", Southwest Hydrology, pp. 22-24
10. Hydrologic Engineering Center(2003).
"HEC-GeoHMS User's Manual", US Army Corps of Engineers
11. Hydrologic Engineering Center(2005).
"HEC-DSSVue User's Manual", US Army Corps of Engineers
12. James A. Smith, Witold F. Krajewski (1991), "Estimation of the Mean Field Bias of Radar Rainfall Estimates", Journal of Applied Meteorology, Vol. 30 pp. 397-412
13. Johnson, D., Smith, M., Koren, V., and Finnerty, B. (1999), "Comparing mean areal precipitation estimates from NEXRAD and rain gauge network", Journal Hydrologic Engineering, Vol. 4, No. 2, pp. 117-124
14. Kalman, R.E. (1960), "A new approach to linear filtering and prediction problems" Journal of Basic Engineering, 82 (D), pp. 5-45
15. Kalman, R. E. and Bucy, R. S.(1961).
"New Results in Linear Filtering and Prediction Theory", Journal of Basic Engineering Transaction of the ASME, Vol. 83, 1961, pp. 95-108
16. Koistinen, J. and Puhakka, T. (1981).
"An improved spatial gauge-radar adjustment technique", proc. 20th Conference on Radar Meteorology, AMS, pp. 179-186
17. Krajewski, W.F., Lakshmi, V., Georgakakos, K.P., and Jain, S.C.
(1991), "A monte Carlo study of rainfall sampling effect on a distributed catchment model", Water Resources Research, Vol. 27, No. 1, pp. 119-128 18. Kull, D.W., and Feldman, A.D. (1998),
"Volution of Clark’ Unit Graph Method to Spatially Distributed Runoff." Journal of Hydrologic Engineering, Vol. 3, No.
1, pp. 9-19
19. Ogden, F.L., and Julien, P.Y. (1994),
"Runoff model sensitivity to radar rainfall resolution", Journal of Hydrology, Vol.
158, pp. 1-18
20. Seo, D. J., J.P. Breidenbach, E.R.
Johnson (1999), "Real-time estimation of mean field bias in radar rainfall data", Journal of Hydrology, pp. 131-147
21. Smith, J.A., Krajewski, W.F. (1991),
"Estimation of mean field bias of radar rainfall estimates" , Journal of applied meteorology, Vol. 30, pp. 397-412 22. Sun, G., Amatya, D,M., Mcnulty, S.G.,
Skaggs, R.W, Hughes, J.H. (2000),
"Climate change impact on the hydrology and productivity of a pine plantation. Journal of the American Water Resources Association", Vol.
36(2), pp. 367-374
23. Vieux, B.E., Bedient, P.B.(2004).
"Assessing Urban Hydrologic Prediction Accuracy Through Event Reconstruction", Journal of Hydrology, August 2004, pp.
217-236
24. Vieux, B. E.(2004). "Distributed Hydrologic Modeling Using GIS", Second Edition, ISBN:1-4020-2459-2. Kluwer Academic Publishers, Dordrecht, pp.293.
25. Vieux, B. E. and Vieux, J. E.(2003).
"Operation Deployment of a Physics- based Distributed Rainfall-runoff Model
for Flood Forecasting in Taiwan", International Symposium on information from Weather Radar and Distributed Hydrologic Modeling July 7-8.
26. Vieux, B.E.(2004). "Distributed Hydro- logic Modeling Using GIS", Kluwer Academic Publishers”
27. Vieux, B.E. and Koehler, E.(2005).
VfloTM Model Advanced Training
28. Vieux, B.E.,(2001). "Distributed Hydrologic Modeling Using GIS", ISBN 0-7923-7002-3, Kluwer Academic Publishers, Norwell, Massachusetts, Wat.
Sci. Tech. Series, Vol. 38. pp. 293.
29. Vieux, B.E., Bedient, P.B.(2004).
"Evaluation of urban hydrologic prediction accuracy for real-time forecasting using radar", American Meteorological Society 18th Conference on Hydrology, Seattle, WA.
30. Vieux, B.E., Cui, Z., Gaur, A.(2004).
"Evaluation of a physics-based distributed hydrologic model for flood forecasting", Journal of Hydrology Vol.298, pp. 155-154.
31. Vieux, B.E., Vieux, J.E.(2002). "Vflo: a real-time distributed hydrologic model", Proceedings of the Second Federal Interagency Hydrologic Modeling Conference, July 28-August 1.
32. Vieux,B.E. and Bedient, P.B.(2004).
"Assessing urban hydrologic prediction accuracy through event reconstruction", Journal of Hydrology Vol.299, pp.
217-236.
○논문접수일 : 09년 10월 27일
○심사의뢰일 : 09년 10월 29일
○심사완료일 : 10년 01월 23일