132
조선업 근로자의 작업능력지수에 영향을 미치는 요소에 관한 연구
장 성 록
부경대학교 안전공학부(2009. 3. 7. 접수 / 2009. 10. 15. 채택)
A Study on Factors Influencing the Work Ability Index of Shipbuilding Industry Workers
Seong Rok Chang
Division of Safety Engineering, Pukyong National University (Received March 7, 2009 / Accepted October 15, 2009)
Abstract : The population over 65 years of age in Korea will be 10.3% of the entire population in 2008 indicating that Korea is already in an aging society. In addition, it is expected that Korea will be in an aged society in 2018 (population over 65 years of age : 14.3%) and that it will be in a post-aged society in 2026 (20.8%). Consequently, aged workers may also increase. It is well-known that the possibility to work longer and to live better is highly related to the work ability of individual. The objective of this study was to evaluate the work ability of each age group using the Work Ability Index(WAI) in the shipbuilding industry, and to assess the effects of social psychological stress, drinking characteristics, smoking characteristics, etc. on the WAI score. The results showed no significant difference on the effects of aging, drinking, and smoking characteristics. Interestingly, a statistical analysis on the effects of social psychological stress revealed a significant difference by stress levels. The difference of the average WAI score between the healthy group and the high risk group was about 10 points. Based on this result, it can be concluded that the stress level is an influential factor on WAI.
Key Words : work ability, Work Ability Index(WAI), aging, social psychological stress, shipbuilding industry
1. Introduction
*According to the National Statistical Office data in 2006, the population over 65 years in Korea will be 10.3% of the entire population in 2008 indicating that Korea is already in an aging society. In addition, it is expected that Korea will be in an aged society in 2018(population over 65 years of age : 14.3%) and that it will be in a post-aged society in 2026(20.8%). Con- sequently, the number of aged workers may also in- crease. The data of persons employed during the last ten years support this idea in that persons employed in their thirties, forties, fifties and sixties increased by 0.3%, 40%, 47% and 49%, respectively, even though persons in their twenties who were employed decreased by 9.3%1).
It is well-known that the possibility to work longer
and better is highly related to the work ability of individuals2). The Work Ability Index(WAI) is a kind of survey method developed by the Finish Institute of Occupational Health(FIOH) in 1994 to estimate the work capacity of aged workers. The WAI was revised from 3 Levels(Good, Moderate, and Poor) to 4 Levels (Excellent, Good, Moderate, and Poor) in 1998. In addition, it has a total seven items regarding physi- cal, mental, and social capacity3).
The goal of this study was to assess work ability of each age group using WAI in the shipbuilding in- dustry and identify influential factors on the WAI.
2. Material and methods 2.1. Population
This study surveyed 153 persons working for a heavy industry in Korea. The age group of this popu-
조선업 근로자의 작업능력지수에 영향을 미치는 요소에 관한 연구
한국안전학회지, 제24권 제6호, 2009년
133
Table 1. Distribution of Surveyed Groups
Age(year) 30~34 35~39 40~44 45~49 50~54 55~59 No response Total
Workers(n) 1 3 7 40 66 20 16 153
Percentage(%) 0.7 2.0 4.6 26.1 43.1 13.1 10.5 100.0
lation was 50.1 ± 4.49 years, and the distribution of this population is presented in Table 1.
In addition, the length of service was 21.2 ± 6.96 years. The age group was separated by the results of Tuomi et al. in 19984).
2.2. Methods
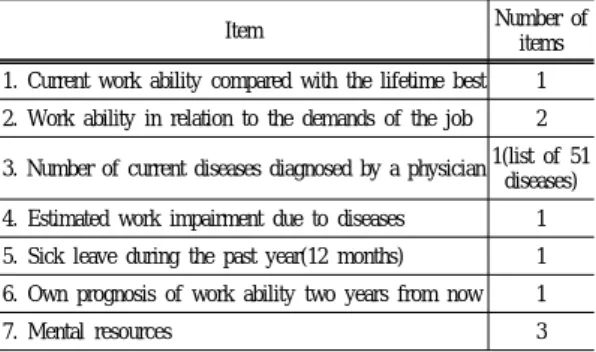
The current study made use of a survey form de- veloped by Kim et al. in 2007 that includes WAI questionnaires, personal information such as drinking, smoking etc., self-awared health status, and changes in health over the last ten years5). This survey was developed for the Safety and Health guidelines and manuals for preparing for an aging society. It was also developed to prevent industrial accidents in the field and its questions were classified into two sur- vey parts, namely the one for enterprise and the other for individuals. The survey for individuals has 65 questions, based on seven WAI items presented in Table 2.
The work capacity was measured by the responses of the survey using the WAI methodology. Each of the seven items of the WAI has a score ranging from zero to 10, and the final summarized results were bet- ween seven and 49. The score results are categorized as follows: Poor(7~27), Moderate(28~36), Good(37~
43), and Excellent(44~49).
Statistical analyses were performed using MINITAB 13. Prior to statistical model analyses, diagnostic tests
Table 2. Description of Seven Items Included in the WAI
Item Number of
items 1. Current work ability compared with the lifetime best 1 2. Work ability in relation to the demands of the job 2 3. Number of current diseases diagnosed by a physician1(list of 51
diseases) 4. Estimated work impairment due to diseases 1 5. Sick leave during the past year(12 months) 1 6. Own prognosis of work ability two years from now 1
7. Mental resources 3
were performed on the data, including a test for homoscedasticity(Bartlett’s Test and Levene’s Test) and normality(Anderson-Darling Normality Test). The results revealed that the raw data does not follow normality assumptions. On this basis, Kruskal-Wallis one-way nonparametric tests were employed in this study. This method is based on the ranks of raw data, and therefore do not need to follow normality assumptions.
3. Results
3.1. General results for the WAI score
The average WAI score for all workers was 39.7, denoting a Good level. Specifically, the average WAI score for 118 workers(77.2%) was 41.6 indicating an above Good level, and 21.6% and 1.3% of workers were at a Moderate level and a Poor level, respec- tively. From the specific results of current work abi- lity presented from zero(poor) to 10(excellent), the average score of all workers was 7.9 ± 1.3, indicating that their work ability is above the median. Also, 118 workers(77.2%) regarded as above the Good level responded at over eight in average, representing the best work ability.
Questionnaires related to physical and mental capa- city have five levels; 1(excellent), 2(good), 3(normal), 4(poor), and 5(very poor). The physical capacity was 2.7 in average, denoting that the capacity was higher than normal, and 62 workers(40.2%) were 1.8 in average showing that they were between excellent and good. The mental capacity was 2.6 in average, denoting that the capacity was higher than normal, and 66 workers(43.1%) were 1.8 in average, showing that they were between excellent and good. Meanwhile, 14 workers(10%) were between poor and very poor.
The questionnaires to identify current diseases and injuries were classified with the number of diseases and injuries recognized by the worker themselves and by doctors. The number of self-recognized diseases
장 성 록
Journal of the KOSOS, Vol. 24, No. 6, 2009
134
and injuries were 307 in total, including 54 injuries and 107 surgery diseases. The number of doctor- diagnosed diseases and injuries were 209 in total, including 47 injuries and 63 surgery diseases. Both categories revealed that surgery diseases are the highest factor. Among them, nervous diseases were higher in doctor-diagnosis(31 events) as compared to self-recog- nition(24 events).
The questionnaires to evaluate work losses by in- juries or diseases were classified into six levels in- cluding 1(not at all), 2(rarely), 3(sometimes), 4(often), 5(cannot work a day) and 6(no work). The overall average was 1.8, and 138 workers (90.2%) were bet- ween 1(not at all) and 2(rarely). Meanwhile, only one worker(0.7%) gave a score of 5(cannot work a day). The number of sick leaves last year appeared to have 2 workers(over 100 days, 1.3%), none(bet- ween 25~99 days, 0%), 6 workers(between 10~24 days, 3.9%), 37 workers(between 1~9 days, 24.2%) and 108 workers(0 days, 70.6%).
The working ability assessment after two years was classified into 1(cannot work), 4(hard to foresee) and 7(may work). The results showed that none of them could not work(score 1), and 20 workers(13.1%) were hard to foresee(score 4), and 133 workers (86.9%) might work(score 7).
The assessment for mental capacity has three items including “feeling happiness in regular or usual daily life”, “having an energetic or vigorous daily life”, and “having a prospective viewpoint for future”.
These three items were recorded in the ratings from 1(not at all) to 4(highly agree). The results showed one worker(0.7%) at score 1, 19 workers(12.4%) at score 2, 70 workers(45.8%) at score 3 and 63 wor- kers(41.2%) at score 4.
3.2. WAI scores by the age groups
The average WAI scores for all age groups were between 38 and 41 indicating a Good level, pre- sented in Table 3.
Regarding the results, it could be found that there is no significant difference by to the groups(p>0.05).
This means that work ability is not necessarily related to aging in Korea.
Table 3. Summarized Statistics for Age Groups
Age(year) Persons Median Avg. Rank P-value
30~34 1 38 40.5
0.716
35~39 3 39 47.8
40~44 7 39 74.9
45~49 40 41 75.3
50~54 66 40 67.2
55~59 20 41 64.8
3.3. WAI scores by the social psychological stress levels
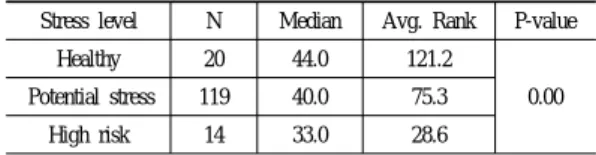
A total of 18 queries were used to assess stress on workers. Each item’s score was added and classi- fied as high risk(over 27 points), potential stress (between 9~26 points), and healthy(less than 8 po- ints). The overall average was 16.4 denoting poten- tial stress. Particularly, 20 workers(13%) were in the healthy group, and 14 workers(9%) were in the high risk group.
The average WAI score for the healthy group was 44.0, indicating an Excellent work ability level. Also, the average rank was 121.2 in the healthy group, representing a higher working ability. The average WAI score for the potential stress group was 39.6, denoting a Good level. The average WAI score for the high risk group was 34.1, representing a Mo- derate level.
These results and a Kruskal-Wallis test revealed a significant difference in the WAI level by stress levels, presented in Table 4.
3.4. WAI scores by drinking characteristics
Statistical results for the WAI scores by drinking characteristics are presented in Table 5. The resultsTable 4. WAI Scores by Social Psychological Stress Levels Stress level N Median Avg. Rank P-value
Healthy 20 44.0 121.2
0.00 Potential stress 119 40.0 75.3
High risk 14 33.0 28.6
Table 5. WAI Scores by Drinking Characteristics Drinking N Median Avg. rank P-value Almost no drinking 25 39.0 63.0
0.42
Sometimes 84 41.0 75.5
Frequently 36 40.0 74.0
조선업 근로자의 작업능력지수에 영향을 미치는 요소에 관한 연구
한국안전학회지, 제24권 제6호, 2009년
135
Table 6. WAI Scores by Smoking Characteristics Smoking N Median Avg. Rank P-value
None smoker 26 39 64.1
0.66
Smoker 54 40 71.1
Past smoker 60 41 72.7
of the Kruskal-Wallis test revealed no significant di- fference by drinking characteristics on the WAI scores.
3.5. WAI scores by smoking characteristics
Statistical results for the WAI scores by smoking characteristics are presented in Table 6. The results of the Kruskal-Wallis test on the WAI scores revealed no significant difference by smoking characteristics.4. Discussions and conclusion
The objective of this study was to evaluate work ability of each age group using the WAI in the ship- building industry and to assess the effects of social psychological stress, drinking characteristics, smoking characteristics, etc. on the WAI scores.
The results revealed no significant difference on the effect of aging even if the work ability of a group between 45 and 49 years of age was a little bit higher than other groups. This outcome is some- what different from common sense that the work ability might be decreased as workers aged6). The results may be attributed to the culture in the Korean society. For example, it is totally possible that workers might exaggerate their work ability because of the concern of layoff7). And results on the effects of drinking and smoking characteristics showed no sta- tistically significant difference on the WAI scores. It means that smoking and drinking are not related to work ability.
Interestingly, statistical analysis results on the effects on social psychological stress revealed a signi- ficant difference according to stress levels. The diffe- rence in the average WAI scores between the healthy group and the high risk group was about 10 points, and the difference in the average ranks was 92.6. On this basis, the effect of social psychological stress on WAI scores in the shipbuilding industry tells that stress level is an influential factor on work ability. In
addition to this, the correlation analyses between stress level and the seven items for WAI have a significant relation, except for doctor-diagnosed diseases and injuries(p<0.05).
Doctor-diagnosed diseases and injuries are directly related with current health status, but the other six items on the WAI are not directly related to current health and reflect the psychological status of workers.
These results support findings that social psychologi- cal stress has a significant effect on WAI scores even though aging does not have a significant effect on WAI scores.
Consequently, the current study revealed that work ability in the shipbuilding industry workers is related to stress level. Further investigation may be required to reveal which working environments cause higher stress in workers.
References
1) National Statistical Office, Annual Statistics, 2006.
2) Ilmarinen J., Tuomi K. and Seitsamo J., New dimen- sions of work ability. International Congress Series, 1280, 2005.
3) Ilmarinen J., Tuomi K., Klokars M., Aging and work ability index: a 10-year follow-up of municipal em- ployees. In: the paths of productive aging. Procee- dings of the 16th UOEH IIES International Sympo- sium and the IEA Technical Group for Safety and Health Conference, Japan, 1995.
4) Tuomi K., Ilmarinen J., Jahkola J., KataJarinne L. and Tulkki A, Work Ability Index. Finnish Institute of Occupational Health, 1998.
5) Kim H., Lim H.K., Song J.C., Park J.H., Kim D.H.
and Ko B.I., Safety & Health guidelines and manuals for preparing the aging society, Occupational Safety
& Health Research Institute, 2007.(In Korean) 6) Liira J., Matikainen E., Leino-Arjas P., Malmivaara
A., Mutanen P., Rytkonen H. and J. Juntunen , Work ability of middle-aged Finnish construction workers - a follow-up study in 1991~1995. International Journal of Industrial Ergonomics, Vol. 25, pp. 477~481, 2000.
7) Lee K.S., Chang S.R. and Lim H.K., Factors which affect elderly workers in reporting their workability, Proceedings of 16th World Congress on Ergonomics, Netherlands, 2006.