Big Data Analysis of Weather Condition and Air Quality on Cosmetics Marketing
Zebin Wang*․Tong Wu**․Xinshuang Zhao***․Shuchun Cheng****․Genghui Dai*****․Weihui Dai******
Abstract
Demands of cosmetics are affected not only by the well-known elements such as brand, price, and customer's consumption capacity, but also by some latent factors, for example, weather and air environment.
Due to complexity and dynamic changes of the above factors, their influences can hardly be estimated in an accurate way by the traditional approaches such as survey and questionnaires.
Through modeling and statistical analysis of big data, this article studied the impacts of weather condition and air quality on customer flow and sales of the cosmetics distributors in China, and found several hidden influencing factors. It provided a big-data based method for the analysis of unconventional factors on cosmetics marketing in the changing weather condition and air environment.
Keywords:Cosmetics Marketing, Big Data, Mathematical Modeling, Statistical Analysis
1)
Received:2017. 07. 06. Revised : 2017. 09. 10. Final Acceptance:2017. 09. 20.
※ This research work was supported by Online Education Research Center, Ministry of Education of China (Qtone Education, No.
2017YB115), Shanghai Pujiang Program (No. 16PJC007), and Xiyuan Program of Fudan University (No. 16509). Many thanks to Dr.
Hongzhi Hu for her assistance to Genghui Dai and Weihui Dai, who are the joint corresponding authors of this paper.
****** School of Mathematics, Fudan University, Shanghai 200433, China, e-mail:[email protected]
****** Business School, University of Shanghai for Science and Technology Shanghai 200093, China, e-mail:[email protected]
****** School of Management, Fudan University, Shanghai 200433, China, e-mail:[email protected]
****** School of Software, Fudan University, Shanghai 200433, China, e-mail:[email protected]
****** School of Marine Sciences, Sun Yat-Sen University, Guangzhou 200433, China, e-mail:[email protected]
****** Corresponding Author, School of Management, Fudan University, 220 Handan Rd, WuJiaoChang, Yangpu Qu, Shanghai Shi, China,
200433, Tel:+86-21-25011241, e-mail:[email protected]
1. Introduction
In the past, most of the Chinese women were using cosmetics with merely some simple func- tions, since the average income of Chinese peo- ple was rather low then. Nonetheless, in the re- cent years, some high-end brands of cosmetics are increasingly popular among Chinese women.
The country of China is the second biggest eco- nomic entity after the United States of America in the year of 2017. The flourish of economy and the increase of population enable China to be- come an enormous market of high-end cosme- tics.
In this article, we use the data provided by a shop of a certain brand that is owned by the company of ROHTO in Japan in order to prove the reliability of our research. ROHTO entered the market of China in 2010 and got lots of data in the process of communicating and trading with their customers. The shop that we collected data in detail is located in the city of Shanghai. We manage to bridge the gap between the marketing data collected by the company and weather fac- tors in Shanghai that will influence the customer flows. As a result, some marketing strategies may be developed and applied so as to raise the familiarity and recognition of the brand among Chinese customers.
According to the definition shown in Wiki- pedia, big data is a term to describe data sets that are so large or complex that traditional data processing procedures are inadequate or even unable to deal with them. In 2008, big data was mentioned in Nature [Frankel and Reid, 2008], and the terminology of ‘Big Data’ was popular
all over the world since then [Guo, 2014].
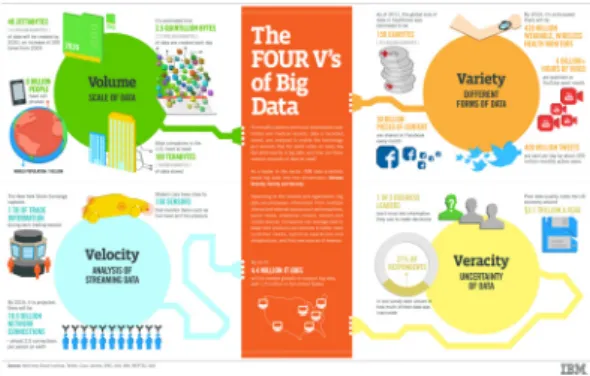
Figure 1 shows that there are four words used by researchers to define the characteristics of big data. The four words are known as Volume, Variety, Velocity and Veracity. The data sets have been extracted from authentic events but still with some unreliable parts. The volume and the variety of the data forces researchers to use some elaborate procedures to cope with them.
The velocity of the generation of the data sets requires researchers to provide the result of data analysis within 3 seconds. Otherwise, the re- sults are obsolete and useless. Data Mining (DM) and mathematics modeling are modern methods of analyzing huge amounts of data, which have already been equipped in many spe- cific aspects such as Traditional Chinese Medi- cine (TCM) and epidemiology [Brockmann and Helbing, 2013; Zhao et al., 2014].
<Figure 1> The Four V’s of Big Data
In the traditional concepts of businessmen, there are several fundamental components of a successful marketing strategy.
At first, the shops shall be carefully located
in prosperous downtown areas so as to attract
as many customers as possible. Second, the
salespersons need to be carefully elected and trained to ensure their service quality. Finally, companies shall learn to collect and analyze data to predict the requirements of the customers in the near future.
It is rather easy for us to find out that most of the cosmetics shops in China are located in modern shopping malls all around huge cities such as Beijing and Shanghai, some of which also have fancy decorations with plenty of pro- motion activities. Nevertheless, some companies unconcernedly ignore the importance of sta- tistics analysis and some hidden rules beneath the data are completely obscured. The article aims to find the ubiquitous connections between the weather condition and air quality in a certain place and the data of customer flows to provide a plausible way cosmetics marketing.
2. Impacts of Weather Condition and Air Quality
2.1 Characteristics of China’s Cosmetics Cus- tomers
Chinese women seem to have an unstoppable passion of buying and using skin-care cosmetics to make them increasingly elegant. The potential of their demand of cosmetics can hardly be esti- mated since they may earn much more money than expected in the following decades and even the most exquisite and expensive brands may be affordable for most of them at that time.
Usually, over seventy percent of the cos- metics are sold to customers who have already used cosmetics of this brand for a long period
of time. In other words, customers are loyal to those brands that they have been trusting for years. This phenomenon contributes to the fact that the key for companies to get advantages in the competition is to reserve their frequent customers and develop new customers. As many regular customers may stop using cosmetics in a certain brand when they cannot find products that are capable of satisfying their requirements, companies shall find the potential of the cos- metics market in an efficient and accurate way.
Besides, customers of cosmetics are facing different kinds of skin problems in different sea- sons of a full year. For example, some people may be allergic to dust or pollen in spring. As a result, there may probably be itchy red bumps on their faces that are caused by allergy. Lip- sticks, lotions and hand creams usually occupy a higher percentage of the total business volume of a cosmetics company in winter since the air moisture is statistically lower than that in summer. A lot of customers find their skin too dry to stay in a healthy condition and they want to buy some make-ups to compensate the neg- ative effects caused by weather condition.
2.2 Influencing Variables of Weather Condition and Air Quality
The condition of people’s skin is controlled by several factors, some of which can hardly be controlled. The quality of people’s skin deterio- rates when people are getting older or exposed towards the sun directly [Young et al., 2016].
Besides, weather condition and mental condition
may also contribute to the difference of skin
quality.
AQI (Air Quality Index) is an index used to measure the condition of air in China. The range of the index is from 0 to 500. The higher the AQI is, the worse the air condition will be. The AQI can be checked and copied from some na- tional statistics websites of China. Ultrafine par- ticles with a diameter of 2.5μm or less are called PM
2.5, which may penetrate into people’s lungs and cause diseases such as chronic bronchitis or lung cancer. PM
2.5is one of the most im- portant components that are used to calculate the index of AQI.
In 2017, researchers in Bahrain found out that rapid urbanization and industrialization neg- atively impacted the air quality there [Jassim and Coskuner, 2017]. As researchers have pro- ved some severe hazards of PM
2.5over people’s respiratory systems [Yang et al., 2017], the po- tential relationship between PM
2.5and custom- ers’ demands of cosmetics remains unknown.
Since PM
2.5is an important component in cal- culating the AQI and we did not find any accu- rate records of the level of PM
2.5from 2011/01/01 to 2011/06/30 in Shanghai, we use AQI index to represent the air condition so as to simplify the problem.
Theoretically, the average air humidity will affect the moisture of customers’ skin. Never- theless, the relationship between humidity and the total sales volume of cosmetics has not been carefully examined.
In conclusion, we are attempting to depict the profile of the hidden relationship of cosmetics market and weather variables including but not limited to those that have been mentioned above.
3. Modeling and Statistical Analysis of Weather Condition and Air Quality
3.1 The Relationship Between Humidity and Customer Flow
In statistics, the Pearson correlation coeffi- cient is used to measure the linear correlation of two vectors[9]. The value is between +1 and -1, as +1 means complete positive linear corre- lation, -1 means complete negative linear cor- relation and 0 means no linear correlation.
Habitually, we use the alphabet ‘R’ to denote the Pearson correlation coefficient. The abso- lute value of the correlation coefficient is used to measure the level of linear correlation. The phenomenon that the correlation coefficient is lower than 0.1 and higher than -0.1 indicates that there is nearly no linear correlation be- tween two variable vectors. In this article, we use the data of the number of customers buy- ing different kinds of cosmetics and the weather nearly everyday in the first half of the year of 2011.
<Figure 2> Air Humidity and Customer Numbers I
<Figure 3> Air Humidity and Customer Numbers II
<Figure 2> and <Figure 3> both show the relationship between air humidity and cosmetics market in the first half of 2011, but they have a crucial difference, as the X-axis variable in
<Figure 2> is the number of customers who buy all kinds of cosmetics in the following 15 days, and the X-axis variable in <Figure 3> is the number of customers who buy special-care cos- metics that are designed to cope with skin dehy- drate in the following 15 days.
After some statistics calculation, the Pearson correlation coefficient of the data shown in
<Figure 2> is R = 0.0752, the absolute value of the correlation coefficient is lower than 0.1, which indicates that there is nearly no linear connection between the two variables.
In <Figure 3>, the numbers of customers who buy special-care cosmetics are weakly connected with the air humidity at that time. The Pearson correlation coefficient is R = -0.2011,which shows a weak negative correlation between the two variables. If we use a one-degree polynomial (i.e. linear function) to fit the data spots, the equation of the line is shown in Equation 1.
(1) This phenomenon may tell us that customers are likely to buy more special-care cosmetics to
cope with dry weather, which proves the as- sumption mentioned above that dryer weather might contribute to the increase of the sales vol- ume of special-care cosmetics. However, the connection between air humidity and the sales volume of all kinds of cosmetics remains un- known.
3.2 The Relationship Between AQI and Customer Flow
At first, we downloaded the AQI reports from relative websites, and we want to find connec- tions between AQI and customer numbers.
We tried to use the data of AQI and the num- ber of customers directly and we created a plot with unprocessed data. Nonetheless, the data was almost chaotic and we could not find any connection between the two vectors of data. The unprocessed data is shown in <Figure 4>.
<Figure 4> The Unprocessed Data of AQI and the Number of Customers
The data shown in <Figure 4> has a correla-
tion coefficient R = -0.0441, which shows that
there is nearly no linear correlation between the AQI and customer number.
When we were examining the data once again, we found that the number of customers who en- tered the shop between 2011/4/16 and 2011/4/22 was extremely high. After checking the promo- tion plan of the cosmetics company in our re- search, we found that this company held a pro- motion activity at exactly the same time, which lasted for an entire week. Besides, The AQI in- dex was extremely high in a short period of time and even reached 500 from 2011/5/2 to 2011/5/3.
Those abnormal data points that can be noticed clearly in <Figure 5> may induce the pheno- menon that the results drawn from <Figure 4>
is not convincing.
<Figure 5> Some Abnormal Data Sets of AQI and Customer Number
It is straightforward to see from the plot that both the highest peaks of customer number and AQI in <Figure 5> shall be considered to be ab- normal data that are not reliable in calculating the Pearson correlation coefficient. Besides, there might be a delay between the deterioration of
air quality and customers’ demands of buying and using cosmetics.
In order to show the correlation between air quality and the number of customers and guar- antee the accuracy of our research, some data points are removed from the plot shown in
<Figure 4>. There are still 150 data points that are used and shown in <Figure 6>. In <Figure 6>, we use the numbers of customers 15 days later as the X-axis variable.
<Figure 6> The Plot of AQI and Customer Number 15 Days Later
After the calculation of Pearson correlation coefficient, we find that the correlation co- efficient between AQI and the number of cus- tomers is R = 0.2190, which indicates that AQI and the number of customers have a positive correlation, though the correlation is rather weak. The linear fitting function in Figure 6 is shown in Equation 2.
(2)
The result shows that there are more people
coming to the cosmetics shop a few days after
the deterioration of air quality. Some of the ab-
normal data points need to be removed so as to
find an appropriate approach towards the core
of this issue.
4. Hidden Influencing Factors through Big Data Analysis
4.1 Dimension Reduction Process
Dimension Reduction Process is a process of reducing the dimension of the data sets so as to simplify the issue to be researched. The un- processed data may compose of over 20 factors that are linearly independent. The process of di- mension reduction may refine the data sets and find some intrinsic characteristics in huge amount of big data. The process of factor analysis through dimension reduction can be separated into four steps.
The first step is to collect unprocessed data sets and normalize them via Z-score Normaliza- tion (i.e. to set the average of the statistics as 0 and set the variance as 1) in order to eliminate the difference of the order of magnitude between different data sets.
The second step is to judge whether the data sets are suitable enough to be processed through the process of dimension reduction. In this step, we use the Kaiser-Meyer-Olk in Measure of Sampling Adequacy and Bartlett’s Test of Sphe- ricity. Habitually, the data sets are suitable for dimension reduction when the KMO Measure is bigger than 0.75 and the significance level (usually abbreviated as Sig.) of Bartlett’s Test of Sphe- ricity is lower than 0.005.
The third step is to construct the factors and rotate them to explain them in an appropriate way.
The forth and the final step is to calculate the score of the factor variables and ultimately get the factors from the original data sets.
The process of dimension reduction has been used in a variety of aspects such as medical sci- ence, as researchers use fast dimension reduc- tion to analyze cancer molecular classification [Wu et al., 2015]. Some pieces of statistics soft- ware such as SPSS (Statistical Product and Service Solutions) already have several built-in functions of reducing the dimension of data sets, which may significantly raise the efficiency of big data analysis. We use SPSS to cope with the data sets that are related to weather con- dition and cosmetics market.
4.2 Rotated Component Matrix
In this article, we use 18 linearly independent sets of data to represent the weather condition in Shanghai between 2011/1/1 and 2011/6/30.
The 18 variables are shown in <Table 1>. All the temperatures mentioned in this article are recorded by degrees centigrade.
Name Type Unit
Max Temperature Number Degree (Centigrade) Mean Temperature Number Degree (Centigrade) Min Temperature Number Degree (Centigrade) Max Dew Point Number Degree (Centigrade) Mean Dew Point Number Degree (Centigrade) Min Dew Point Number Degree (Centigrade) Max Humidity Number Relative Humidity Mean Humidity Number Relative Humidity Min Humidity Number Relative Humidity Max Air Pressure Number hPa Mean Air Pressure Number hPa Min Air Pressure Number hPa
Max Visibility Number Kilometer Mean Visibility Number Kilometer Min Visibility Number Kilometer
Max Wind Speed Number km/h
Average Wind Speed Number km/h
AQI Number -
<Table 1> Declaration of Variables
<Figure 7> The Scree Plot of the Variables
At first, we need to normalize the variables that are shown above in the software of SPSS.
The results of the KMO Measure and Bartlett’s Test are shown in <Table 2>.
Kaiser-Meyer-Olkin Measure of Sampling Adequacy.
Bartletts Test of Approx. Chi-Square
Sphericity df
Sig.
.769
7107.766 153 .000
<Table 2> KMO and Bartlett’s Test
The results of the tests show that the varia- bles used in this case are suitable for dimension reduction, as the KMO Measure of the data sets is 0.769 and the significance level of Bartlett’s test is smaller than 0.001.
We may use the scree plot of the factors that are generated by our data sets as shown in
<Table 1> to choose appropriate factors. The bigger the eigenvalues shown in the scree plot are, the higher the importance of the factors will be. In this case, we omit the factors with ei- genvalues that are smaller than 1 to reduce the total dimension of the data sets from 18 to 4.
In other words, 4 linearly independent factors are enough to describe the unity of the entire data sets.
In <Table 3>, we rotate the component matrix by Varimax method with Kaizer Normalization and omit the coefficients that are smaller than 0.300 to emphasize the characteristics of all the four factors. The factors are denoted f
1, f
2, f
3and f
4from the left of the table to the right hand side.
Component
1 2 3 4
Zscore(MaxTemp) Zscore(MeanTemp) Zscore(MinTemp) Zscore(MaxDewPoint) Zscore(MeanDewPoint) Zscore(MinDewPoint) Zscore(MaxHumidity) Zscore(MeanHumidity) Zscore(MinHumidity) Zscore(MaxPressure) Zscore(MeanPressure) Zscore(MinPressure) Zscore(MaxVisibility) Zscore(MeanVisibility) Zscore(MaxWindSpeed) Zscore(MeanWindSpeed) Zscore(AQI)
.962 .985 .977 .955 .943 .878
-.972 -.967 -.955
.310 .406 .877 .950 .899
.367
-.417 .835 .972 .897 .899
.882 -.334
<Table 3> Rotated Component Matrix
aExtraction Method: Principal Component Analysis.
Rotation Method: Varimax with Kaiser Normalization.
a. Rotation converged in 5 iterations.
The Rotated component matrix indicates that
f
1is mainly related to temperature and air pres-
sure, f
2is mainly related to humidity and weak-
ly related to dew point, max visibility and AQI,
f
3is mainly related to Visibility and f
4is mainly
related to wind speed and weakly related to
AQI.
Coefficients
aModel Unstandardized Coefficients Standardized
Coefficients t sig
B Std. Error Beta
1 (Constant) 282.045 6.795 41.511 .000
REGR factor score 1 for analysis 1 48.412 6.814 .471 7.105 .000
REGR factor score 2 for analysis 1 11.671 6.814 .114 1.713 .089
REGR factor score 3 for analysis 1 -11.766 6.814 -.114 -1.727 .086
REGR factor score 4 for analysis 1 3.657 6.814 .036 .537 .592
<Table 4> The Coefficients I
a
Dependent Variable: Customer Number.
Coefficients
aModel Unstandardized Coefficients Standardized
Coefficients t sig
B Std. Error Beta
1 (Constant) 282.045 6.857 41.134 .000
REGR factor score 1 for analysis 1 48.412 6.876 .471 7.040 .000
<Table 5> The Coefficients II
a
Dependent Variable: Customer Number.
4.3 Multiple Linear Regression
By using the four factors generated above, we may use multiple linear regressions to find some intrinsic connections between weather and cos- metics market. The scores of the factors are used to find linear connections between a de- pendent variable and the factors via linear regression. In SPSS, the scores can be calcu- lated and saved as variables automatically by executing its built-in programs.
The numbers of the customers who enter the shop in the following 15 days between 2011/1/1 and 2011/6/30 are served as dependent variables.
In order to prevent inaccuracy, we adjusted cus- tomer numbers of the shop from 2011/4/16 and 2011/4/22 to minimize the effects caused by a promotion activity of the cosmetics company as mentioned above.
At first, we use all the four factors to con-
struct a multiple linear regression in SPSS and check the significance level of our procedure.
The results are shown in <Table 4>.
The significance level (abbr. Sig.) on the right hand side of <Table 4> represents the reliability of using this factor to generate a linear re- gression over the dependent variable. When the significance levelof a certain factor is over 0.020, we shall remove this factor and use the rest of the factors to finish the process of regression.
The significance levels of f
2, f
3and f
4in our case are 0.089, 0.086 and 0.592, so we are going to remove all those factors and execute the pro- gram of linear regression once again. The re- sults are shown in <Table 5>.
We may construct a regression model with
the equation as shown in Equation 3 to find the
hidden linear connection between weather and
customer numbers.
Coefficients
aModel Unstandardized Coefficients Standardized
Coefficients t sig
B Std. Error Beta
1 (Constant) 149.477 2.739 54.574 .000
REGR factor score 3 for analysis 1 -6.504 2.747 -.177 -2.368 .019
<Table 5> The Coefficients III
a