285
"J. korean soc. radiol., Vol. 10, No. 4, June 2016"
Factor Analysis of Decreased Score on Coronary Artery Calcium Score
Jae-Goo Shim,1 Yon-Min Kim,2,* Jin-Woo Kim3
1Department of Radiologic Technology, Daegu Health College
2Department of Radiotechnology, Wonkwang Health Science University
3Department of Health Promotion, Samsung Medical Center Received: June 10, 2016. Revised: June 25, 2016. Accepted: June 30, 2016
ABSTRACT
The purpose of our study was to retrospectively evaluate the cause of a decreased calcium score of follow-up studies on coronary artery calcium scores (CACs) computed tomography (CT). The subjects were healthy 100 people(85 males 60.6±6.9 years, 15 females 67.2±7.3 years). The subjects decreased CACs were divided into 4 subgroups depending on Agatston classification, minimal (1-10), mild (11-100), moderate (101-400), severe (400< ).
As a result of decreased CACs were scan location disagreement 51%, motion artifact 26%, equipment changes 14%, operator mistakes 5%, input miss 2%, image loss 1%, arrhythmia 1%. In the mild group, the most common decreased CACs were 49 people. In the minimal group, the most significant variation reduction has occurred to 6 people. Scan location disagreement was considered a partial volume effects due to the scan starting position. It showed less than 100 CACs a high variation (19.7%) in more than 100 CACs, a lower variation (2.2%), these could be seen that the variation range is different that can be tolerated according to the calcification score. Motion artifact factor was found in 26%, which is so closely related to the preceding tests that affect the higher heart rate like this pulmonary function test, exercise stress test.
Keywords: Coronary artery CT, calcium score, Agatston
Ⅰ
. INTRODUCTION
관상동맥 질환은 주요 사망 원인 중의 하나이며 과 거에 비해 심혈관 질환이 증가하고 있다. 심혈관 질환 의 조기진단 및 예방을 위한 검사 중 하나인 CT를 이 용한 관상동맥 석회화 측정은 Agatston에 의해 처음으 로 정량화하는 방법이 제시되어 현재 많은 병원에서 심혈관 질환의 예측인자로 활용하고 있다.[1-3] 관상동맥 내측 혈관 벽에 존재하는 칼슘의 양을 정량화하는 검 사로, 관상동맥 석회화점수가 심장질환 발생의 독립적 인 위험 예측인자로서 전통적인 다른 위험인자보다 우 수하다고 보고되어 있다.[4-6] 관상동맥 석회화점수 0은 정상이고, 1-10인 경우 minimal, 11-100인 경우는 mild, 101-400인 경우는 moderate, 400 이상이면 매우 높은
점수이다.[3]
임상에서는 많은 병원에서 건강검진 항목에 관상동 맥 석회화검사를 사용하고 있으며, 판정기준은 석회화 점수가 10 이하는 심각한 혈관 내 폐색이 거의 없는 수 준, 100 이상은 협착의 진행을 예상할 수 있고, 400 이 상은 외래 진료를 권유하고 있다. 그러나 최근에는 낮 은 석회화점수에서도 심혈관 질환의 잠재 위험도의 평 가가 계속 연구되고 있다.[7]
관상동맥 석회화점수는 연령증가에 따라 증가 추세 를 보이는 것이 일반적일 것으로 예상되나, 실제 임상 에서 일부 추적검사에서 석회화점수가 감소되는 경우 가 다수 발생하는 것을 경험하게 되었다. 이에 본 연구 에서는 건강검진을 2회 이상 받아서 석회화점수 추적 검사가 진행된 수검자를 대상으로 석회화점수의 감소 http://dx.doi.org/10.7742/jksr.2016.10.4.285
요인을 평가하여, 정확도에 영향을 미치는 요인들을 분석하고, 정확한 검사를 위한 방안들을 제시하고자 한다.
Ⅱ.
MATERIAL AND METHODS
본 연구는 2014년 1월 1일부터 2014년 12월 31일 까 지 서울소재 S병원 검진센터를 방문하여 Coronary arte ry CT, calcium score를 2회 이상 받은 이력이 있고, 그 중 석회화 점수가 이전에 비하여 낮아진 100명을 대상 으로 하였다. 대상자의 성별은 남자 85명(60.6±6.9세)과 여자 15명(67.2±7.3세)이 이었으며, 연령분포는 40대 1 명, 50대 48명, 60대 37명, 70대 12명, 80대 2명으로 이 었다.
사용한 장비는 Philips brilliance 40 CT(Philips, USA) 의 rotation time 0.4sec, FOV 250mm, resolution standar d, filter standard(B)를 사용하였고, GE VCT(GE, USA) 의 rotation time 0.4sec, FOV 250mm, resolution standar d를 사용하였으며, GE 750HD(GE, USA)의 rotation ti me 0.4sec, FOV 250mm, resolution standard를 사용하 였다(table 1).
Table 1. Scan parameter of exam equipment.
Equipment
scan parameter
kVp mAs slice
width(mm)
interval (mm)
Brilliance 40 120 55 2.5 25
GE VCT 120 50 2.5 20
GE 750HD 120 50 2.5 25
모든 검사에서 CT 장치와 심전도 동기화( ECG-Gati ng) 방법을 사용하여 prospective 방법으로 심박동이 70 이하인 집단에서는 mid- diastolic인 R-R interval 75 pha se에서, 심박동이 70이상인 경우 End-systolic인 R-R int erval 45 phase에서 scan을 시행하였다(Fig. 1). 검사한 s can data는 검사장비와 동일한 workstation으로 calciu m score를 측정하였다.
Agatston 점수는 CT Hounsfield unit(HU)가 130 이 상인 값에서 130~199 가중치(W: weighted factor ) 1, 2 00~299는 2, 300~399는 3, 400 HU 이상은 4를 플라크
면적에 곱하는 Agatston 방법으로 측정하였다(식 1).[3]
검사를 2회 이상 받은 수진자 중 석회화점수 감소가 발생한 경우를 추출하여 Agatston의
Fig. 1. we acquired images at R-R interval 75% or 45% during a single breath hold.
분류방법에 따라 minimal (1-10), mild(11-100), moderat e (101-400), severe(400< ) 4개 그룹으로 분류하였다.
×
×
(1)
Ⅲ.
RESULT
4개 그룹의 석회화점수 감소인원과 평균점수, 점수 평균 감소율은 Table 2와 같다. Mild 그룹에서 감소인 원이 49명으로 가장 많았으며, minimal 그룹에서 감소 율 변동이 가장 크게 나타났다.
100명의 대상자 중에서 석회화점수 감소 요인은 Tab le 3과 같다. Scan location 불일치 51%, Motion artifact 26%(Fig. 2), 장비변동 14%(Fig. 3), Image loss 1%, 중 첩(부정맥) 1%, 입력 miss 2%, 작업자의 실수 5%로 나 타났다. 그 중 가장 많은 Scan location 불일치를 다시 석회화점수 100을 기준으로 나누어 분석한 결과, 그룹 간 석회화 감소율은 100이하 19.7%, 100이상 2.2%로 나타났다.
"J. korean soc. radiol., Vol. 10, No. 4, June 2016"
(a) 2013’s score
(b) 2014’s score
Fig. 2. Calcium score of 2014 decreased compared to 2013 due to the motion artifact. Note that image in superior column show blurred calcifications in left anterior descending coronary artery, while on image in inferior column, calcifications are seen sharp image.
Table 2. Coronary artery calcium scores were divided into 4 subgroups depending on Agatston classification.
Risk group number average
score average
decreased rate(%)
minimal(1-10) 8 6.0 52.5
mild(11-100) 49 46.8 22.8
moderate(101-400) 26 217.6 12.5
severe(400<) 16 961.9 8.0
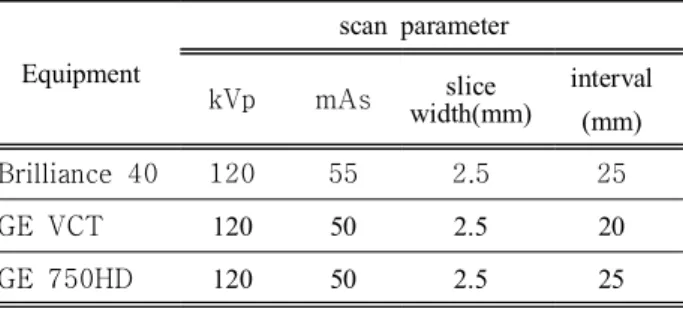
Table 3. Cause of decreased calcium score.
Reason Incidence number
Scan location 51
Mortion artifact 26
Equipment change 14
Operator error 5
Miss registration 2
Image loss 1
Image overlap 1
Total case 100
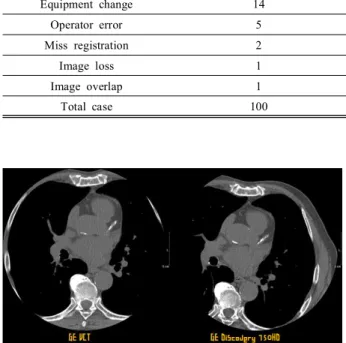
Fig. 3. Images show changes in appearance of calcifications due to the different equipment.
Ⅳ.
DISCUSSION
본 연구는 과거 검사영상과 석회화 수치를 비교하는 후향적 연구로 대상자를 100명으로 한정하였다. 그러 나 100명은 단일기관에서 1년 동안 발생한 건수로 석 회화점수의 감소는 주변에서 빈번하게 관찰되고 있는 것으로 생각된다. 이번 연구에서 mild 그룹인 10-100 사이의 석회화점수에서 가장 감소가 빈번하게 일어나 는 것으로 나타났으나, 감소 요인 중에는 검사자의 실
수 등이 포함되어 있다. 작업자의 실수 측면에서는 해 부학적 위치의 불일치와 부분적 score 누락이 발생하고 있었다. 석회화점수의 분석과 입력은 검사 자에 의해 처리됨으로 전문화된 능력을 갖출 수 있도록 지속적인 교육이 필요하고, 검사자 재교육 후에 질관리 측면에서 추가적인 연구를 진행할 예정이다. 또한, 석회화점수 감소 요인에 2가지 이상이 있는 경우도 있었으나 보다 영향을 많이 미치는 요인으로 연구자의 주관으로 분류 하였다. 각각의 요인들이 미치는 영향에 대한 보다 객 관적인 연구가 필요하겠다.
석회화점수의 변동성은 심박수, 검사자, 호흡, 부분 체적효과 등 많은 요인에 영향을 받는 것으로 알려져
있다.[8-13] 본 연구에서 석회화점수 감소의 가장 많은
비중을 차지한 요인은 scan location 이었다. 선행연구 에서 Rutten 등은[14] scan 시작 지점의 차이가 partial v olume effect와 석회화식별의 역치 값에 영향을 주어서, 석회화점수의 변화 요인이라고 하였다. 이는 검사가 진 행될 때마다 석회화를 scan하는 단면의 위치가 달라지 면서 생기는 것으로 석회화가 기록된 영상이 2개의 slic e와 1개의 slice로 각각 다르게 나타나는 경우였다. 또 한 같은 2개의 slice에서 검사가 되었을 지라도 위치가 약간씩 달라 각각 계산되는 석회화 점수가 달라지고 있었다. 이것은 Scan slice thickness 에 따른 partial volu me effect 에 의한 것으로 석회화점수가 100 이하로 작 은 그룹에서는 19.7%로 높게 나타난 반면에, 100 이상 인 그룹에서는 2.2%로 나타났다. 따라서 석회화점수가 낮은 그룹에서는 부분체적효과에 의한 영향이 커지는 것을 알 수 있었다.
Motion artifact 요인은 26%로 나타났으며, 이는 높은 심박동에 의한 것으로 심박동이 높거나 검사 전 폐기 능, 운동부하 등 심박동에 영향을 미치는 선행검사와 밀접한 관련이 있으므로 검사 시 주의가 요망된다. 사 전검사와 관련성을 고려하여 검사시점을 변경하는 등 의 노력이 필요하다.
장비변동 요인은 14%로 나타났으며, 동일한 scan 장 비, 프로토콜과 workstation을 이용하는 것이 정확한 검 사에 필수적이다. 또한 Image loss나 중첩 요인도 일부 나타났으며, 이는 부정맥 등에 인한 것으로 검사 시점 에서 즉시 확인하고 과거 이력과 비교하여 재검여부를 올바르게 판단하는 것이 요망된다. 검사자의 결과 관리
에서 score 자동입력 시스템을 만들어 활용하는 것도 정확한 석회화 점수 측정에 도움이 될 것으로 사료 된다.
Ⅴ.
CONCLUSION
본 연구에서 Scan location의 불일치가 51%로 가장 높게 나타났다. 이는 scan된 석회화의 slice 위치에 따른 부분체적 효과로 생각되며, 관상동맥 석회화 점수가 작 은 100 이하 그룹에서는 높은 변화폭(19.7%)이 나타났 고 100 이상의 그룹에서는 낮은 변화폭(2.2%)을 보여 석회화 점수에 따라 허용될 수 있는 변화폭이 달라진 다는 것을 알 수 있었다. 또한, 실제 임상에서 석회화 점수 측정 시 영향을 주는 요인들을 파악할 수 있었고, 관상동맥 칼슘 CT 검사 시 주의할 사항들에 대한 이해를 도울 수 있다는 점에서 그 큰 의미가 있다고 하겠다.
Acknowledgement
본 연구는 원광보건대학교 교내연구비의 지원에 의 해 수행되었다.
Reference
[1] Oudkerk M, Stillman AE, Halliburton SS, et al., “Co ronary artery calcium screening: current status and re commendations from the European Society of Cardiac Radiology and North American Society for Cardiovas cular Imaging”. Int J Cardiovasc Imaging Vol. 24, No. 6, pp. 645–671, 2008.
[2] Greenland P, Bonow RO, Brundage BH, et al., “ AC CF/AHA 2007 clinical expert consensus document on coronary artery calcium scoring by computed tomogra phy in global cardiovascular risk assessment and in e valuation of patients with chest pain: a report of the American College of Cardiology Foundation Clinical Expert Consensus Task Force (ACCF/AHA Writing C ommittee to Update the 2000 Expert Consensus Docu ment on Electron Beam Computed Tomography)”, Cir culation, Vol. 115, pp. 402–426, 2007.
[3] Agatston AS, Janowitz WR, Hildner FJet. al., “Quanti fication of coronary artery calcium using ultrafast co mputed tomography”, J Am Coll Cardiology, Vol. 1 5, pp. 827–832, 1990.
"J. korean soc. radiol., Vol. 10, No. 4, June 2016"
[4] Taylor AJ, Bindeman J, Feuerstein I, et. al., "Coronar y calcium independently predicts incident premature c oronary heart disease over measured cardiovascular ri sk factors: mean three-year outcomes on the Prospecti ve Army Coronary Calcium(PACC)project", J Am Co ll Cardiology, Vol. 46, No. 5, pp. 807-814, 2005.
[5] Shaw LJ, Raggi P, Schisterman E, et. al., "Prognostic value of cardiac risk factors and coronary artery calci um screening for all-cause mortality", Radiology, Vol.
228, No. 3, pp. 826-833, 2003.
[6] Kondos GT, Hoff JA, Sevrukov A, et. al., "Electron- beam tomography coronary artery calcium and cardiac events: a 37-month follw-up of 5635 initially asymp-t omatic low-to intermediate-risk adults", Circulation, V ol. 107, No. 20, pp. 2571-2576, 2003.
[7] Heangsoo Yoo, Jikoon Park, Bongjae Jung, et. al., “P otential Risk Assessment of Cardiovascular Disease in Low Calcium-Score", J. Korean. Soc. Radiology, Vol.
7, No. 6, pp. 369-376, 2013.
[8] Mao S, Bakhsheshi H, Lu B, Liu SC, et.al., “Effect of electrocardiogram triggering on reproducibility of c oronary artery calcium scoring”, Radiology, Vol. 22, No. 3, pp 707–711, 2001.
[9] Mao S, Budoff MJ, Bakhsheshi H, et. al., “Improved reproducibility of coronary artery calcium scoring by electron beam tomography with a new electrocardiogr aphic trigger method”, Invest Radiology, Vol. 36, No.
7, pp 363-367, 2001.
[10] Achenbach S, Ropers D, Mohlenkamp S, et al., “Vari ability of repeated coronary artery calcium measureme nts by electron beam tomography”, Am J Cardiology, Vol. 87, No. 2, pp 201-213, 2001.
[11] Wang S, Detrano RC, Secci A, et al., “Detection of coronary calcification with electron-beam computed to mography: evaluation of interexamination reproducibili ty and comparison of three image-acquisition protocol s”, Am Heart J, vol. 132, No. 3, pp 550-558, 1996.
[12] Devries S, Wolfkiel C, Shah V, et. al., “Reproducibil ity of the measurement of coronary calcium with ultr afast computed tomography”, Am J Cardiology, Vol.
75, No. 14, pp 973-975, 1995.
[13] Callister TQ, Cooil B, Raya SP, et. al., “Coronary ar tery disease: improved reproducibility of calcium scor ing with an electron-beam CT volumetric method”,
Radiology, Vol. 208, No. 3, pp 807-814, 1998.
[14] Annemarieke Rutten, Ivana Isgum, Mathias Prokop,
“Coronary Calcification: Effect of Small Variation of Scan Starting Position on Agatston, Volume, and Mas s Scores” Radiology, Vol. 246, No. 1, pp. 90-98, 20 08.
관상동맥 석회화점수 감소 요인 분석
심재구1, 김연민2*, 김진우3
1대구보건대학교 방사선과
2원광보건대학교 방사선과
3삼성서울병원 건강의학센터
요 약
이 연구는 관상동맥 CT 석회화점수 검사를 2회 이상 받은 자 중에서, 이전에 비하여 점수가 낮아진 원인 을 후향적으로 분석하였다. 건강검자 환자 100명(남자 85명 60.6±6.9세, 여자 15명 67.2±7.3세)을 대상으로 하였다. 석회화점수 감소가 발생한 경우를 Agatston의 분류 방법에 따라 minimal (1-10), mild(11-100), moder ate(101-400), severe (400< ) 4개 그룹으로 분류하였다. Mild 그룹에서 49명으로 가장 많았으며, minimal 그룹 에서 감소율 변동이 가장 크게 나타났다. 석회화점수 감소 요인은 Scan location 불일치 51%, Motion artifact 26%, 장비변동 14%, 작업자의 실수 5%, 입력 miss 2%, Image loss 1%, 부정맥 1% 로 나타났다. Scan locatio n의 불일치는 scan된 석회화의 slice 위치에 따른 부분체적 효과로 생각되며, 관상동맥 석회화 점수가 작은 100 이하 그룹에서는 높은 변화폭(19.7%)이 나타났고 100 이상의 그룹에서는 낮은 변화폭(2.2%)을 보여 석 회화 점수에 따라 허용될 수 있는 변화폭이 달라진다는 것을 알 수 있었다. Motion artifact 요인은 26%로 나타났으며, 이는 높은 심박동에 의한 것으로 심박동이 높거나 검사 전 폐기능, 운동부하 등 심박동에 영향 을 미치는 선행검사와 밀접한 관련이 있었다.
중심단어: 관상동맥 CT, 석회화 점수, Agatston