https://doi.org/10.5468/ogs.2019.62.5.335 pISSN 2287-8572 · eISSN 2287-8580
Introduction
Polycystic ovary syndrome (PCOS) is an endocrine disorder affecting women of reproductive age and is a frequent cause of anovulation as well as infertility [1,2]. It is a complex dis- ease entity with a wide range of symptoms and manifesta- tions, ranging from menstrual cycle disorders (oligomenor- rhea or amenorrhea); clinical and/or biochemical evidence of hyperandrogenism, to transvaginal ultrasound scan morphol-
Oxidative stress markers and lipid profiles of patients with polycystic ovary syndrome in a Nigerian tertiary hospital
Chukwunonso Isaiah Enechukwu 1,2 , Anaelechi Jude Onuegbu 2 , Madu Japheth Olisekodiaka 2 ,
George Uchenna Eleje 1 , Joseph Ifeanyichukwu Ikechebelu 1 , Joseph Odirichukwu Ugboaja 1 , Ubuo Kalu Amah 2 , John Ekenedirichukwu Okwara 2 , Anthony Osita Igwegbe 1
1
Department of Obstetrics & Gynaecology, Nnamdi Azikiwe University Teaching Hospital Nnewi, Nigeria;
2Department of Chemical Pathology, Faculty of Medicine, Nnamdi Azikiwe University, Awka, Nigeria
Objective
To determine the activities of oxidative stress markers and lipid profiles of patients with polycystic ovary syndrome (PCOS) in Nnamdi Azikiwe University Teaching Hospital Nnewi, Nigeria.
Methods
This was a nested case-control study consisting of 50 PCOS patients and 50 healthy women of the same age range without any evidence of PCOS. The study measured the levels of malondialdehyde (MDA), activity of superoxide dismutase (SOD), glutathione peroxidase (GSH-Px), total antioxidant capacity (TAC); concentrations of total cholesterol (TC), triglycerides (TG), and low-density lipoprotein cholesterol (LDL-C), as well as high-density lipoprotein cholesterol (HDL-C) using standard spectrophotometric methods. Anthropometric indices were also assessed. P-values of <0.05 were taken to be statistically significant.
Results
There were significantly higher levels of MDA (P=0.002), lower activity of SOD (P<0.001), and lower TAC (P=0.001) in PCOS patients when compared with the controls. There were higher concentrations of TC (P=0.017) and LDL-C P=0.012) in PCOS patients than in controls. Significant differences were not observed between the 2 groups in terms of the activity of GSH-Px, as well as the concentrations of HDL-C and TG. The body mass index, waist circumference, and waist-hip ratio were all significantly higher in PCOS patients.
Conclusion
This study revealed higher levels of MDA, as well as lower activity of SOD and TAC, among PCOS patients.
Furthermore, there were higher levels of TC and LDL-C among the PCOS patients. Hence, monitoring these parameters may improve the clinical management of PCOS.
Keywords: Polycystic ovary syndrome; Oxidative stress; Dyslipidaemia; Obesity; Cardiometabolic risks
Received: 2018.12.05. Revised: 2019.02.26. Accepted: 2019.03.18.
Corresponding author: Chukwunonso Isaiah Enechukwu Department of Obstetrics & Gynaecology, Nnamdi Azikiwe University Teaching Hospital Nnewi, Old Nnewi-Oba Road, Nnewi 435101, Nigeria
E-mail: [email protected] https://orcid.org/0000-0003-4639-5127
Articles published in Obstet Gynecol Sci are open-access, distributed under the terms of the Creative Commons Attribution Non-Commercial License (http://creativecommons.
org/licenses/by-nc/3.0/) which permits unrestricted non-commercial use, distribution, and reproduction in any medium, provided the original work is properly cited.
Copyright © 2019 Korean Society of Obstetrics and Gynecology
ogy of polycystic ovaries (PCO); with the exclusion of other etiologies [3]. Over the years, diagnosis has been contro- versial; however the Rotterdam criteria admit at least 2 out of the 3 aforementioned features for universally accepted diagnosis [4]. PCOS is also associated with some metabolic abnormalities such as dyslipidemia, obesity, insulin resistance, type II diabetes mellitus, and hypertension [5].
It is unclear what causes PCOS; however, it has been widely linked to insulin resistance which gives rise to hyper- androgenism, dyslipidemia and other metabolic disturbances [1,2]. Hyperandrogenism disrupts ovarian steroidogenesis as well as folliculogenesis, leading to anovulation [1]. Other possible etiological factors for PCOS include disorders of the hypothalamic-pituitary-ovarian axis, and the patient’s genetic predisposition, which varies geographically [6-10]. Presently, there appears to be a link between PCOS and oxidative stress, and whether oxidative stress is an etiology or a conse- quence is yet to be unravelled [1,2,5].
Oxidative stress ensues when there is an imbalance be- tween the generation of free radicals and antioxidants in biological systems, with a resultant negative shift in the equi- librium [11,12]. Excess free radicals, with unpaired electrons in their outermost shells react with both macro- and micro- molecules of the body, oxidizing them and consequently bringing about deleterious alterations within cells, on cell membranes and receptors, proteins, lipids, lipoproteins, car- bohydrates, and DNA strands [13-15].
At physiological levels; free radicals play some beneficial roles such as detoxification of pathogens, regulation of signal transduction and transcription, cell differentiation, and serv- ing as secondary messengers for the various tissues, organs and systems of the body [13,14]. Reactive oxygen species, balanced with their respective antioxidant enzymes, vitamins and minerals, modulate ovulatory function leading to cyclical release of mature follicles (ova) in readiness for conception [16,17]. Antioxidants protect the developing follicles and en- sure a homeostatic redox environment for the eggs [16,17].
Superoxide dismutase (SOD) and glutathione peroxidase (GSH-Px) are among the major antioxidant enzymes which neutralize oxygen free radicals and spare the body of their damaging effects [17,18]. Total antioxidant capacity (TAC) is a measure of the ability of biological materials to neutralize free radicals, hence preventing the evolution or propagation of a particular disease process [1,19].
Lipid peroxidation products include malondialdehyde (MDA)
and hydroxyl radicals, which accumulate as a result of intra- cellular and cell wall damage involving polyunsaturated fatty acids, with increased levels of reactive oxygen species [2,20].
Hence, serum MDA levels could reflect the extent of lipid peroxidation as well as cell membrane and DNA damage [21].
There is a paucity of studies on PCOS in developing coun- try settings. To the best of our knowledge, relationships between PCOS and oxidative stress markers, as well as lipid profiles, have never been investigated in our environment;
meanwhile, the disease entity (PCOS) displays significant ra- cial, familial, and genetic variation [1,8,10].
Moreover, previous studies in developed settings docu- mented inconsistent findings among PCOS patients in terms of activities of antioxidant enzymes and TAC. These incon- sistent findings ranged from higher to lower activities, and then to no significant differences. Hence, more studies are necessary to further investigate such relationships involving antioxidants and PCOS.
Furthermore, PCOS is a chronic and multisystemic disorder;
hence, wholistic management should go beyond evaluation of the reproductive problems of patients such as anovula- tory infertility and irregularity of menses. The various possible metabolic risks of this syndrome should also be investigated and monitored. The outcome of this study therefore, may inform the routine assessment of lipid profiles and possibly oxidative stress markers among PCOS patients in our gyne- cological practice. This may guarantee improved monitoring and management of the long-term metabolic complications of this syndrome.
The aim of this study therefore, was to determine the activ- ities of oxidative stress markers and lipid profiles of patients with PCOS in Nnamdi Azikiwe University Teaching Hospital (NAUTH) Nnewi, Nigeria.
Materials and methods
This study was conducted in NAUTH, which is a tertiary health institution in Nnewi, Anambra state, south-east of Nigeria. The subjects were selected, interviewed, and exam- ined at the gynecology clinic. Blood samples were collected, separated, stored and analyzed at the chemical pathology laboratory of NAUTH.
The study was a nested case-control research project con-
ducted among 50 PCOS patients and 50 healthy controls
of the same age range without any evidence of PCOS. The diagnosis of PCOS was made according to the Rotterdam criteria, as defined by the European Society for Human Re- production and Embryology and the American Society for Reproductive Medicine consensus declaration of 2003 [4].
The diagnostic criteria employed at least 2 out of the follow- ing 3 features: 1) Oligo- and/or anovulation; 2) Clinical and/
or biochemical evidence of hyperandrogenism; and 3) Trans- vaginal ultrasound scan morphology of PCO with 12 or more follicles in each ovary measuring 2–9 mm in diameter and/or increased ovarian volume >10 mL [3,4].
The subjects were duly informed about the study proto- col using an information sheet. Only subjects who met the inclusion criteria and gave written consent were recruited.
They were interviewed to obtain information on socio-de- mographic characteristics and relevant gynecological history, using a structured questionnaire. The eligible subjects were recruited over a period of 5 months, from 17th November 2016 to 20th April 2017. Women within reproductive age and diagnosed with PCOS according to the Rotterdam crite- ria were included, and these constituted the test group.
The control group were healthy women without any evi- dence of PCOS, recruited from members of the hospital staff and within the same age range as the test group. The study purpose and protocol were explained in detail to them with an information sheet before recruitment. Only subjects who freely gave consent were recruited for this study. The control and test subjects were reassured that participation was en- tirely voluntary. The ethical principles of confidentiality, sub- ject autonomy, and non-maleficence, amongst others were strictly followed to protect both the control and test subjects.
They were assured of anonymity. Their personal details were coded, no names were documented; they were assigned numbers, such that no data could be traceable to them.
The minimum sample size for each group was calculated using the formula;
N= [22]; Where N=sample size, Z=standard normal deviation at 95% confidence interval, which is 1.96, Q=alternate proportion (1–P), d=degree of precision set at 0.05, P=proportion of the target population. In this case, prevalence rate or proportion of PCOS patients in Nnewi=2.2% [7]. Therefore, N=33 subjects for each group.
To account for attrition; a new sample size N
1was obtained as follows: N
1=calculated sample× ; Where x=10% attri- tion. N
1=36.3~37 subjects for each group. Hence, a total of
74 subjects were needed as a minimum sample size for the study, i.e., 37 for the PCOS patients (test group) and another 37 for apparently healthy women (control group) without any evidence of PCOS and who were within the same age range. However, a total of 100 subjects were eventually re- cruited i.e. 50 for test group and another 50 for the control group, in order to increase the statistical power of the study.
The exclusion criteria were: PCOS patients diagnosed with diabetes mellitus, chronic hypertension, cardiovascular diseases, thyroid dysfunction, and endometriosis. Women diagnosed with PCOS who had been on hormonal therapy, lipid-lowering or insulin-sensitizing drugs over the previous 3 months were also excluded.
The body weight of each subject in kilograms (kg) was determined using a clinical weighing scale, while the height in meters (m) was measured using a stadiometer. Body mass index (BMI) was calculated by dividing the weight by the square of the height (kg/m
2). The World Health Organiza- tion (WHO) recognizes a BMI of 30 and above as obesity [23]. The waist circumference (WC) in centimeters (cm) was obtained with a non-stretchable measuring tape placed at the approximate midpoint between the lower border of the last palpable rib and the top of the iliac crest [23]. The hip circumference (HC) in cm was also obtained with the non- stretchable measuring tape placed around the widest portion of the buttocks, using the greater trochanter of the femur as a landmark. The waist-hip ratio (WC:HC) was then ob- tained by dividing the WC by the HC. The WHO recognizes a WC:HC ratio of greater than 0.85 as abdominal obesity in women.
23It also recognizes a cut-off point of 80 cm for WC of females who are at increased risk of metabolic complica- tions, and 88 cm for those at substantially increased risk [23].
The blood pressure of each subject was measured using a mercury sphygmomanometer and stethoscope.
1. Blood collection and analysis
Five mL of venous blood was collected aseptically from each subject into a plain tube using a sterile syringe and needle, from the ante-cubital vein of one of the arms, after an over- night fast of approximately 12–14 hours. The blood sample obtained was centrifuged at 3,000 revolutions per minute for 15 minutes. The serum derived from the blood was stored at −86°C and subsequently used to estimate the levels of total cholesterol (TC), triglycerides (TG), low-density lipopro- tein cholesterol (LDL-C), high-density lipoprotein cholesterol
Z
2PQ d
2100
100-x
(HDL-C) and MDA, as well as the activities of SOD, GSH-Px, and TAC. An enzymatic colorimetric method was used to assay the levels of TC, TG, and HDL-C, with their respective absorbances read by a spectrophotometer. LDL-C was de- termined using Friedewald’s formula. The level of MDA was determined as a measure of thiobarbituric acid reacting sub- stances. The activity of GSH-Px was determined using dithio- dinitrobenzoic acid; while SOD activity was estimated using the principle of inhibition of auto-oxidation of adrenaline.
TAC was estimated via the ferric reducing ability of plasma method.
2. Statistical analysis
All data obtained from the study were analyzed using the Statistical Package for Social Sciences (SPSS) Windows ver- sion 21.0 software (IBM Corp., Armonk, NY, USA, 2012).
Values are presented as means±standard deviation. Student’s t-test was used to test for statistical significance between the test group and the control group. Relationships between variables were assessed using Pearson’s correlation coeffi- cient. The results were regarded as significant at P<0.05.
Results
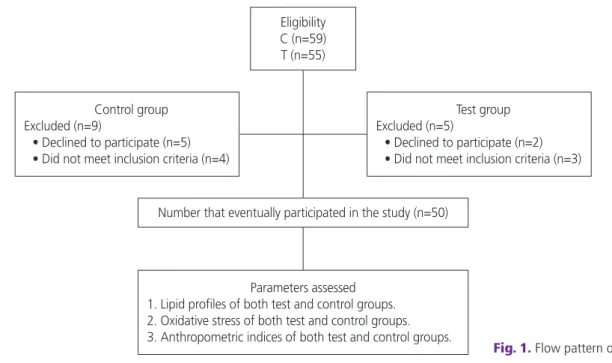
Fifty-five PCOS patients and 59 healthy controls were as- sessed for eligibility. Of these, 5 PCOS patients and 9 controls
were excluded, hence 50 test subjects and 50 controls were enrolled in the study (Fig. 1).
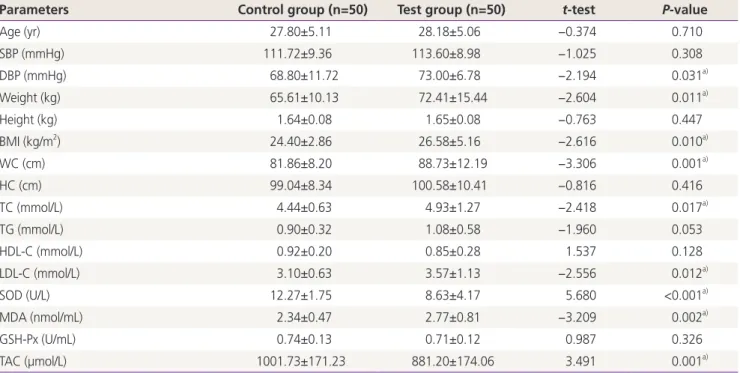
Results from this study revealed significantly higher val- ues for weight, BMI, WC, WC:HC ratio and diastolic blood pressure in the test group than the control group (Table 1).
There were no significant differences in age, height, HC and systolic blood pressure between the test group and the con- trol group (Table 1).
The mean serum level of MDA was significantly higher in women with PCOS than in the control group, while the mean activity of SOD and TAC were significantly lower in the test group than the control group (Table 1). No significant difference was observed in the GSH-Px activity between the test group and the control group (Table 1).
The mean serum levels of TC and LDL-C were significantly higher in the test group than the control group (Table 1). Sig- nificant differences were not observed in the mean TG and HDL-C between the test group and the control group (Table 1).
Oxidative stress markers according to central obesity in control and test groups showed no significant difference (Table 2).
The oxidative stress markers and lipid profile according to the menstrual cycle showed no significant difference among the control subjects (Table 3).
Among the 50 PCOS patients, 32 (64%) had frank PCOS;
8 (16%) had ovulatory PCOS; 7 (14%) were normoandrogenic, while 3 (6%) were non-PCO PCOS patients.
Fig. 1. Flow pattern of the study.
Eligibility C (n=59) T (n=55)
Number that eventually participated in the study (n=50)
Parameters assessed 1. Lipid profiles of both test and control groups.
2. Oxidative stress of both test and control groups.
3. Anthropometric indices of both test and control groups.
Control group Excluded (n=9)
• Declined to participate (n=5)
• Did not meet inclusion criteria (n=4)
Test group Excluded (n=5)
• Declined to participate (n=2)
• Did not meet inclusion criteria (n=3)
Discussion
In this study, mean serum MDA levels were significantly high- er in PCOS patients than in the corresponding control group.
The activity of SOD and TAC were significantly lower in PCOS patients when compared with the controls. There was no significant difference seen in the activity of GSH-Px in the
test and control groups. Significantly higher levels of TC and LDL-C were obtained in the PCOS patients when compared with the controls. No significant difference was seen in the mean HDL-C and TG concentrations in the test and control groups. The study also revealed significantly higher values for body weight, BMI, WC, and WC: HC ratio in the test group compared to the control group. There was no significant dif- ference in age, height, and HC between the test group and the control group.
This study revealed that mean serum MDA levels were significantly higher in PCOS patients than the controls. This finding corroborates other works [2,12,20,24]. MDA is an indicator of chronic oxidative states, which may be patho- logically found in PCOS patients. Insulin resistance, hyperan- drogenism, dyslipidemia and obesity associated with PCOS possibly increase the levels of MDA and at the same time decrease antioxidant enzyme levels [2,12]. The serum levels of MDA reflect the extent of lipid peroxidation and tissue damage ongoing in PCOS patients [20,21]. Even among non- obese PCOS patients, levels of MDA have also been found to Table 1. Mean±standard deviation (SD) of age, blood pressure, anthropometrics; serum levels of fasting lipid profile; malondialdehyde (MDA), superoxide dismutase (SOD), glutathione peroxidase (GSH-Px), and total antioxidant capacity (TAC) in polycystic ovary syndrome women and control group
Parameters Control group (n=50) Test group (n=50) t-test P-value
Age (yr) 27.80±5.11 28.18±5.06 −0.374 0.710
SBP (mmHg) 111.72±9.36 113.60±8.98 −1.025 0.308
DBP (mmHg) 68.80±11.72 73.00±6.78 −2.194 0.031
a)Weight (kg) 65.61±10.13 72.41±15.44 −2.604 0.011
a)Height (kg) 1.64±0.08 1.65±0.08 −0.763 0.447
BMI (kg/m
2) 24.40±2.86 26.58±5.16 −2.616 0.010
a)WC (cm) 81.86±8.20 88.73±12.19 −3.306 0.001
a)HC (cm) 99.04±8.34 100.58±10.41 −0.816 0.416
TC (mmol/L) 4.44±0.63 4.93±1.27 −2.418 0.017
a)TG (mmol/L) 0.90±0.32 1.08±0.58 −1.960 0.053
HDL-C (mmol/L) 0.92±0.20 0.85±0.28 1.537 0.128
LDL-C (mmol/L) 3.10±0.63 3.57±1.13 −2.556 0.012
a)SOD (U/L) 12.27±1.75 8.63±4.17 5.680 <0.001
a)MDA (nmol/mL) 2.34±0.47 2.77±0.81 −3.209 0.002
a)GSH-Px (U/mL) 0.74±0.13 0.71±0.12 0.987 0.326
TAC (µmol/L) 1001.73±171.23 881.20±174.06 3.491 0.001
a)Data are shown as mean±SD.
SBP, systolic blood pressure; DBP, diastolic blood pressure; BMI, body mass index; WC, waist circumference; HC, hip circumference; TC, total cholesterol; TG, triglyceride; HDL-C, high-density lipoprotein cholesterol; LDL-C, low-density lipoprotein cholesterol.
a)