Investigations of Soil Classification Methods using Cone Test Results
Dae-Kyu Kim
1*1Dept. of Civil Engineering, Sangmyung University
콘시험결과를 활용한 토질분류법의 고찰
김대규1*
1상명대학교 건설시스템공학과
Abstract In this study, the method by Robertson which has been most commonly used for classifying soils, using piezocone test results, was compared with that by Schneider which was most recently proposed. Both methods were applied to the soils in Gyeonggi province and the classifying results were investigated. It has been found that the difference between the results according to the methods was not so large and Schneider's method showed slightly better results for clay region and vice versa. Such factors as large field database, normalized tip resistance, pore water pressure, and drain condition were found to need further research for more reliable soil classification.
요 약 본 연구에서는 피조콘관입시험 결과를 활용한 토질분류법 중 가장 일반적으로 사용되고 있는 Robertson 방 법과 최근 발표된 최신 분류법인 Schneider 방법을 비교분석하였다. 이를 위하여 경기해안 지역의 연약지반을 대상으 로 두 방법 및 통일분류법의 토질분류 결과를 고찰하였다. 연구결과, 두 방법에 의한 결과 차이는 크지 않았으나 전 반적으로 Schneider 방법이 점토지역에서, Robertson 방법이 사질토에서 보다 정밀한 결과를 보였다. 보다 신뢰도 높 은 토질분류를 위하여 콘 시험의 데이터베이스, 정규화된 콘저항치, 간극수압 및 배수조건에 대한 심층 연구가 필요 하다.
Key Words : Piezocone, Soil Classification, Tip Resistance, Pore Water Pressure, Drain
*Corresponding Author : Kim, Dae-Kyu(daekyu@smu.ac.kr)
Received April 24, 2009 Revised (1st May 25, 2009, 2nd Jun 03, 2009) Accepted Jul 22, 2009
1. Introduction
The results of the piezocone penetration test have been importantly used for the soil classification and profiling as well as the assessment of geotechnical parameters (Douglas and Olson 1981, Campanella and Robertson 1988)[1,2]. Specially, Robertson(1990, 1991) proposed the classification chart using the normalized tip resistance, friction ratio, and pore pressure parameters to overcome the problems regarding the effect of the overburden pressure[3,4].
The Robertson's chart has been generally used for
classifying soils at deep depth including below 30m.
Nevertheless, additional complexities and uncertainties relevant to the drained, undrained, or partially drained conditions are involved in the Robertson's chart.
Schneider et al.(2008) developed the soil classifying method based on the Robertson's chart considering the various influencing factors[5].
In this study, both soil classification methods, Robertson's method which has been widely recommended as a specification in practice and Schneider's method which was most recently proposed, were applied to the soils in Gyeonggi province and compared with each other.
2. Descriptions of the Classifying Methods
Fig. 1, together with Eqs. 1 to 3, presents the soil classifying chart by Robertson(1990) using the normalized measured parameters from the piezocone penetration testing[3]. This chart has been generally accepted to be relatively reliable then widely used as a recommendation.
zone soil type
1 sensitive, fine grained 2 organic soils-peats 3 clays-clay to silty clay
4 silt mixtures clayey silt to silty clay
5 sand mixtures; silty sand to sand silty
6 sands; clean sands to silty sands 7 gravelly sand to sand 8 very stiff sand to clayey sand 9 very stiff fine grained
[Fig. 1] Classification Chart(Robertson 1990)
′
′
(1)
× (2)
(3)
where Qt, Fr, and Bq respectively indicate the normalized tip resistance, friction ratio, and pore pressure parameter. The σvo is total overburden pressure, σ'vo is effective overburden pressure. The qt denotes the total tip resistance corrected for the pore pressure effect, that is called unequal area effect, as in Fig. 2 and Eq. 4[6].
[Fig. 2] Pore Water Pressure Effects on Measured Parameters(Lunne et al. 1997)
(4)
where the qc is the measured tip resistance, the u2 is the measured pore water pressure acting behind the cone tip, and the a is the cone area ratio, which is equal to the ratio of the cross-sectional area of the load cell or shaft An divided by the projected area of the cone Ac in Fig.
2[6]. The fs and uo in Eqs. 2 and 3 respectively denote the measured sleeve friction and in-situ pore water pressure at u2 location. The excess pore water pressure Δu2 consists of Δuoct induced by the total stress increase of cone insertion and Δushear due to the soil shearing(Mayne and Bachus 1988)[7].
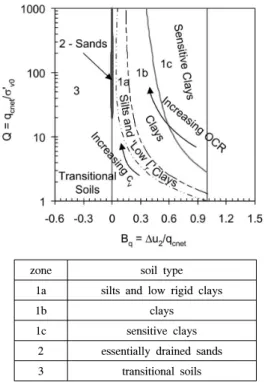
Schneider et al.(2008) developed the new classification chart based on parametric studies of field data and previous discussions(Fig. 3)[5]. The transitional soils in Fig. 3 likely have lower reliability if applying the standard drained or undrained testing parameters to the typical correlations.
zone soil type
1a silts and low rigid clays
1b clays
1c sensitive clays
2 essentially drained sands 3 transitional soils
[Fig. 3] Classification Chart(Schneider et al. 2008)
3. Investigations of the Classification Methods
Fig. 4 shows the comparisons of the soil classifications according to the Robertson's chart with to the Schneider's chart for the field data of the soils in Gyeonggi province, which were classified from the Unified Soil Classification System. Both charts were delineated on one plot for efficient investigations. The investigations were separately made for the representative three soil types; sandy, silty, and clayey soils.
The sub-soil profiles consist of the first layer with normally or slightly overconsolidated clayey soils from ground level to 15~20m depth and the second layer with sandy silt or silty sand. The sandy silt layer is in the mid depth of the clay layer with around 1m depth. The water content of the sandy, silty, and clayey soils were respectively 16~50%, 21~55%, 18~61%. The specific gravity were 2.61~2.71% for the sandy soils, 2.59~
2.72% for the silty soils, and 2.58~2.73% for the clayey soils. The test data of the soil layers with relatively shallow depth were not used but the data of the layers with deep homogeneous depth were used.
There are generally two types of soil classification methods in utilizing the measured parameters of the piezocone penetration testing. One is using tip resistance and excess pore water pressure. The other is using tip resistance and friction ratio. Though the friction ratio is corrected and normalized using the pore pressure and vertical stress, the field measurement of sleeve friction tends to unstably fluctuate then the method using it has low reliability in general. Same situation occurred in this study and the friction ratio method was not taken into consideration.
SP or SW SM or SC
(a) Sandy Soils
ML or MH
(b) Silty Soils
CL or CH
(c) Clayey Soils
[Fig. 4] Comparison of Soil Classifications according to Robertson's and Schneider's charts
The Robertson's chart resulted in better results for the sandy soils as shown in Fig. 4 (a). The soils in the category of SP and SW are supposed to locate in zones 2 and 3 in the Schneider's chart but many data are not in the zones, on the other hand, the field data were actually plotted in zones 6 and 7 in the Robertson's chart, that means pretty good results. The Robertson's chart gave better results for SM and SC soils also in that the field data were located mainly in zone 5.
It needs to be noted that significant negative pore water pressures were measured. Actually, the negative penetration pore pressure has been recorded in overconsolidated clays, stiff clays, sandy silts and other soil types(Finke et al. 2001, Finke and Mayne 2002)[8,9].
The negative value might result from the soil behavior such as heavy overconsolidation ratio but, in practice, it
has been a function of instrumental system like cavitation and degree of filter saturation(Kim and Lee 2000, Lim et al. 2003)[10,11]. The negative values of the field data used in this study are thought to be mainly due to the testing instrument as usual.
In Fig. 4 (b), it could be said that both charts produced the classifying results to reasonable extent. The data were plotted mainly in zone 'Silty and Low Ir Clays' in the Schneider's chart and in zone 3 and 4 together with 5 in the Robertson's chart.
For the clayey soils, the field data gave good agreement, as shown in Fig. 4 (c), with the Schneider's chart, as expected, since the Schneider's method has put more details on the behaviors of clayey soils. The Robertson's method could have been more useful and effective without the data in zone 5 and 6 indicating sandy soils.
It has been observed, as shown in Fig. 4 (a) to (c), that Robertson's chart gives generally better results for sandy soils but Schneider's chart results in better identifying for clayey soils, even though the differences might be slightly appreciated in part. The Robertson's chart provides more concretes for classifying sand behavior, whereas Schneider's chart presents additional detail for separating clay behavior; however, the soils outside the 1b or 2 zones showed relatively low levels of reliability.
The tip resistance in the piezocone penetration testing tends to increase as the effective overburden pressure increases with depth. This increase might cause errors in the interpreted soil classification using the raw testing data(Robertson 1990)[3].
It has been confirmed in this study, performed for the soft soils in Gyeonggi province, that the normalization of the measured parameters is required and the normalization method, which utilizes the vertical stress(Eqs. 1 to 3) rather than the cone factor relevant to the undrained shear strength, is effective for rational evaluation of soil classification. The normalization to the initial effective vertical stress is so practical and can be expected to lead to more analytical chart including such soil behavioral function as overconsolidation ratio.
It is noted that the classifying charts have been suggested and calibrated for limited database. The classification method, that is most appropriate for the soils in Korea, needs to be developed.
Such factors as large field database, method to normalize cone results including tip resistance, appropriate interpretation method considering the reliability of pore water pressure measurement and drain condition, which is composed of just fully drained or fully undrained, were found to need further research for more reliable soil classification.
4. Conclusions
In this study, two soil classification methods, using piezocone testing results, were applied to the soils in Gyeonggi province; The Robertson's chart generally which has been used in practice as a recommendation and the Schneider's chart which has been most recently suggested.
The classifying results were investigated and compared with each other. The following conclusions could made.
•The difference of the classifying results conducted according to the methods was not so large but the following trends were observed.
•The Robertson's method resulted in better results for the sandy soils.
•Both methods gave reasonable results to a reliable extent for the silty soils.
•The Schneider's method gave good agreement with the field data for the clayey soils.
•The negative pore water pressure measured behind the cone tip could be measured due to the testing instrument rather than the soil behavior.
•The field database as well as the proper analysis of the normalization and drain conditions need further research for more reliable classification.
References
[1] B. J. Douglas and R. S. Olson, "Soil Classification using Electric Cone Penetrometer", Cone Penetration and Experience, ASCE, G. M. Norris and R. D. Holtz, ed.
New York, pp. 209-227, 1981.
[2] R. G. Campanella and P. K. Robertson, "Current Status of the Piezocone Test", Invited Lectures, 1st Int. Conf.
on Penetration Testing, Disney World, pp. 93-116, 1988 [3] P. K. Robertson, "Soil Classification using the Cone
Penetration Test", Canadian Geotechnical J., pp.
151-158, Vol. 27, No. 8, 1990.
[4] P. K. Robertson, "Soil Classification using the Cone Penetration Test: Rply", Canadian Geotechnical J., pp.
176-178, Vol. 28, No. 1, 1991.
[5] J. A. Schneider, M. F. Randolph, P. W. Mayne, N. R.
Ramsey, "Analysis of Factors Influencing Soil Classification Using Normalized Piezocone Tip Resistance and Pore Pressure Parameters", J. of Geotechnical and Geoenvironmental Engineering, pp.
1569-1586, November, 2008
[6] T. Lunne, P. K. Robertson, J. J. M. Powell, Cone Penetration Testing, Blackie Academic and Professional, 1997.
[7] P. W. Mayne, R. C. Bachus, "Profiling OCR in Clays by Piezocone," Penetration Testing, Balkema, Rotterdam, The Netherlands, pp. 857-864, 1988.
[8] K. A. Finke, P. W. Mayne, R. A. Klopp, "Piezocone Testing in Atlantic Piedmont Residuum", J. of Geotechnical and Geoenvironmental Engineering, pp.
48-54, Vol. 127, No. 1, 2001.
[9] K. A. Finke, P. W. Mayne, "Closure to Piezocone Testing in Atlantic Piedmont Residuum", J. of Geotechnical and Geoenvironmental Engineering, pp.
443-446, Vol. 128, No. 5, 2002.
[10] D.-K. Kim, W.-J. Lee, "A Study on Piezocone Test using a Calibration Chamber", J. of Korean Geotechnical Society, pp. 99-106, Vol 16, No. 3, June, 2000.
[11] H.-D. Lim, D.-K. Kim, W.-J. Lee, "Initial Excess Pore Water Pressure Induced by Cone Penetration in Normally Consolidated Clays", J. of Korean Geotechnical Society, pp. 151-161, Vol 19, No. 1, Feb., 2003.
Dae-Kyu Kim
[Regular member]• Dec. 1999 : Louisiana State University, Ph.D.
• Mar. 2002 ~ current : Sangmyung University, Dept. of Civil Engineering, Associate Professor
<Research Interests>
Geotechnical Engineering, Soils and Foundations, Ground Exploration and Testing, Constitutive Relations, Numerical Analysis, Underground