D I A B E T E S & M E T A B O L I S M J O U R N A L
This is an Open Access article distributed under the terms of the Creative Commons Attribution Non-Commercial License (http://creativecommons.org/licenses/by-nc/4.0/) which permits unrestricted non-commercial use, distribution, and reproduction in any medium, provided the original work is properly cited.
Clinical Implications of Using Post-Challenge Plasma Glucose Levels for Early Diagnosis of Type 2 Diabetes Mellitus in Older Individuals
Kyong Hye Joung1,*, Sang Hyun Ju1,*, Ji Min Kim1, Sorim Choung2, Jae Min Lee3, Kang Seo Park3, Hyun Jin Kim1, Bon Jeong Ku1,2
Departments of 1Internal Medicine, 2Medical Science, Chungnam National University School of Medicine, Daejeon,
3Department of Internal Medicine, Eulji University School of Medicine, Daejeon, Korea
Background: The aim of this study was to explore the differences in the clinical characteristics and diagnostic rates of diabetes mellitus (DM) according to various criteria in different age groups and to evaluate the efficacy of each criterion for screening older patients.
Methods: We studied 515 patients and measured the fasting plasma glucose level (FPG), 2-hour plasma glucose level after the 75 g oral glucose tolerance test (2-hour postload glucose [2-h PG]), and glycosylated hemoglobin (HbA1c) for re-evaluation of hy- perglycemia without a history of diabetes. Patients with newly diagnosed DM were grouped by age as younger (<65 years) or old- er (≥65 years).
Results: Older patients had significantly lower HbA1c, FPG, and 2-h PG levels and a higher homeostatic level of pancreatic β-cell function compared with younger patients (P<0.001). The older group had the lowest diagnostic rate when using the FPG level (45.5%) and the highest diagnostic rate when using the 2-h PG level (84.6%). These results were mostly due to the higher frequen- cy of isolated post-challenge hyperglycemia in the older patients than in the younger group (28.8% vs. 9.2%). The use of both the FPG and HbA1c levels significantly enhanced the low diagnostic power when employing only the FPG levels in the older group (71.2% vs. 45.5%).
Conclusion: In the older patients, the 2-h PG level was the most accurate diagnostic criterion. When we consider the costs and convenience, a combination of the FPG and HbA1c criteria may be recommended as a screening test for DM in older people.
Keywords: Age; Diabetes mellitus; Postprandial glucose
Corresponding author: Bon Jeong Ku https://orcid.org/0000-0002-3414-8949 Department of Internal Medicine, Chungnam National University School of Medicine, 266 Munhwa-ro, Jung-gu, Daejeon 35015, Korea
E-mail: [email protected]
INTRODUCTION
Type 2 diabetes mellitus (T2DM) has become a major medical concern because of continuing increases in prevalence, associ- ated mortality, and medical costs. According to the 2017 Na- tional Diabetes Statistics report, diabetes affects 30.3 million people, or 9.4% of the population in the United States, and its prevalence increases with age [1]. It is common for T2DM to remain undiagnosed for at least 4 to 7 years, and chronic com- plications are already evident in >30% of newly diagnosed pa-
tients, even in those exhibiting impaired glucose tolerance [2- 5]. Several studies have shown that early T2DM detection us- ing optimal screening tests not only lowers the risk of chronic complications but also reduces the economic burden [6,7].
Thus, diabetes is increasingly screened for in populations with high risk factors, such as race, age, and a high body mass index (BMI).
Since an international expert committee suggested that the 2-hour plasma glucose level after the 75 g oral glucose toler- ance test (OGTT) (2-hour postload glucose [2-h PG] level) be https://doi.org/10.4093/dmj.2018.42.2.147
pISSN 2233-6079 · eISSN 2233-6087
replaced by measurement of glycosylated hemoglobin (HbA1c) levels [8], the fasting plasma glucose (FPG) and/or the HbA1c level have been used to screen for diabetes because of conve- nience and low cost. However, both approaches have certain limitations. A recent study showed that the FPG is less sensi- tive than the 2-h PG level, especially in older adults [9]. Some studies indicated that the HbA1c level cutoff values should dif- fer according to ethnicity and age [10-12]. A recent survey performed in the United States reported that the prevalence of diabetes varied depending on the diagnostic criteria employed [13]. Screening test limitations can create diagnostic errors; in- deed, approximately 30% of individuals with diabetes are, in fact, undiagnosed. Because the peak prevalence of diabetes oc- curs in adults aged ≥65 years [1,14], the assumption might be that most cases of undiagnosed diabetes among those ≥18 years of age occur in adults aged ≥65 years. However, no opti- mal age-specific screening methods, or age-specific cutoff val- ues have yet been defined.
The present study sought to define the clinical characteristics and the diagnostic rates of T2DM produced by various criteria in different age groups to determine the efficacy of each criteri- on for screening. We also aimed to define cutoff values that would reduce false-negative diagnoses.
METHODS
Study population
We retrospectively selected 62,248 adults aged 18 years or old- er without typical hyperglycemic symptoms who returned for re-evaluation of hyperglycemia at the Diabetes Center at Chungnam National University Hospital from March 2011 to February 2016. Among these patients, we only included 783 who had undertaken the OGTT and measurement of the HbA1c level. We excluded 40 patients previously diagnosed with diabetes and/or those treated with hypoglycemic agents, 214 with anemia, six with end-stage renal disease, and eight treated with anticancer chemotherapies or hyperglycemia-in- ducing agents, such as glucocorticoids, interferon γ, and thia- zides. According to the inclusion and exclusion criteria, finally, 515 patients were included in this study. A diagnosis of diabe- tes mellitus (DM) was made by reference to one or more of the three 2015 criteria of the American Diabetes Association [15].
To identify whether the efficacy of the diagnostic criteria dif- fered for younger (<65 years of age) and older (≥65 years of age) adults, we separated all patients into younger (n=274) and
older (n=241) groups. Baseline age, sex, weight, height, blood pressure (BP), smoking status, alcohol consumption, and clini- cal histories (including medical treatment) were acquired by chart review or telephone inquiry. This work was supported by research fund of Chungnam National University. The protocol for this research was approved by the Institutional Review Board (2016-05-040-001) of Chungnam National University Hospital and written informed consent was provided to all of the participants.
Biochemical analyses
After an overnight fast (≥8 hours), blood samples were col- lected to estimate the FPG, fasting insulin, C-peptide, HbA1c, triglyceride, total cholesterol, high-density lipoprotein choles- terol (HDL-C) and low density lipoprotein cholesterol (LDL- C), blood urea nitrogen, and creatinine levels. At 2 hours after ingestion of the 75 g glucose, blood samples were collected to estimate the glucose, insulin, and C-peptide levels. All mea- surements were performed with the aid of an automated blood chemistry analyzer (Hitachi 747; Hitachi, Tokyo, Japan). The HbA1c levels were measured using an accredited automated analyzer (the HLC-723G7 hemoglobin analyzer; Tosoh Corp., Tokyo, Japan) employing high-performance liquid chromatog- raphy [16].
Calculations
BMI (kg/m2) was calculated as weight (kg)/[height (m)]2. The homeostasis model was used to assess insulin resistance (HOMA-IR) and β-cell function (HOMA-β) [17]. The HOMA- IR was calculated as the FPG level (mg/dL)×the insulin level (µIU/mL)/405. The HOMA-β was calculated as 360×the insu- lin level (µIU/mL)/[the FPG level (mg/dL)–63]. The estimated glomerular filtration rate (eGFR, mL/min/1.73 m2) was calcu- lated using the abbreviated Modification of Diet in Renal Dis- ease algorithm of the National Institutes of Health (NIH).
Statistical analyses
All statistical analyses were performed using SPSS version 22.0 (IBM Co., Armonk, NY, USA) and Medcalc version 16.4.3 (MedCalc, Ostend, Belgium) software. Categorical variables are presented as percentages and were compared using the chi- square test. Continuous variables are presented as mean±
standard deviation (SD) and were compared with the aid of the independent two-sample Student t-tests. A two-sided P<0.05 was considered to reflect statistical significance. Receiver oper-
ating characteristic (ROC) curves were plotted for older pa- tients diagnosed with diabetes; we evaluated HbA1c, FPG, and 2-h PG levels. In general, an area under the curve (AUC) was considered to be high (AUC >0.9), moderate (0.7< AUC ≤0.9), or low (0.5< AUC ≤0.7) in terms of diagnostic utility. Newly
proposed cutoff values were based on the highest Youden indi- ces of the various cutoff points, as described previously [18].
RESULTS
Clinical characteristics
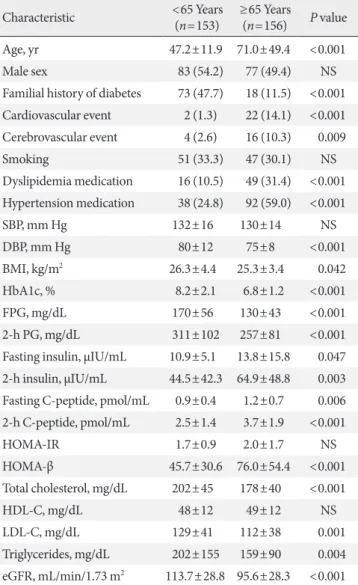
Of the 515 patients meeting the inclusion criteria, we enrolled 74 patients exhibiting normal glucose tolerances, 132 diag- nosed with prediabetes, and 309 diagnosed with DM; we grouped all patients by age as younger (<65 years) or older (≥65 years). Table 1 lists the clinical and laboratory features of patients with DM by age group. To explore whether these char- acteristics varied by age, we compared younger and older pa- tients. We found no difference in the sex ratio, smoking histo- ry, systolic BP, HOMA-IR score, or HDL-C level between the groups. Older patients tended to have medical histories of car- diovascular and cerebrovascular disease, dyslipidemia, and hy- pertension but were less likely to have a family history of dia- betes. Additionally, older patients had a significantly lower BMI and diastolic BP, reduced total and LDL-C and triglycer- ide levels, a lower eGFR, and reduced HbA1c, FPG, and 2-h PG levels. Interestingly, older patients showed significantly higher fasting and 2-hour insulin and C-peptide levels and better β-cell function (HOMA-β scores), than younger pa- tients.
Utility of HbA1c, FPG, and 2-h PG tests for the diagnosis of DM in younger and older adults
To explore whether the efficacy of the diagnostic DM criteria varied by age, we measured the diagnostic rate according to various criteria (Table 2) and the number of criteria met by younger and older patients (Table 3). With regard to younger patients 81% were diagnosed by HbA1c and FPG and 91.5%
Table 1. Comparison of clinical and laboratory characteristics of study patients stratified by age
Characteristic <65 Years
(n=153) ≥65 Years
(n=156) P value
Age, yr 47.2±11.9 71.0±49.4 <0.001
Male sex 83 (54.2) 77 (49.4) NS
Familial history of diabetes 73 (47.7) 18 (11.5) <0.001 Cardiovascular event 2 (1.3) 22 (14.1) <0.001 Cerebrovascular event 4 (2.6) 16 (10.3) 0.009
Smoking 51 (33.3) 47 (30.1) NS
Dyslipidemia medication 16 (10.5) 49 (31.4) <0.001 Hypertension medication 38 (24.8) 92 (59.0) <0.001
SBP, mm Hg 132±16 130±14 NS
DBP, mm Hg 80±12 75±8 <0.001
BMI, kg/m2 26.3±4.4 25.3±3.4 0.042
HbA1c, % 8.2±2.1 6.8±1.2 <0.001
FPG, mg/dL 170±56 130±43 <0.001
2-h PG, mg/dL 311±102 257±81 <0.001
Fasting insulin, µIU/mL 10.9±5.1 13.8±15.8 0.047 2-h insulin, µIU/mL 44.5±42.3 64.9±48.8 0.003 Fasting C-peptide, pmol/mL 0.9±0.4 1.2±0.7 0.006 2-h C-peptide, pmol/mL 2.5±1.4 3.7±1.9 <0.001
HOMA-IR 1.7±0.9 2.0±1.7 NS
HOMA-β 45.7±30.6 76.0±54.4 <0.001
Total cholesterol, mg/dL 202±45 178±40 <0.001
HDL-C, mg/dL 48±12 49±12 NS
LDL-C, mg/dL 129±41 112±38 0.001
Triglycerides, mg/dL 202±155 159±90 0.004 eGFR, mL/min/1.73 m2 113.7±28.8 95.6±28.3 <0.001 Values are presented as mean±standard deviation or number (%). P values were calculated by independent Student t-test or the chi-square test.
NS, not significant; SBP, systolic blood pressure; DBP, diastolic blood pressure; BMI, body mass index; HbA1c, glycosylated hemoglobin;
FPG, fasting plasma glucose; 2-h PG, 2-hour postload glucose;
HOMA-IR, homeostasis model assessment-insulin resistance;
HOMA-β, homeostasis model assessment-β-cell function; HDL-C, high density lipoprotein cholesterol; LDL-C, low density lipoprotein cholesterol; eGFR, estimated glomerular filtration rate.
Table 2. The prevalence of diabetes using HbA1c, FPG, and 2-h PG criteria according to age group
Diagnostic criterion <65 Years
(n=153) ≥65 Years
(n=156) P value
HbA1c 124 (81) 96 (61.5) <0.001
FPG 124 (81) 71 (45.5) <0.001
2-h PG 140 (91.5) 132 (84.6 ) NS
Values are presented as number (%). P values were calculated by the chi-square test.
HbA1c, glycosylated hemoglobin; FPG, fasting plasma glucose; 2-h PG, 2-hour postload glucose; NS, not significant.
by 2-h PG; while 61.5% of older patients were diagnosed by HbA1c, 45.5% by FPG, and 84.6% by 2-h PG (Table 2). Table 3 showed the subanalysis of these results according to the num- ber of criteria met by younger and older patients. In the former group, 70.8% met all three diagnostic criteria, but this figure fell to 32.7% among older patients. Of the younger group, 12.4% met two of the diagnostic criteria; this proportion rose to 26.3% in the older group. A total of 17% of younger DM pa- tients but 41% of older patients met only one DM diagnostic criterion. Because the FPG test was used to screen for DM, we explored the numbers of DM cases missed using this criterion.
We found that this approach to screening was associated with a 19% under-diagnosis rate (HbA1c+2-h PG, 6.5%; HbA1c, 3.3%; 2-h PG, 9.2%) among younger patients but a 54.4% rate (HbA1c+2-h PG, 17.3%; HbA1c, 8.3%; 2-h PG, 28.8%) in old- er patients. The use of both the HbA1c and FPG levels to screen for DM missed 9.2% of younger and 28.8% of older pa- tients. In other words, the prevalence of isolated post-challenge hyperglycemia (IPH) was much higher in the older than the younger group. Thus, older patients were often incorrectly di- agnosed even when screened using both the FPG and HbA1c levels.
Problems associated with the use of the FPG test to screen for DM in older adults
Because the FPG test is commonly employed to screen for DM in Korea, we determined the false-negative rate associated with
such an approach (Table 4). Diagnosis of DM was missed in 24 of 106 younger patients (22.6%) with normal (<100 mg/dL) or impaired fasting glucose levels (≥100 and <126 mg/dL) and 72 of 114 older patients (63.2%) with normal or impaired fast- ing glucose levels. According to the subgroup analysis, DM in patients with normal FPG levels was missed in 1.89% of younger and 9.65% of older patients, and DM in patients with impaired fasting glucose levels was missed in 20.75% of young- er and 53.51% of older patients. In other words, we may misdi- agnose almost two in 10 younger patients and six in 10 older patients with normal or impaired fasting glucose level. These results suggested that recent FPG levels for DM diagnosis had very low diagnostic power, especially in older patients.
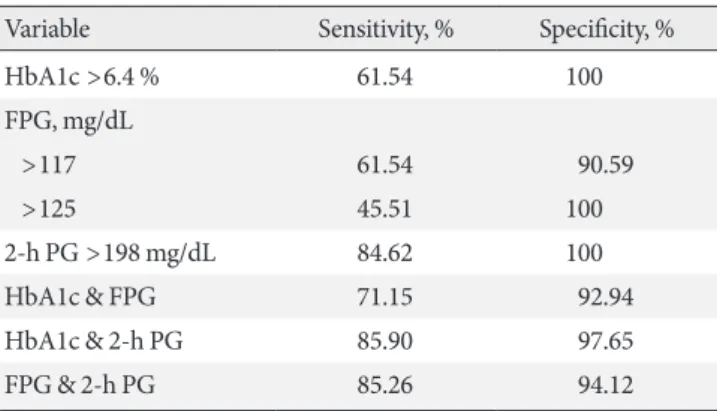
Ideal diagnostic methods for DM diagnosis in older adults We sought to define ideal diagnostic methods which would re- duce false-negative DM diagnoses; we recalculated the sensi- tivities, specificities, and the AUCs of the DM diagnostic crite- ria using different thresholds for older patients (Table 5, Fig. 1).
The ROC curves revealed the diagnostic efficacy of the HbA1c, FPG, and 2-h PG levels used alone for DM diagnosis; we also determined those of HbA1c+FPG, HbA1c+2-h PG, and FPG+2-h PG when two criteria were employed. The AUCs were 0.859 (95% confidence interval [CI], 0.809 to 0.901) for the HbA1c level; 0.817 (95% CI, 0.762 to 0.869) for the FPG level; 0.946 (95% CI, 0.910 to 0.971) for the 2-h PG level; 0.884 (95% CI, 0.836 to 0.921) for HbA1c+FPG; 0.966 (95% CI, 0.935 to 0.985) for HbA1c+2-h PG; and 0.959 (95% CI, 0.925 to 0.980) for FPG+2-h PG. Thus, when only one criterion was used, the best result was from the 2-h PG AUC, and the HbA1c+2-h PG AUC was best when two criteria were em- ployed. Reducing the FPG cutoff from 126 to 118 mg/dL in- creased the DM diagnostic sensitivity from 45.51% to 61.54%
Table 3. Percentage of patients stratified by number of diag- nostic criteria satisfied according to age group
No. of satisfied DM
diagnostic criteria <65 Years
(n=153) ≥65 Years
(n=156) P value
3 108 (70.6) 51 (32.7) <0.001
2 19 (12.4) 41 (26.3) 0.002
HbA1c+FPG 1 (0.7) 5 (3.2) NS
HbA1c+2-h PG 10 (6.5) 27 (17.3) 0.005
FPG+2-h PG 8 (5.2) 9 (5.8) NS
1 26 (17.0) 64 (41.0) <0.001
HbA1c 5 (3.3) 13 (8.3) NS
FPG 7 (4.6) 6 (3.8) NS
2-h PG 14 (9.2) 45 (28.8) <0.001
Values are presented as number (%). P values were calculated by the chi-square test.
DM, diabetes mellitus; HbA1c, glycosylated hemoglobin; FPG, fasting plasma glucose; NS, not significant; 2-h PG, 2-hour postload glucose.
Table 4. Percentage of patients who met 2-h PG criteria among patients with undiagnosed diabetes using FPG levels
FPG, mg/dL
2-h PG, mg/dL
<65 Years (n=106) ≥65 Years (n=114)
<140 ≥200 <140 ≥200
<100 58 (54.72) 2 (1.89) 19 (16.67) 11 (9.65) 100–125 24 (22.64) 22 (20.75) 23 (20.17) 61 (53.51) Subtotal 82 (77.36) 24 (22.64) 42 (36.84) 72 (63.16) Values are presented as number (%).
2-h PG, 2-hour postload glucose; FPG, fasting plasma glucose.
and reduced the specificity from 100% to 90.59%.
DISCUSSION
The prevalence of DM using various diagnostic criteria varied more in adults aged ≥65 years (the older group) than in adults
aged <65 years (the younger group). Of the 156 older patients, DM was diagnosed in 132 (84.6%) using the 2-h PG criterion but in only 71 (45.5%) and 96 (61.5%) using the FPG and HbA1c criteria, respectively. These results are important be- cause 64 older patients (41%) met only one criterion, usually the 2-h PG level (28.8%). Because most of the older patients were diagnosed using this criterion, the 2-h PG level appeared to be more sensitive (84.6%) than the FPG (45.5%) or HbA1c (61.54%) level. The 2-h PG level exhibited a sensitivity similar to that of combinations of the 2-h PG and HbA1c (85.9%) or FPG (85.3%) levels and a higher sensitivity than the combina- tion of the FPG and HbA1c levels (71.2%). The low diagnostic power of FPG could be enhanced by reducing the FPG cutoff values from 126 to 118 mg/dL which provided the best combi- nation of sensitivity and specificity.
One study found that patients who met only the 2-h PG cri- terion were significantly older and had lower BMIs than those who met only the FPG criterion [9]. Another study found that use of the FPG criterion in Asian populations missed approxi- mately 45% of all diabetes patients, and those with IPH, which was defined as a 2-h PG level ≥200 mg/dL after OGTT but a Table 5. Sensitivity and specificity of diagnostic criteria for dia-
betes mellitus in the older group
Variable Sensitivity, % Specificity, %
HbA1c >6.4 % 61.54 100
FPG, mg/dL
>117 61.54 90.59
>125 45.51 100
2-h PG >198 mg/dL 84.62 100
HbA1c & FPG 71.15 92.94
HbA1c & 2-h PG 85.90 97.65
FPG & 2-h PG 85.26 94.12
HbA1c, glycosylated hemoglobin; FPG, fasting plasma glucose; 2-h PG, 2-hour postload glucose.
Fig. 1. Receiver operating characteristic curves. (A) Single diagnostic criterion and (B) combination of two diagnostic criteria for screening of diabetes mellitus in the older group. (A) When the single criterion was used, area under the curve (AUC) of glycosyl- ated hemoglobin (HbA1c) was 0.859 (95% confidence interval [CI], 0.809 to 0.901), the AUC of fasting plasma glucose (FPG) was 0.817 (95% CI, 0.762 to 0.863), and the AUC of 2-hour plasma glucose (2-h PG) after the 75 g oral glucose tolerance test, which was the largest, was 0.946 (95% CI, 0.910 to 0.971). (B) When the combination of two criteria was used, the AUC of HbA1c and FPG was 0.884 (95% CI, 0.836 to 0.921), the AUC of HbA1c and 2-h PG, which was the largest, was 0.966 (95% CI, 0.935 to 0.985), and the AUC of FPG and 2-h PG was 0.959 (95% CI, 0.925 to 0.980).
100 80 60 40 20 0
100 80 60 40 20 0
Sensitivity (%) Sensitivity (%)
0 20 40 60 80 100 0 20 40 60 80 100
100-Specificity 100-Specificity
HbA1c HbA1c & FPG
FPG HbA1c & 2-h PG
2-h PG FPG & 2-h PG
A B
fasting glucose level <126 mg/dL [19]. Such patients tended to be older than those diagnosed by the FPG criterion (60 years vs. 53 years). However, as all included patients were relatively young, no subgroup analysis by age was performed. Although the prevalence of diabetes increases with age, very few authors have researched elderly-onset diabetes. Aging is associated with a progressive decline in glucose tolerance caused by many factors, including reduced physical activity, abdominal obesity, sarcopenia, and dysfunctional insulin secretion; these factors increase the prevalence of T2DM and impair glucose tolerance in older adults [13,20-22]. Some studies have found that dys- functional insulin secretion may be an important contributor to the IPH, which is common in those aged >60 years [23-25].
However, we found that although IPH was more common in older patients than the younger group (28.8% vs. 9.2%), the HOMA-IR (the insulin resistance), did not differ between the two age groups and the HOMA-β (the islet β-cell function), was much more efficient in older than younger patients. In our study, all the HbA1c, FPG, and 2-h PG levels were significantly lower in the older group than in the younger group. These re- sults indicate that the older group may have less glucose intoxi- cation than the younger group, which preserves their islet β-cell function.
We reduced the FPG cutoff value from 140 to 126 mg/dL in an effort to resolve the discordance between the 2-h PG and FPG criteria [26]. However, the diagnostic power of the FPG level did not increase significantly because of the high inci- dence of IPH in all diabetes patients [19]. Recent studies found that a high 1-hour PG in people with normal glucose tolerance predicted islet β-cell dysfunction and future DM [27,28]. These results suggested that the postprandial glucose level may change more rapidly than the FPG level. Therefore, some re- searchers recommend that patients with impaired fasting glu- cose levels and a high FPG level should proceed with the OGTT to detect more patients with DM [29]. We found that the FPG test produced more false-negative diagnoses of diabe- tes in older than in younger diabetic patients (54.5% vs. 19%, respectively). As the prevalence of diabetes peaks at >60 years of age, missed diagnoses will be much more common among older patients than among patients of all ages. This suggests that the 126 mg/dL FPG level is less useful when screening older than younger adults.
HbA1c, generated by a non-enzymatic reaction between glucose and hemoglobin, was discovered in 1968 [30]. Elevat- ed HbA1c levels in diabetic patients were first reported in 1969
[31] and were shown to indicate aggravated glucose levels over a 3-month period [32]. Since the HbA1c level was included as a diagnostic criterion by the American Diabetes Association in 2010, many researchers have explored its diagnostic efficacy and have examined the optimal cutoff values [10,33-36]. These studies suggested that the HbA1c level was of low sensitivity when used to screen for diabetes, and the authors concluded that the cutoff values had to be reduced to increase sensitivity.
Additionally, the optimal cutoff values varied slightly with the characteristics of particular study populations. In a Korean population, the HbA1c level was higher in older than in younger patients with similar glucose profiles, and it was more diagnostically accurate than the FPG level in older patients [10,37]. We obtained similar results, as the HbA1c level was of greater diagnostic efficacy than the FPG level in older patients (61.5% vs. 45.5%, respectively), although these patients had lower HbA1c levels than younger patients because of reduced glucose profiles.
Although it is known that the 2-h PG test, followed by the 75 g OGTT, afford the best sensitivity and specificity of all current diabetic criteria, the FPG test is most commonly used for screen- ing because it is very convenient. Measurement of HbA1c levels in the absence of fasting is easier than employing the FPG method. Therefore, a combination of two criteria, the FPG and the HbA1c levels, would lower the false-negative rate of dia- betic diagnosis. One study sought to verify this hypothesis, but found that a combination of FPG and HbA1c levels did not seem to afford any additional benefit when screening for dia- betes [34]. On the other hand, another study found that a com- bination of FPG and HbA1c levels did increase the diagnostic power for diabetes [38]. We found that a combination of the FPG and HbA1c levels increased the accuracy of diabetic diag- nosis. In younger patients, the prevalence of diabetes rose from 81% when the FPG or HbA1c level was used alone for diagno- sis, to 90.8% when the two criteria were combined. In older patients, the prevalence of diabetes rose from 45.5% and 61.5%, respectively, when the FPG and HbA1c criteria were used alone, to 71.2% when the two criteria were combined.
The diagnostic rate afforded by a combination of the FPG and HbA1c levels attained a level similar to that afforded by appli- cation of the 2-h PG criterion (90.8% vs. 91.5%) in younger patients, but did not achieve the diagnostic rate produced by the 2-h PG criterion in older patients (71.2% vs. 84.6%).
In summary, older patients had a higher prevalence of IPH, but nevertheless, exhibited preserved insulin secretion and did
not progress to insulin resistance. Older patients were diag- nosed least often using the FPG criterion and most often em- ploying the 2-h PG criterion. To enhance DM diagnosis in el- derly individuals, the FPG and 2-h PG test may be recom- mended. As cost and convenience must always be considered, a combination of the FPG and HbA1c criteria, or a reduction in the FPG criterion, could also be used to screen for DM in older patients. The limitations of our study include our small study population and selection bias attributable to the fact that most of patients with suspected hyperglycemia were recruited in a tertiary teaching hospital located in an urban region.
Therefore, large longitudinal studies are needed to establish age-specific diagnostic criteria to enable individualized diag- noses, especially in adults aged ≥65 years, who have the high- est prevalence of diabetes.
CONFLICTS OF INTEREST
No potential conflict of interest relevant to this article was re- ported.
REFERENCES
1. The Centers for Disease Control and Prevention (CDC): Na- tional diabetes statistics report 2017. Available from: https://
www.cdc.gov/diabetes/data/statistics/statistics-report.html (updated 2017 Jul 17).
2. Harris MI, Klein R, Welborn TA, Knuiman MW. Onset of NI- DDM occurs at least 4-7 yr before clinical diagnosis. Diabetes Care 1992;15:815-9.
3. Harris MI. Undiagnosed NIDDM: clinical and public health issues. Diabetes Care 1993;16:642-52.
4. Wang FH, Liang YB, Zhang F, Wang JJ, Wei WB, Tao QS, Sun LP, Friedman DS, Wang NL, Wong TY. Prevalence of diabetic retinopathy in rural China: the Handan Eye Study. Ophthal- mology 2009;116:461-7.
5. Barrett-Connor E, Ferrara A. Isolated postchallenge hypergly- cemia and the risk of fatal cardiovascular disease in older women and men. The Rancho Bernardo Study. Diabetes Care 1998;21:1236-9.
6. Gillies CL, Lambert PC, Abrams KR, Sutton AJ, Cooper NJ, Hsu RT, Davies MJ, Khunti K. Different strategies for screening and prevention of type 2 diabetes in adults: cost effectiveness analysis. BMJ 2008;336:1180-5.
7. CDC Diabetes Cost-Effectiveness Study Group, Centers for
Disease Control and Prevention. The cost-effectiveness of screening for type 2 diabetes. JAMA 1998;280:1757-63.
8. International Expert Committee. International Expert Com- mittee report on the role of the A1C assay in the diagnosis of diabetes. Diabetes Care 2009;32:1327-34.
9. Huang J, Ou HY, Karnchanasorn R, Samoa R, Chuang LM, Chiu KC, Feng W. Clinical implication of fasting and post- challenged plasma glucose in diagnosis of diabetes mellitus.
Endocrine 2015;48:511-8.
10. Lee H, Oh JY, Sung YA, Kim DJ, Kim SH, Kim SG, Moon S, Park IeB, Rhee EJ, Chung CH, Kim BJ, Ku BJ. Optimal hemo- globin A1C cutoff value for diagnosing type 2 diabetes mellitus in Korean adults. Diabetes Res Clin Pract 2013;99:231-6.
11. Lu ZX, Walker KZ, O’Dea K, Sikaris KA, Shaw JE. A1C for screening and diagnosis of type 2 diabetes in routine clinical practice. Diabetes Care 2010;33:817-9.
12. Kumar PR, Bhansali A, Ravikiran M, Bhansali S, Dutta P, Thakur JS, Sachdeva N, Bhadada SK, Walia R. Utility of glycat- ed hemoglobin in diagnosing type 2 diabetes mellitus: a com- munity-based study. J Clin Endocrinol Metab 2010;95:2832-5.
13. Kirkman MS, Briscoe VJ, Clark N, Florez H, Haas LB, Halter JB, Huang ES, Korytkowski MT, Munshi MN, Odegard PS, Pratley RE, Swift CS. Diabetes in older adults. Diabetes Care 2012;35:2650-64.
14. Korea Centers for Disease Control and Prevention (KCDC) and the Korean Ministry of Health and Welfare: Diabetes Fact Sheet in Korea 2016. Available from: http://www.diabetes.
or.kr/temp/KDA_fact_sheet%202016.pdf (cited 2017 Dec 18).
15. American Diabetes Association. (2) Classification and diagno- sis of diabetes. Diabetes Care 2015;38 Suppl:S8-16.
16. International Federation of Clinical Chemistry and Laboratory Medicine, IFCC Scientific Division, Mosca A, Goodall I, Hoshino T, Jeppsson JO, John WG, Little RR, Miedema K, My- ers GL, Reinauer H, Sacks DB, Weykamp CW. Global stan- dardization of glycated hemoglobin measurement: the position of the IFCC Working Group. Clin Chem Lab Med 2007;45:
1077-80.
17. Matthews DR, Hosker JP, Rudenski AS, Naylor BA, Treacher DF, Turner RC. Homeostasis model assessment: insulin resis- tance and beta-cell function from fasting plasma glucose and insulin concentrations in man. Diabetologia 1985;28:412-9.
18. Hajian-Tilaki K. Receiver operating characteristic (ROC) curve analysis for medical diagnostic test evaluation. Caspian J Intern Med 2013;4:627-35.
19. Qiao Q, Nakagami T, Tuomilehto J, Borch-Johnsen K, Balkau
B, Iwamoto Y, Tajima N; International Diabetes Epidemiology Group; DECODA Study Group. Comparison of the fasting and the 2-h glucose criteria for diabetes in different Asian cohorts.
Diabetologia 2000;43:1470-5.
20. Chang AM, Halter JB. Aging and insulin secretion. Am J Physiol Endocrinol Metab 2003;284:E7-12.
21. Barzilai N, Huffman DM, Muzumdar RH, Bartke A. The criti- cal role of metabolic pathways in aging. Diabetes 2012;61:1315- 22.
22. Ohn JH, Kwak SH, Cho YM, Lim S, Jang HC, Park KS, Cho NH. 10-Year trajectory of β-cell function and insulin sensitivity in the development of type 2 diabetes: a community-based prospective cohort study. Lancet Diabetes Endocrinol 2016;
4:27-34.
23. Chen M, Halter JB, Porte D Jr. The role of dietary carbohydrate in the decreased glucose tolerance of the elderly. J Am Geriatr Soc 1987;35:417-24.
24. Garcia GV, Freeman RV, Supiano MA, Smith MJ, Galecki AT, Halter JB. Glucose metabolism in older adults: a study includ- ing subjects more than 80 years of age. J Am Geriatr Soc 1997;
45:813-7.
25. Chen M, Bergman RN, Pacini G, Porte D Jr. Pathogenesis of age-related glucose intolerance in man: insulin resistance and decreased beta-cell function. J Clin Endocrinol Metab 1985;60:
13-20.
26. Report of the expert committee on the diagnosis and classifica- tion of diabetes mellitus. Diabetes Care 1997;20:1183-97.
27. Oh TJ, Lim S, Kim KM, Moon JH, Choi SH, Cho YM, Park KS, Jang H, Cho NH. One-hour postload plasma glucose concen- tration in people with normal glucose homeostasis predicts fu- ture diabetes mellitus: a 12-year community-based cohort study. Clin Endocrinol (Oxf) 2017;86:513-9.
28. Oh TJ, Min SH, Ahn CH, Kim EK, Kwak SH, Jung HS, Park KS, Cho YM. Normal glucose tolerance with a high 1-hour postload plasma glucose level exhibits decreased β-cell func- tion similar to impaired glucose tolerance. Diabetes Metab J 2015;39:147-53.
29. Oh JY, Lim S, Kim DJ, Kim NH, Kim DJ, Moon SD, Jang HC, Cho YM, Song KH, Ahn CW, Sung YA, Park JY, Shin C, Lee
HK, Park KS; Committee of the Korean Diabetes Association on the Diagnosis and Classification of Diabetes Mellitus. A re- port on the diagnosis of intermediate hyperglycemia in Korea:
a pooled analysis of four community-based cohort studies. Di- abetes Res Clin Pract 2008;80:463-8.
30. Bookchin RM, Gallop PM. Structure of hemoglobin AIc: na- ture of the N-terminal beta chain blocking group. Biochem Biophys Res Commun 1968;32:86-93.
31. Rahbar S, Blumenfeld O, Ranney HM. Studies of an unusual hemoglobin in patients with diabetes mellitus. Biochem Bio- phys Res Commun 1969;36:838-43.
32. Koenig RJ, Peterson CM, Jones RL, Saudek C, Lehrman M, Ce- rami A. Correlation of glucose regulation and hemoglobin AIc in diabetes mellitus. N Engl J Med 1976;295:417-20.
33. Kramer CK, Araneta MR, Barrett-Connor E. A1C and diabetes diagnosis: The Rancho Bernardo Study. Diabetes Care 2010;33:
101-3.
34. Mannucci E, Ognibene A, Sposato I, Brogi M, Gallori G, Bar- dini G, Cremasco F, Messeri G, Rotella CM. Fasting plasma glucose and glycated haemoglobin in the screening of diabetes and impaired glucose tolerance. Acta Diabetol 2003;40:181-6.
35. Karnchanasorn R, Huang J, Ou HY, Feng W, Chuang LM, Chiu KC, Samoa R. Comparison of the current diagnostic criterion of hba1c with fasting and 2-hour plasma glucose concentra- tion. J Diabetes Res 2016;2016:6195494.
36. Liu Y, Xiao X, Sun C, Tian S, Sun Z, Gao Y, Li Y, Cheng J, Lv Y, Li M, Li Z, Zhang Y, Wang G, Liu Y, Gao Y, Zhu L, Liu Y, Wang G. Ideal glycated hemoglobin cut-off points for screening dia- betes and prediabetes in a Chinese population. J Diabetes In- vestig 2016;7:695-702.
37. Kim JH, Shin JH, Lee HJ, Kim SY, Bae HY. Discordance be- tween HbA1c and fasting plasma glucose criteria for diabetes screening is associated with obesity and old age in Korean indi- viduals. Diabetes Res Clin Pract 2011;94:e27-9.
38. Ahn CH, Yoon JW, Hahn S, Moon MK, Park KS, Cho YM.
Evaluation of non-laboratory and laboratory prediction mod- els for current and future diabetes mellitus: a cross-sectional and retrospective cohort study. PLoS One 2016;11:e0156155.