allergy allergy
Copyright © 2017. Asia Pacific Association of Allergy, Asthma and Clinical Immunology.
Characteristics of airborne pollen in Incheon and Seoul (2015–2016)
Hye Ju So1, Soon Jeong Moon2, Seon Yeong Hwang1, Jeong Hee Kim1,2, Hae Ji Jang1, Jung Heum Jo3, Tae Jung Sung4, and Dae Hyun Lim1,2,*
1The Environmental Health Center for Allergic Rhinitis, Inha University Hospital, Incheon 22332, Korea
2Department of Pediatrics, Inha University Hospital, Incheon 22332, Korea
3The Environmental Health Center for Asthma, Korea University Anam Hospiral, Ansan 15355, Korea
4Department of Pediatrics, Hallym University Kangnam Sacred Heart Hospital, Seoul 07441, Korea
Background: Pollen allergens are one of the main contributors to the development and/or aggravation of allergic rhinitis, allergic conjunctivitis, and asthma.
Objective: An examination of the airborne pollen in residential areas should be conducted to aid the diagnosis and treatment of allergic diseases.
Methods: Airborne pollen samples were collected from 2 sites in Incheon and 2 in Seoul from 2015 to 2016.
Results: The highest monthly concentration of airborne pollen was observed in May and September each year. Pollen from 32 families and 50 genera was identified over the 2 years; of these, Pinus spp. showed the highest pollen concentration (41.6%), followed by Quercus spp. (25.3%), and Humulus spp. (15.3%), the latter of which had the highest concentration among weed pollen.
The total pollen concentration was significantly higher in Incheon than in Seoul (p = 0.001 in 2015, p < 0.001 in 2016) and higher in 2016 than in 2015. The concentrations of pollen from weed species (Cupressaceae, Humulus spp., Artemisia spp., Ambrosia spp., and Chenopodiaceae) and grass species (Gramineae) were significantly higher (p < 0.001) than those from tree species. Pollen was distributed from February to November. The first pollen identified in both regions in each year was Alnus spp. Overall, the total concentration of Quercus spp., Betula spp., Humulus spp., Artemisia spp., Ambrosia spp., and Chenopodiaceae pollen increased significantly over the 2 years.
Conclusion: Region-specific differences exist in the pollen of major allergenic plants. Continuous monitoring of pollen is thus essential for management of pollen-related allergic disorders in each region.
Key words : Pollen; Allergens; Allergy
*Correspondence: Dae Hyun Lim
Department of Pediatrics, Inha University Hospital, 27 Inhang-ro, Jung-gu, Incheon 22332, Korea
Tel: +82-32-890-3658 Fax: +82-32-890-2629 E-mail: [email protected] Received: June 9, 2017 Accepted: July 11, 2017
This is an Open Access article distributed under the terms of the Creative Commons Attribution. Non-Commercial License (http://creativecommons.
org/licenses/by-nc/4.0/) which permits unrestricted non-commercial use, distribution, and reproduction in any medium, provided the original work is properly cited.
https://doi.org/10.5415/apallergy.2017.7.3.138 Asia Pac Allergy 2017;7:138-147
Original Article
Airborne pollen in Incheon and Seoul
INTRODUCTION
Airborne pollen is a potential cause of pollinosis, which is induced or exacerbated during the peak of the pollen season.
The most typical types of pollinosis are allergic rhinitis, asthma, allergic conjunctivitis, and atopic dermatitis [1-5]. Since the investigation of airborne pollen distributions is essential for the diagnosis and treatment of allergic diseases, multiple surveys and studies have been performed in the United States, Europe, and Japan [6-8]. Several studies have also carried out in South Korea to investigate the association of airborne pollen and climate with allergic diseases [9-16].
Airborne pollen concentrations vary by region and season;
thus, the use of reliable sampling methods is considered crucial for the continuous monitoring and analysis of pollen. The sampling sites need to be airy, easily accessible to facilitate the change of trapping drums, and appropriate to measure the airborne pollen distribution of the surrounding environment. In this study, we aimed to investigate pollen concentrations and seasons, changes in the major allergic pollen types, and regional differences over a 2-year period in Incheon and Seoul using pollen traps established at four different sites.
MATERIALS AND METHODS
Pollen sampling
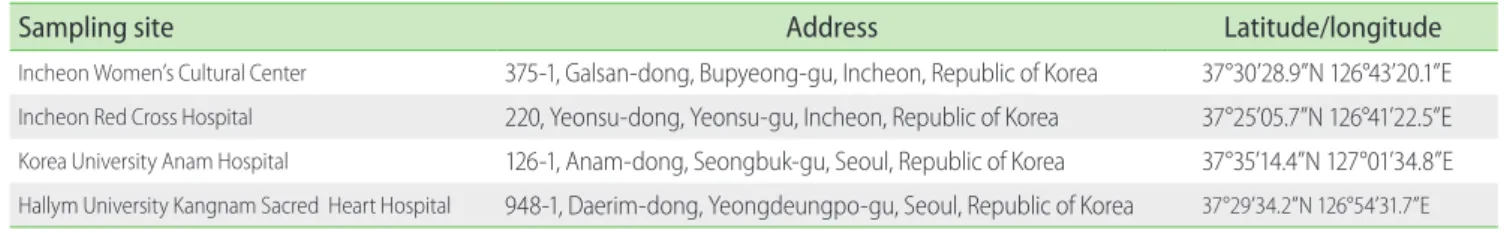
Pollen sampling was carried out in 4 sites, 2 in Incheon (Incheon Women’s Cultural Center at Galsan-dong and Incheon Red Cross Hospital at Yeonsu-dong) and 2 in Seoul (Korea University Anam Hospiral at Anam-dong and Hallym University Kangnam Sacred Heart Hospital at Daerim-dong) between January 1, 2015 and November 30, 2016 (Table 1).
Airborne pollen was sampled using a Burkard spore trap
(Burkard Scientific, Hertfordshire, UK) installed on the rooftop of each building. The Burkard sampler is a vacuum pump that continuously samples air particles for 7 days at a consistent flow rate of 10 L/min. Samples were retrieved weekly on the same day.
Pollen identification and observation
Pollen samples were stained with gentian violet solution (10-g gelatin, 60-mL glycerin, 1.0-mL 0.1% gentian violet in alcohol, 0.3- mL phenol, and 35-mL distilled water) and observed under an optical microscope at 400 magnification. Airborne pollen counts (grains/m3) were obtained by examining the central portions of the slides as suggested by the Pan-American Aerobiology Association and using the following equations:
Volume (m3) = field diameter of objective × flow rate drum rotation rate
Partides/(m3) = (counted/v)
where the field diameter of objective was, drum rotation was 33.33 μm/min, and the flow rate was 0.01 m3/min.
RESULTS
Airborne pollen types
Airborne pollen samples collected from the 4 sites in Incheon and Seoul comprised 32 families and 50 genera. Of these, 20 families and 35 genera were arboreal, whereas 12 families and 15 genera were herbaceous (Table 2). Pinus spp. showed the highest pollen concentration (41.6%), followed by Quercus spp. (25.3%), Humulus spp. (15.3%), Gingko spp. (15.0%), and a mix of Ulmus spp.
and Zelkova spp. (Ulmus spp./Zelkova spp.; 7.1%) (Fig. 1).
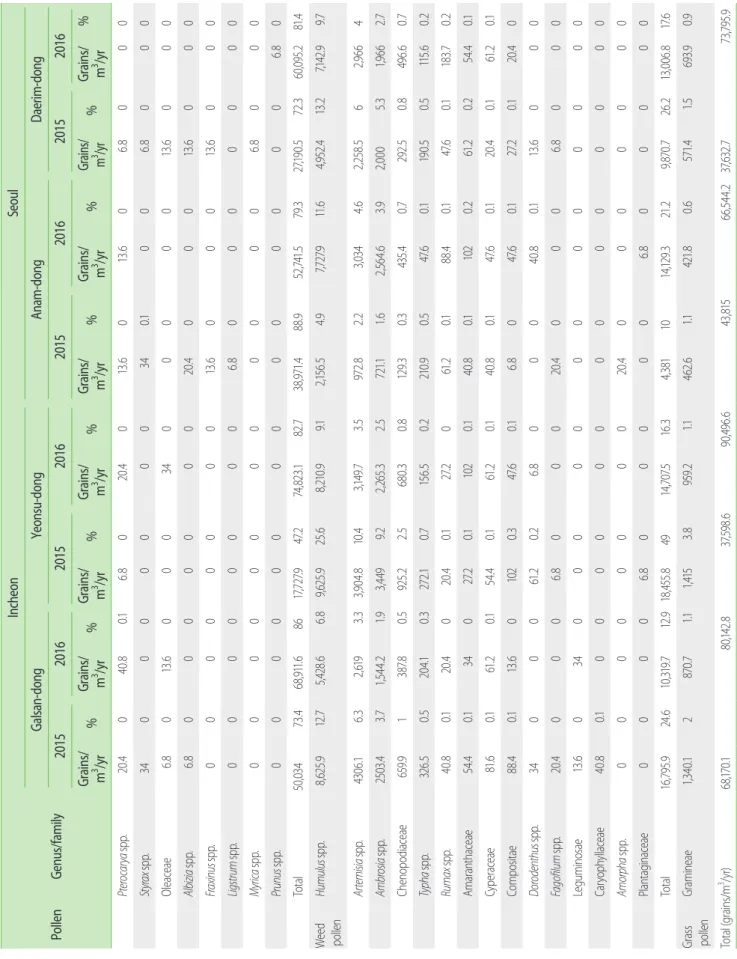
Pinus spp. pollen, which was the predominant tree pollen, showed the highest concentration at Galsan-dong, Incheon in
Table 1. Sampling sites in Incheon* and Seoul†
Sampling site Address Latitude/longitude
Incheon Women’s Cultural Center 375-1, Galsan-dong, Bupyeong-gu, Incheon, Republic of Korea 37°30’28.9”N 126°43’20.1”E Incheon Red Cross Hospital 220, Yeonsu-dong, Yeonsu-gu, Incheon, Republic of Korea 37°25’05.7”N 126°41’22.5”E Korea University Anam Hospital 126-1, Anam-dong, Seongbuk-gu, Seoul, Republic of Korea 37°35’14.4”N 127°01’34.8”E Hallym University Kangnam Sacred Heart Hospital 948-1, Daerim-dong, Yeongdeungpo-gu, Seoul, Republic of Korea 37°29’34.2”N 126°54’31.7”E
*Incheon Women’s Cultural Center at Galsan-dong and Incheon Red Cross Hospital at Yeonsu-dong. †Korea University Anam Hospiral at Anam-dong and Hallym University Kangnam Sacred Heart Hospital at Daerim-dong.
Fig. 1. Percentage of pollen concentration by genus in Incheon and Seoul over 2 years (2015 and 2016).
Table 2. List of pollen types recorded in Incheon and Seoul over 2 years (2015–2016)
Pollen Family Genus
Tree pollen Pinaceae Pinus spp.
Cedrus spp.
Fagaceae Quercus spp.
Castaneae spp.
Cyclobalanopsis spp.
Betulaceae Alnus spp.
Betula spp.
Carpinus spp.
Corylus spp.
Cupressaceae
Taxodiaceae Cryptomeria spp.
Metasequoia spp.
Ulmaceae Ulmus spp. + Zelkova spp.
Celtis spp.
Ginkgoaceae Ginkgo spp.
Juglandaceae Platycarya spp.
Juglans spp.
Pterocarya spp.
Moraceae Morus spp.
Rosaceae Prunus spp.
Others Salicaceae Salix spp.
Populus spp.
Oleaceae Fraxinus spp
Ligustrum spp.
Chionanthus spp Leguminosae Albizia spp.
Others Taxaceae
Platanaceae Platanus spp.
Anacardiaceae Rhus spp.
Aceraceae Acer spp.
Buxaceae Buxus spp.
Myricaceae Styraxjaponicus
20 families, 35 genera Weed pollen Cannabinaceae Humulus spp.
Compositae Ambrosia spp.
Pollen Family Genus
Artemisia spp.
Others Gramineae
Cyperaceae Chenopodiaceae
Polygonaceae Rumax spp.
Fagopyrum spp Aizoaceae Dorotheanthus spp.
Amaranthaceae
Typhaceae Typha spp.
Plantaginaceae Plantago spp.
Leguminosae Amorpha spp.
Caryophyllaceae
12 families, 15 genera
Total 32 families, 50 genera
Table 2. Continued
41.6 Pinus spp.
Quercus spp.
15.3 25.3
Humulus spp.
15.0 Ginkgo spp.
7.1 Ulmus spp + Zelcova spp.
6.4 Artemisia spp.
4.7 Ambrosia spp.
3.7 Morus spp.
3.6 Cupressaceae
Celtis spp. 2.0 Castanea spp. 2.0 Gramineae 1.9 Betula spp. 1.4 Alnusspp. 1.3
1.1 1.1 1.11.0 Plactycarya spp.
Chenopodiaceae Taxus spp.
Corylus spp.
0.9 0.6 0.6 0.6 0.60.4 0.3 0.20.2 0.1 0.1 0.1 0.1 0.1 0.10.1 0.1 0.1
Percentage of pollen concentration
0 10 20 30 40 50
Carpinus spp.
Populus spp.
Acer spp.
Sequia spp.
Salix spp.
Typha spp.
Juglans spp.
Leguminosae Cryptomeria spp.
Rumax spp.
Cyclobalanopsis spp.
Amaranthaceae Platanus spp.
Cyperaceae Cyperaceae Compositae Rhus spp.
Cedrus spp. Inchen Seoul
Airborne pollen in Incheon and Seoul
Table 3. Pollen concentration of tree, weed, and grass species recorded at Galsan-dong and Yeonsu-dong, Incheon and Anam-dong and Daerim-dong, Seoul in 2015 and 2016 PollenGenus/family IncheonSeoul Galsan-dongYeonsu-dongAnam-dongDaerim-dong 20152016201520162015201620152016
Grains/ m%3 /yr
Grains/ m%3 /yr
Grains/ m%3 /yr
Grains/ m%3 /yr
Grains/ m%3 /yr
Grains/ m%3 /yr
Grains/ m%3 /yr
Grains/ m% 3 /yr 25.35.413,843.53117,197.38,28,0292.52219,489.826.40.4.6324.2Tree p.9enPinus spp.19,54oll28.8.718957,0.2363.4,5029 7,52037.417.213,863.912.86,190.516.4,074.816.425.2103.5.9Qu,84us spp.,843.515erc1157.,782289.53,5.7142.3 34,212.36,925.210.4,3904.111.2114.615.45,367.5,215.89.50.9go spp.6,442.2nk12Gi5.115.9775.52.1,75 6.25.207.2,72.7862,95.2.44.51,96670.19.72,4427,13.1.6.5Ulmspp./Zelkova sppus 3,274.72,891.21,153.617. .41,578.23.61,9863.831,4151,891.22.6.71.92.934011,7orus spp.1,4M.41,653.12.11,088.42.1 6.122,605.45.92,132.93.21,1021,6192.282.3.41,7691.2prsaceae1,4esCu1,346.91.7455.82.2 .1544.21.21,20411.8367.36.41.3.91.398101.4 spCep.952.4ltis1,47.7420.61,2.2211.8 08.1.3918.42.11,11.783330.910001.4.7.32.883541,1stanea spp.Ca4.2741.50.91,0340.8 .2387.80.94426.70.7204.19661.30.90.583483Betula spp.0.30.701.41.7122.414 1.59.41020.42.1775.50.4258.50.48621.48.340us spp.74Aln1.18.10.3197.30.523 .70.5659.91.52511.30.4503.4190.50.341562.6p.96Platycar spya823.11.2210.90.3 1.50.5204.10.5740.91.1346.90.9646.3.64620.2346xus spp.Ta0.1904.81.181.0.5 0.8.40.2564.60.30.9129.3612.20.8880.86.751783rylus spp.Co700.981.60.27.5 0.86.50.4523.843129.30.35.40.60.915857.11.4Cainus spp.40rp0.6.51340.1775 0.4680.2244.923108.80.38.10.36.30.70.2646.5Polus spp.32pu0.51.40.774.857 0.70.10.4435.425847.60.1.50.40.8177.5Ace.470r spp.540.1503.40.6680.2 0.410.9299.30.2142.90.4238.10.338170.10.7Saspp.476.2lix 420.5115.60.31.8 0.24.90.6129.311428.61.15.60.20.324231.30.6Sequspp.401.4oia 320.4367.316.5 0.2.80.2115.61295.20.32.40.20.274170.18.1Jugs spp.23lan0.30.10.2340.117 .70.26.80251100.40020.1149.70Lee.6guminosa00278.90.313 .40.4680.2203190340.120.40.7Cr0p.yptomeria sp013074.80.1.6 0.1136.10.340.80.147.61020.16.800clo spCy6.8balanopsisp.88.40.1340 0081.60.20.10136.10.46.806.820.4ppionanthus sCh.4.10.36.8020 0.26.80129.3108.20.40.180.1.600.1136.1Plata spp.13nus0.2.6020.413 0.4006.847.60.10020Rh80us spp.3440.6888.40.20.1 68047.60.100.1027.2020.40.1ru6.18s spp.130.220.4040.Ced 0.80.26.8027.20.16.8074p.6.85.60us sp11Bux0.220.406.8 47.00.1340.1340.1340.16.60006.8013aecesaRo0
PollenGenus/family IncheonSeoul Galsan-dongYeonsu-dongAnam-dongDaerim-dong 20152016201520162015201620152016
Grains/ m%3 /yr
Grains/ m%3 /yr
Grains/ m%3 /yr
Grains/ m%3 /yr
Grains/ m%3 /yr
Grains/ m%3 /yr
Grains/ m%3 /yr
Grains/ m% 3 /yr 20Pt0006.80.6130130.4.6020eroca6.8 spp.rya.4040.80.1 00006.8000.1340ra0.0x sppSty34000 0000.6130000e346.80ceaOlea013.600 000.613000.4200000006.8p. spiziaAlb0 0.600013.60001300p.0us spxin0Fra000 000000006.8000p.Ligum spstr0000 00006.8000000pp0rica sMy.0000 006.800000000p.0us spPrun0000 27,1.488.952,741.579.3.319380.57260,095.281.4,9768.7,91182Total50,03473.4.647.86742,827.97217,3.1 110.99.12,156.54.97,727.9.2.64,952.41325.7,142.99.768,21.925Humulus spp.8,6.9eed12.75,428.66.89,6W25 en poll .73.59742.23,034.643,158.562,966492,2.40610Artemisia spp.432.8.13,96.304.83.392,61 .32.5721.11.62,5.6643.92,0002,21,9662.7655.39.2250brosia spp.Am3.41.93.73,4491,5.244 5.40.8129.30.3432920.7.5496.60.70.30.82.5686595.2Cheodiaceaenop.9387.80.5921 60.2210.90.547.0.50.1190.5115.66.50.20.715322.1pha spp.Ty6.5204.10.3270.5 0.1.20.188.41847.60.13.70.20612Rum0.127.ax spp.840.20.4020.40.1 0.240.80.1102261.20.254.40.10.1Am10e0.1anthaceaar540.134027.2.4 640.80.147.6120.40.1.20.1.20.10.16160.1raceae81.peCy61.20.154.40.1 0.16.8047.62027.20.1.4060.10.347..4Comsitae88po0.1.6010213 80040..60.1130006.8000.2s s.2rodenthuDopp340061. 0020.40006.80006.80sp0gofilum Fap.20.400 00000000000340noLegumi0sae13.60 0000000000000ceCaophyllaryae40.80.10 00000000200.40p.0ha sprp000Amo0 0000006.800006.8ina0Plaagntceae000 21.4,381101416,129.31329,870.726.2,006.817.6.3187.5.6,70Tol16,795.924ta10.712.9,455.84914,319 42959.21.1.61.11.51.80.6571.4693.90.9153.84621,4ne1.1GrsGramiasae21,3870.7.140 oll pen 3 ,546.643,81566,492.74.237,6373,798.690/y5937,2.8,14800.1,1768r) s/maingrtal (To5.9
Table 3. Continued
Airborne pollen in Incheon and Seoul
2016 (29,503.4 grains/m3, 36.8%), whereas Humulus spp. pollen, which was the predominant herb pollen, showed the highest concentration at the same site in 2015 (9,625.9 grains/m3, 25.6%) (Table 3).
Pollen dispersion pattern
Airborne pollen reached the maximum concentration in spring and fall. In spring, concentrations stared to rise in March, reaching a peak in April in both regions (2-year average pollen concentration: 25,023.8 grains/m3 in Incheon; 24,428.6 grains/m3 in Seoul). In fall, concentrations started to rise in August, reaching a peak in September (2-year average pollen concentration:
11,826.5 grains/m3 in Incheon; 7,794.2 grains/m3 in Seoul) (Fig. 2).
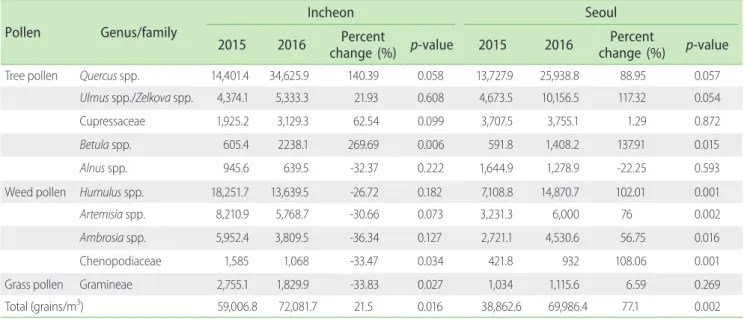
Concentration changes in major allergenic pollen types over 2 years
Both in Incheon and Seoul, pollen concentration was significantly higher in 2016 than in 2015 (p = 0.016 in Incheon;
p = 0.002 in Seoul). In Incheon, the pollen concentration of Betula spp. significantly increased (p = 0.006), whereas that of Chenopodiaceae (p = 0.034) and Gramineae (p = 0.027) significantly decreased over the 2 years. In Seoul, the pollen concentration of Betula spp. (p = 0.015), Humulus spp. (p = 0.001), Artemisia spp. (p = 0.002), Ambrosia spp. (p = 0.016), and Chenopodiaceae (p = 0.001) significantly increased over the 2 years (Table 4).
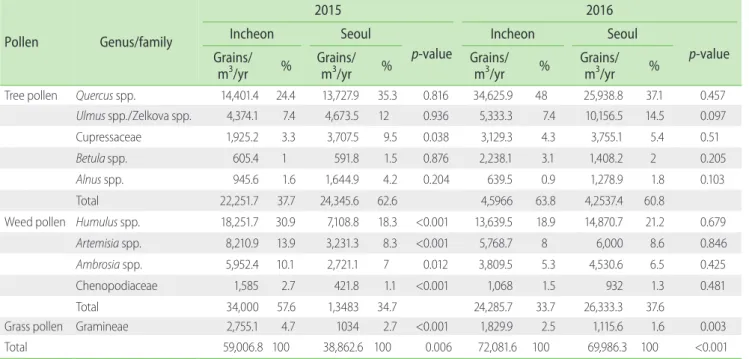
Concentration of major allergenic pollen types in Incheon and Seoul
The concentration of the major allergenic pollen types was significantly higher in Incheon than in Seoul (p = 0.006 in 2015, p < 0.001). In 2015, the pollen concentration of Humulus spp.
(p < 0.001), Artemisia spp. (p < 0.001), Ambrosia spp. (p = 0012), Chenopodiaceae (p < 0.001), and Gramineae (p < 0.001) was significantly higher in Incheon than in Seoul, whereas that of Cupressaceae (p = 0.038) was significantly higher in Seoul than in Incheon. In 2016, the pollen concentration of Gramineae was significantly higher in Incheon than in Seoul (p = 0.003) (Table 5).
Fig. 2. Average monthly pollen concentrations in Incheon and Seoul over 2 years (2015 and 2016).
40,000 35,000 30,000 25000 20,000 15,000 10,000 5,000 0
grains/m3
Incheon Seoul
Jan-2015 Feb-2015
Mar-2015 Apr-2015
May-2015 June-2015
July-2015 Aug-2015
Sept -2015 Oct-2015
Nov-2015 Dec-2015
Feb-2016 Mar-2016
Apr-2016 May-2016
June-2016 July-2016
Aug-2016 Sept -2016
Oct-2016 Nov-2016
Dec-2016 Jan-2016
Table 4. Average annual concentration and percent change of major allergic pollen types in Incheon and Seoul Pollen Genus/family
Incheon Seoul
2015 2016 Percent
change (%) p-value 2015 2016 Percent
change (%) p-value
Tree pollen Quercus spp. 14,401.4 34,625.9 140.39 0.058 13,727.9 25,938.8 88.95 0.057
Ulmus spp./Zelkova spp. 4,374.1 5,333.3 21.93 0.608 4,673.5 10,156.5 117.32 0.054
Cupressaceae 1,925.2 3,129.3 62.54 0.099 3,707.5 3,755.1 1.29 0.872
Betula spp. 605.4 2238.1 269.69 0.006 591.8 1,408.2 137.91 0.015
Alnus spp. 945.6 639.5 -32.37 0.222 1,644.9 1,278.9 -22.25 0.593
Weed pollen Humulus spp. 18,251.7 13,639.5 -26.72 0.182 7,108.8 14,870.7 102.01 0.001
Artemisia spp. 8,210.9 5,768.7 -30.66 0.073 3,231.3 6,000 76 0.002
Ambrosia spp. 5,952.4 3,809.5 -36.34 0.127 2,721.1 4,530.6 56.75 0.016
Chenopodiaceae 1,585 1,068 -33.47 0.034 421.8 932 108.06 0.001
Grass pollen Gramineae 2,755.1 1,829.9 -33.83 0.027 1,034 1,115.6 6.59 0.269
Total (grains/m3) 59,006.8 72,081.7 21.5 0.016 38,862.6 69,986.4 77.1 0.002
Maximum pollen concentrations
In the spring, the maximum pollen concentration was found at Galsan-dong, Incheon in 2015 (3,844 grains/m3) and at Yeonsu-dong, Incheon in 2016 (10,340 grains/m3). In the fall, the maximum pollen concentration was found at Yeonsu-dong, Incheon in 2015 (2,122 grains/m3) and at Daerim-dong, Seoul in 2016 (1,415 grains/m3) (Fig. 3).
Distribution of allergenic pollen types
Tree pollen predominated from March to May, whereas weed pollen predominated from August to October (Figs. 4, 5). The pollen season of Alnus spp. started in mid-February in both regions; that of Ulmus spp./Zelkova spp. started in early March in Incheon and mid-March in Seoul, reaching peak levels in mid- April; that of Cupressaceae started in mid-March in both regions and lasted until early May, reaching peak levels in early April; that of Betula spp. started in mid-March and peaked in April; whereas that of Quercus spp. reached peak levels from mid-April to mid- May and continued until June.
Among weeds, the pollen season of Humulus spp. ranged from early August to late October in both regions, reaching a peak in mid-September in Incheon and in early and mid- September in Seoul; the pollen season of Artemisia spp. ranged
from early August to late October in both regions, reaching a peak concentration in mid- and late October in Incheon and from late August to late September in Seoul; the pollen season of Ambrosia spp. started in mid-August in both regions and lasted until early October in Incheon and until late October in Seoul, reaching a peak concentration from early to mid-September.
Among grasses, the pollen season for Gramineae ranged from mid-May to mid-October in Incheon and from late April to late September in Seoul (Fig. 4).
Table 5. Concentration differences in major allergic pollen types between Incheon and Seoul in 2015 and 2016
Pollen Genus/family
2015 2016
Incheon Seoul
p-value
Incheon Seoul
p-value Grains/
m3/yr % Grains/
m3/yr % Grains/
m3/yr % Grains/
m3/yr %
Tree pollen Quercus spp. 14,401.4 24.4 13,727.9 35.3 0.816 34,625.9 48 25,938.8 37.1 0.457
Ulmus spp./Zelkova spp. 4,374.1 7.4 4,673.5 12 0.936 5,333.3 7.4 10,156.5 14.5 0.097
Cupressaceae 1,925.2 3.3 3,707.5 9.5 0.038 3,129.3 4.3 3,755.1 5.4 0.51
Betula spp. 605.4 1 591.8 1.5 0.876 2,238.1 3.1 1,408.2 2 0.205
Alnus spp. 945.6 1.6 1,644.9 4.2 0.204 639.5 0.9 1,278.9 1.8 0.103
Total 22,251.7 37.7 24,345.6 62.6 4,5966 63.8 4,2537.4 60.8
Weed pollen Humulus spp. 18,251.7 30.9 7,108.8 18.3 <0.001 13,639.5 18.9 14,870.7 21.2 0.679
Artemisia spp. 8,210.9 13.9 3,231.3 8.3 <0.001 5,768.7 8 6,000 8.6 0.846
Ambrosia spp. 5,952.4 10.1 2,721.1 7 0.012 3,809.5 5.3 4,530.6 6.5 0.425
Chenopodiaceae 1,585 2.7 421.8 1.1 <0.001 1,068 1.5 932 1.3 0.481
Total 34,000 57.6 1,3483 34.7 24,285.7 33.7 26,333.3 37.6
Grass pollen Gramineae 2,755.1 4.7 1034 2.7 <0.001 1,829.9 2.5 1,115.6 1.6 0.003
Total 59,006.8 100 38,862.6 100 0.006 72,081.6 100 69,986.3 100 <0.001
Fig. 3. Average monthly pollen concentrations at Galsan-dong and Yeonsu- dong, Incheon and Anam-dong and Daerim-dong, Seoul over 2 years (2015 and 2016).
12,000 10,000 8,000 6000 4,000 2,000 0
Galsan-dong, Incheon (grains/m3)
Jan-2015 Sept-2016
Yeonsu-dong, Incheon Anam-dong, Seoul Daelim-dong, Seoul
Airborne pollen in Incheon and Seoul
DISCUSSION
In this study, pollen samplers were established at 4 sites in Incheon and Seoul to monitor airborne pollen concentrations over a period of 2 years. Airborne pollen reached peak concentrations in the spring and fall, with tree pollen predominating from March through May and weed pollen predominating from August through October. Pinus spp., Quercus spp., and Ginkgo spp. showed the highest pollen concentrations among the trees; Humulus spp., Artemisia spp., and Ambrosia spp. among the weeds; and Gramineae among the grasses. The total concentration of pollen was higher in 2016 than in 2015.
The pollen concentration of Betula spp. in Incheon and also of Betula spp., Humulus spp., Artemisia spp., Ambrosia spp., and Chenopodiaceae in Seoul increased in 2016. However, the peak concentration was observed at Yeonsu-dong, Incheon.
The major types of airborne pollen showed similar annual Fig. 4. Pollen season of major allergenic plants in Incheon (A) and Seoul (B)
over 2 years (2015 and 2016). Average of 10-day pollen counts in grains/m3.
Fig. 5. Average monthly pollen concentrations of major allergenic plants at Galsan-dong (A) and Yeonsu-dong (B), Incheon and Anam-dong (C) and Daelim-dong (D), Seoul over 2 years (2015 and 2016).
Quercus spp.
Humulus spp.
Ulmus spp. + Zelcova spp.
Artemisia spp.
Ambrosia spp.
Cupressaceae
Gramineae Betula spp.
Alnus spp.
Chenopodiaceae
Quercus spp.
Humulus spp.
Ulmus spp. + Zelcova spp.
Artemisia spp.
Ambrosia spp.
Cupressaceae
Gramineae Betula spp.
Alnus spp.
Chenopodiaceae Jan.
5-10 11-20Feb. Mar. Apr. May June21-40 40-80 81-160 161-320 321-640 641-1200 1201-2400 2401-
Incheon
July Aug. Sept. Oct. Nov. Dec.
Jan.
5-10 11-20 21-40 40-80 81-160 161-320 321-640 641-1200 1201-2400 2401- Feb. Mar. Apr. May June
Seoul
July Aug. Sept. Oct. Nov. Dec.
7,000 6,000 5,000 4,000 3,000 2,000 1,000 0
Pinus Quercus Humulus Ginkgo Ulmus Artemisia Ambrosia
Morus Cupressaceae Celtis Castanea Gramineae Betula Alnus
2015-01-01 2015-02-01
2015-03-01 2015-04-01
2015-05-01 2015-06-01
2015-07-01 2015-08-01
2015-09-01 2015-10-01
2015-11-01 2015-12-01
2016-01-01 2016-02-01
2016-03-01 2016-04-01
2016-05-01 2016-06-01
2016-07-01 2016-08-01
2016-09-01 2016-10-01
4,000 3,500 3,000 2,500 2,000 1,500 1,000 500 0
2015-01-01 2015-02-01
2015-03-01 2015-04-01
2015-05-01 2015-06-01
2015-07-01 2015-08-01
2015-09-01 2015-10-01
2015-11-01 2015-12-01
2016-01-01 2016-02-01
2016-03-01 2016-04-01
2016-05-01 2016-06-01
2016-07-01 2016-08-01
2016-09-01 2016-10-01
4,500 4,000 3,500 3,000 2,500 2,000 1,500 1,000 500 0
2015-01-01 2015-02-01
2015-03-01 2015-04-01
2015-05-01 2015-06-01
2015-07-01 2015-08-01
2015-09-01 2015-10-01
2015-11-01 2015-12-01
2016-01-01 2016-02-01
2016-03-01 2016-04-01
2016-05-01 2016-06-01
2016-07-01 2016-08-01
2016-09-01 2016-10-01 8,000
7,000 6,000 5,000 4,000 3,000 2,000 1,000 0
2015-01-01 2015-02-01
2015-03-01 2015-04-01
2015-05-01 2015-06-01
2015-07-01 2015-08-01
2015-09-01 2015-10-01
2015-11-01 2015-12-01
2016-01-01 2016-02-01
2016-03-01 2016-04-01
2016-05-01 2016-06-01
2016-07-01 2016-08-01
2016-09-01 2016-10-01
(Grains/m3)(Grains/m3) (Grains/m3)(Grains/m3)
A
A
C
B
D B
patterns. The pollen season of trees ranged from February to May, usually reaching a peak in April, and that of weeds ranged from August to October, usually reaching a peak in September, whereas that of grasses ranged from April to October. These results were in agreement with those reported by Suk and Nam [4] regarding the pollen season of weeds (August–October) at Gyeongsan in 2004, but not of trees (March–June) and grasses (May–October), which started a month later than observed in the present study. Our findings were also in agreement with the nationwide (including Seoul) pollen season of trees and weeds [13]; however, the pollen season of grasses could not be compared, since no data have been reported previously.
Airborne pollen collected from Incheon and Seoul in 2015 and 2016 comprised 32 families and 50 genera, showing a higher diversity than that reported by Sung et al. [17] (19 species in 1998–2012) and that reported by Park et al. [13] (15 tree species and 8 weed species in 1997–2007). The present study included all the 16 major pollen types reported in previous studies [13], which were carried out in 7 major regions of South Korea, as well as Chenopodiaceae, which is also an allergenic pollen type.
Although weed and grass pollen concentrations are lower than tree pollen concentrations, an accurate classification is essential, since allergenicity varies among plants [18].
In 2015, the peak concentrations were recorded at Yeonsu- dong, Incheon in the spring (3,844 grains/m3) and the fall (2,122 grains/m3), whereas in 2016, the peak concentrations were recorded at Darim-dong, Seoul in the spring (10,340 grains/
m3) and the fall (1,415 grains/m3). The peak concentrations were markedly higher than those reported by Oh et al. [10] at Guri, Seoul in the spring of 1997 (942 grains/m3) as well as in Jeonju in the fall of 1997 (742 grains/m3) and 1998 (555 grains/m3). The differences between the 2 studies could be attributed to regional differences, the heterogeneity of the sampling methods—since Oh et al. [10] used a Rotorod sampler—and also an increase in pollen concentrations through the years.
Pinus spp. showed the highest pollen concentration (129,933 grains/m3, 41.6%) among the arboreal species and Humulus spp.
(47,621 grains/m3, 15.3%) among the herbaceous species. These 2 genera also showed the highest pollen concentrations in previous studies carried out in Korea, [13, 17, 19]; however, no quantitative comparisons could be made, since the previous studies presented only percentages and not pollen concentrations. In contrary, our findings were not in agreement with those reported by Suk and Nam [4] and Oh et al. [10], in which Artemisia spp. and
Ambrosia spp. showed the highest pollen concentrations from August through October.
In Seoul, the peak pollen concentration of Humulus spp. was 1,401.4 grains/m3 and that of Quercus spp. was 3,625.9 grains/m3. Furthermore, the total pollen concentration of Humulus spp. in Seoul was significantly higher in 2016 (17,870.7 grains/m3) than in 2015 (7,108.8 grains/m3) (p = 0.001). Our results differ from those of previous studies; for example, Oh et al. [5] found that the peak pollen concentration of Humulus spp. was 900 grains/m3 and that of Quercus spp. 850 grains/m3 in Seoul and Guri in 2008, whereas Kim et al. [15] found that the peak pollen concentration of Humulus spp. was 600 grains/m3 in Seoul in 2008 and significantly increased from 2006 to 2008. Any inconsistencies among the studies could be attributed to regional differences or an increase in allergenic plants over the years.
Airborne pollen distributions vary by region and period, and thus, the continuous monitoring and observation of pollen within the same region is important to overcome any regional limitations and collect reliable data. Moreover, sampling needs to be performed in multiple locations, since samples generally contain pollen from the surrounding areas. In the present study, samplers were installed at 4 sites within the metropolitan area to increase the reliability of sampling, and the samples were analyzed by the same researcher to reduce the range of error.
Unlike previous studies that collected pollen on a daily basis using the free fall method (Durham sampler or Rotorod sampler), we used the Burkard spore trap, the most globally standardized sampler, which continuously collects samples for up to 7 days and enhances data reliability by reducing the range of error; thus, our study represents a source of valuable information despite being conducted over only 2 years solely in a metropolitan region.
Our study revealed the airborne pollen concentrations at 4 sites in Incheon and Seoul over 2 years. Pollen seasons were longer and peak concentrations were higher than those previously reported. Additionally, we found that the total allergenic pollen concentration was significantly higher in Incheon than in Seoul and in 2016 than in 2015. To increase the accuracy of airborne pollen distribution and overcome any regional limitations, data need to be collected continuously via a standardized method and sampling to be performed nationwide. Overall, the continuous monitoring of major allergenic pollen types might substantially contribute to managing allergenic plants and developing effective countermeasures.