Copyright © 2014 The Korean Society for Bone and Mineral Research
This is an Open Access article distributed under the terms of the Creative Commons Attribution Non-Commercial Li- cense (http://creativecommons.org/licenses/by-nc/3.0/) which permits unrestricted non-commercial use, distribu- tion, and reproduction in any medium, provided the original work is properly cited.
pISSN 2287-6375 eISSN 2287-7029
Assessing Bone Quality in Terms of Bone Mineral Density, Buckling Ratio and Critical Fracture Load
Anitha D1, Taeyong Lee2
1Department of Biomedical Engineering, National University of Singapore, Singapore
2Department of Medical Biotechnology, Dongguk University, Seoul, Korea
Background: Bone mineral density (BMD) is used as a sole parameter in the diagnosis of osteoporosis. Due to the ease of acquirement of BMD, clinical diagnosis still involves its usage although the limitations of BMD are quite well-established. Therefore, this prelim- inary study hoped to reduce the errors introduced by BMD alone by incorporating geo- metric and structural predictors simultaneously to observe if strength was implicitly de- pendent on the geometry and BMD. Hence, we illustrated the triadic relationship be- tween BMD, buckling ratio (BR) and critical fracture load (Fcr). Methods: The geometric predictor was the BR as it involves both the changes in the periosteum and the cortical thickness. Also, structural changes were monitored by finite element (FE) analysis–pre- dicted Fcr. These BR and Fcr measurements were plotted with their respective femoral neck BMD values in elderly female patients (n=6) in a 3-year follow-up study, treated with ibandronate. Results: In all the three-dimensional plots (baseline, mid and final year), high Fcr values were found at regions containing high BMD and low BR values. Quan- titatively, this was also proven where an averaged highest Fcr across the three years had a relatively higher BMD (46%) and lower BR (19%) than that of the averaged lowest Fcr. The dependence of FE predicted strength on both the geometry and bone density was illustrated. Conclusions: We conclude that use of triadic relationships for the evaluation of osteoporosis and hip fractures with the combination of strength, radiology-derived BR and bone density will lay the foundation for more accurate predictions in the future.
Key Words: Bone density, Femur neck, Finite element analysis, Osteoporotic fractures
INTRODUCTION
At present, osteoporosis is one of the leading diseases amongst the elderly, re- sulting in an increase in morbidity and mortality.[1] This skeletal disease has pro- found implications on the society in terms of social costs and economic burden.
The current diagnosis is based on the obtainment of bone mineral density (BMD) from dual energy X-ray absorptiometry (DXA), where a scans are taken in a single plane and an average BMD is obtained for the site of interest.[2] There are several problems with the diagnosis of osteoporosis and consequently the prediction of hip fractures currently. Firstly, the etiology of fractures is multi-factorial [3] and no one predictor can fully encompass the complex and time-dependent nature of bone loss.[4] Secondly, BMD is an averaged parameter. Thus, it could mask critical regions of bone loss, since there could be localized regions of accelerated bone Corresponding author
Taeyong Lee
Department of Medical Biotechnology, Dongguk University, 30 Pildong-ro 1-gil, Jung-gu, Seoul 100-705, Korea Tel: +82-2-2260-3310 Fax: +82-2-2260-8726 E-mail: tlee@dongguk.edu
Received: June 5, 2014 Revised: November 19, 2014 Accepted: November 19, 2014
No potential conflict of interest relevant to this article was reported.
This work was supported by the Academic Research Funding (AcRF #R397-000-094-112) from the Ministry of Education (MoE), Singapore.
Original Article
loss [5] that if gone unnoticed, could have serious implica- tions on the risk of fractures. Lastly, skeletal diseases like osteoporosis have a profound influence on the bone ge- ometry and strength. Excluding these parameters is a seri- ous drawback in terms of diagnosis and progression of these diseases.
Several studies have studied the accuracy with which fi- nite element (FE) models were able to reproduce experi- mentally measured surface strains.[6-8] While they maybe an idealized representation described in mathematical ex- pressions, it offers the best source of information on bone morphology thus far.[9] FE analysis (FEA) derived critical fracture load (Fcr) captures the macroscopic compressive strength of the femur under compression loading. Bone strength is difficult to measure in vivo [10] and is influenc- ed by the amount of bone, the spatial distribution of bone mass and the intrinsic properties of the materials that com- prise the bone.[11] Buckling ratio (BR), an originally me- chanical engineering concept, introduced by Beck et al.
[10] in his earlier works, is the ratio of the outer radius to cortical thickness and is a measure of instability. BR cap- tures the compensation mechanism of the femur by which it remodels by redistributing bone mass to counteract the loss in bone mass in order to preserve bending strength.
The use of BR and Fcr will be useful in the clinical scenario as both predictors capture the geometric and structural changes respectively. So a more accurate analysis of the hip can be provided to doctors, to make a more informed
diagnosis. Therefore, there is a need to include other pre- dictors, with or without BMD, to better diagnose osteopo- rosis and improve the accuracy of hip fracture prediction.
This study proposes a novel method of incorporating both Fcr and BR with BMD to explore possible influences of one predictor on the other two. This could lay the foundation for future work on using triadic representations as a tool for predicting osteoporosis and consequently hip fractures.
METHODS
Quantitative computed tomography (QCT) scans were used to extract the femoral neck BMD values as the focus of this study was on osteoporosis at the femoral neck re- gion. These QCT scans were generated using a General Elec- tric (GE) Medical Systems Scanner (GE Medical Systems, Mil- waukee, WI, USA) with settings as follows: 120 kVp, 219 mAs, contiguous, 2.5 mm-thick slices, 0.703 mm pixels, 512×
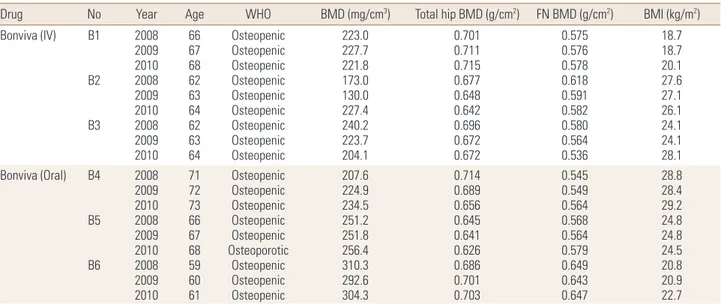
512 matrix and standard reconstruction. Patients treated with ibandronate (n=6) over three years (2008, 2009, and 2010) were analyzed in this study, with their detailed infor- mation provided in Table 1. Following methodology adopt- ed by Carpenter et al.,[12] geometric parameter, BR, was obtained from the extraction of femoral neck, followed by drawing of profile rays at 30° intervals and finally obtain- ment of outer radius and cortical thickness values from the profile rays (Fig. 1).[12] Non-linear FEA was performed as post-failure material behaviour was defined. In our study,
Table 1. Detailed information of subjects (n=6)
Drug No Year Age WHO BMD (mg/cm3) Total hip BMD (g/cm2) FN BMD (g/cm2) BMI (kg/m2) Bonviva (IV) B1
B2
B3
20082009 20102008 20092010 20082009 2010
6667 6862 6364 6263 64
Osteopenic Osteopenic Osteopenic Osteopenic Osteopenic Osteopenic Osteopenic Osteopenic Osteopenic
223.0 227.7 221.8 173.0 130.0 227.4 240.2 223.7 204.1
0.701 0.711 0.715 0.677 0.648 0.642 0.696 0.672 0.672
0.575 0.576 0.578 0.618 0.591 0.582 0.580 0.564 0.536
18.718.7 20.127.6 27.126.1 24.124.1 28.1 Bonviva (Oral) B4
B5
B6
20082009 20102008 20092010 20082009 2010
7172 7366 6768 5960 61
Osteopenic Osteopenic Osteopenic Osteopenic Osteopenic Osteoporotic
Osteopenic Osteopenic Osteopenic
207.6 224.9 234.5 251.2 251.8 256.4 310.3 292.6 304.3
0.714 0.689 0.656 0.645 0.641 0.626 0.686 0.701 0.703
0.545 0.549 0.564 0.568 0.564 0.579 0.649 0.643 0.647
28.828.4 29.224.8 24.824.5 20.820.9 22.7 WHO, World Health Organization; BMD, bone mineral density; FN, femoral neck; BMI, body mass index.
Fig. 1. Obtainment of outer radius and cortical thickness from profile rays drawn on narrowest neck slice. After extraction of femoral neck region, profile rays were drawn at 30° intervals, measured from the centroid of the femoral neck slice. A sample profile ray at 0° is shown where respec- tive regions of cortical bone, trabecular bone and soft tissues are identified.
Extraction of femoral neck region Narrowest femoral neck cross-sectional slice Profile ray obtained at 0° interval Trabecular bone Cortical bone Soft tissue
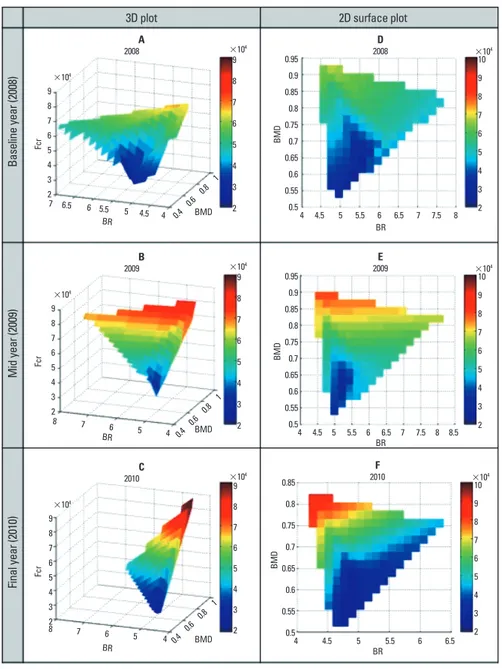
Fig. 2. Yearly three-dimensional sur- face plots of bone mineral density (BMD), buckling ratio and fracture load (Fcr). High Fcr values were found at regions containing high BMD and low BR values.
3D plot
Baseline year (2008)Mid year (2009)Final year (2010)
2D surface plot
9 8 7 6 5 4 3
27 6.5 6 5.5 5 4.5 4 0.4 0.6 0.8
1 BMD 2008A
9 8 7 6 5 4 3 2
×104
×104
BR
Fcr
9 8 7 6 5 4 3
28 7 6 5 4 0.4 0.6 0.8
1 BMD 2009B
9 8 7 6 5 4 3 2
×104
×104
BR
Fcr
9 8 7 6 5 4 3
8 7 6 5 2 4 0.4 0.6 0.8
1 BMD 2010C
9 8 7 6 5 4 3 2
×104
×104
BR
Fcr
0.95 0.9 0.85 0.8 0.75 0.7 0.65 0.6 0.55
0.54 4.5 5 5.5 6 6.5 7 7.5 8 2008D
10 9 8 7 6 5 4 3 2
×104
BR
BMD
0.95 0.9 0.85 0.8 0.75 0.7 0.65 0.6 0.55
0.54 4.5 5 5.5 6 6.5 7 7.5 8 8.5 2009E
10 9 8 7 6 5 4 3 2
×104
BR
BMD
0.85 0.8 0.75 0.7 0.65 0.6 0.55
0.54 4.5 5 5.5 6 6.5
2010F
10 9 8 7 6 5 4 3 2
×104
BR
BMD
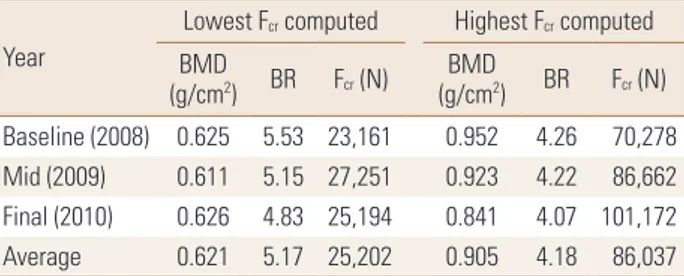
Table 2. Lowest and highest fracture load values and its respective bone mineral density and buckling ratio values obtained for baseline, mid and final years for patients treated with ibandronate (n=6)
Year
Lowest Fcr computed Highest Fcr computed (g/cmBMD 2) BR Fcr (N) BMD
(g/cm2) BR Fcr (N) Baseline (2008) 0.625 5.53 23,161 0.952 4.26 70,278 Mid (2009) 0.611 5.15 27,251 0.923 4.22 86,662 Final (2010) 0.626 4.83 25,194 0.841 4.07 101,172 Average 0.621 5.17 25,202 0.905 4.18 86,037 Fcr, fracture load; BMD, bone mineral density; BR, buckling ratio.
displacements are implemented incrementally and the Fcr
is represented by the peak total reaction force, which is the sum of all the reaction forces obtained over the 3 cm load- ed region on the femoral head.[13] A simple fall in the fron- tal plane was simulated at 10° to the horizontal and a sur- face load was applied on the femoral head, as mentioned above. Fcr and BR values obtained were then plotted with respect to BMD in a triadic plot for each year for all patients combined (n=6). This was done using MATLAB® (Mathworks, Natick, MA, USA) for each year.
RESULTS
Three-dimensional (3D) plots were generated for each year (Fig. 2A, C). With BR and BMD plotted in the horizontal axes, Fcr was the dependent variable plotted on the vertical axis. As such, the coloured contour gradient was mapped to the changes in Fcr with respect to BR and BMD. As can be observed, the range of values of Fcr had increased from base- line (Fig. 2A) to final year (Fig. 2C), depicted by the increase in intensity of colours (blue to red).
While some observations are easy to determine, inter- pretation of meaningful findings are lost in these 3D repre- sentations (Fig. 2A, C). Hence, it might be more useful to study the changes in the two-dimensional (2D) surface plot instead (Fig. 2D, F) where both the ranges of predic- tors and their coupled changes can be observed with rela- tive ease. In Figures 2D to 2F, high Fcr values are observed at the low BR and high BMD regions. In all other regions, low Fcr values were exhibited at regions of high BR and/or low BMD values.
This was also validated quantitatively where an average of the lowest Fcr values obtained was approximately 25,000 N, which was associated with a BMD value of 0.621 and a
BR value of 5.17 (Table 2). This was in contrast to an aver- age of the highest Fcr values obtained (86,000 N approxi- mately) which was associated with a BMD value of 0.905 and BR value of 4.18. The averaged highest Fcr value was more than double the averaged lowest Fcr value, while the BMD was 46% higher and BR was 19% lower in the final year than in the baseline year (Table 2).
DISCUSSION
In this study, FE derived Fcr was strongly associated with both BR and BMD after adjustments for age and body mass index (BMI). Since this preliminary study has only n=6 sub- jects, it may be small to compare the FE outcomes against BMD in terms of predictive ability. Nevertheless, with the use of material properties and boundary conditions already validated previously, FE derived Fcr is sufficient for this com- parative study. The most critical finding in this study was that high Fcr values were associated with high BMD and low BR values. This finding is concomitant with literature as previous studies have established a linear increasing re- lationship between Fcr and BMD.[14,15] Whereas, a higher BR value means greater instability and thus makes sense that greater strength is found at regions with greater sta- bility (low BR). This goes to show the dependence of stren- gth on both geometry and BMD and that isolating BMD, or any other parameter alone, could mean a critical loss of in- formation.
There are many factors such as loading conditions, weight and age reasonable for changes in geometry. And geome- try itself could be analyzed in terms of various parameters such as hip axis length (HAL), neck shaft angle (NSA), fem- oral neck axis length (FNAL) and femoral neck width (FNW).
Identifying these factors and geometrical parameters sin- gularly for a more accurate prediction of fractures is analo- gous to finding the most significant factor that is majorly responsible for fractures. However, we are well aware that bone remodelling is a dynamic process which is elicited by numerous signals.[16] This patient-specific analysis will pave the way for a more accurate diagnosis of osteoporosis and also for better treatment suggestions. For example, if the patient falls in the critical region as illustrated earlier, then the patient would need to take a higher dosage of drug treatment coupled with strength exercises to strengthen the hip. This leads us to believe that patient-specific analy-
sis could be vital to clinical diagnosis of osteoporosis and fracture prediction.
Therefore, this is the first prospective evaluation of the combination of FEAs with radiology-derived parameters and bone density. Larger studies are required to determine the reproducibility of the triadic relationship and future studies can also focus on the refinement of the FE method to obtain optimized results.
REFERENCES
1. Melton LJ 3rd. Hip fractures: a worldwide problem today and tomorrow. Bone 1993;14 Suppl 1:S1-8.
2. Kanis JA, Melton LJ 3rd, Christiansen C, et al. The diagnosis of osteoporosis. J Bone Miner Res 1994;9:1137-41.
3. Geusens P, van Geel T, van den Bergh J. Can Hip Fracture Prediction in Women be Estimated beyond Bone Mineral Density Measurement Alone? Ther Adv Musculoskelet Dis 2010;2:63-77.
4. Schuit SC, van der Klift M, Weel AE, et al. Fracture incidence and association with bone mineral density in elderly men and women: the Rotterdam Study. Bone 2004;34:195-202.
5. Anitha D, Kim KJ, Lim SK, et al. Implications of local osteo- porosis on the efficacy of anti-resorptive drug treatment:
a 3-year follow-up finite element study in risedronate-treat- ed women. Osteoporos Int 2013;24:3043-51.
6. Lotz JC, Cheal EJ, Hayes WC. Fracture prediction for the proximal femur using finite element models: part I--Linear analysis. J Biomech Eng 1991;113:353-60.
7. Bessho M, Ohnishi I, Matsuyama J, et al. Prediction of stren- gth and strain of the proximal femur by a CT-based finite
element method. J Biomech 2007;40:1745-53.
8. Schileo E, Taddei F, Malandrino A, et al. Subject-specific fi- nite element models can accurately predict strain levels in long bones. J Biomech 2007;40:2982-9.
9. Cristofolini L, Schileo E, Juszczyk M, et al. Mechanical test- ing of bones: the positive synergy of finite-element mod- els and in vitro experiments. Philos Trans A Math Phys Eng Sci 2010;368:2725-63.
10. Beck TJ, Oreskovic TL, Stone KL, et al. Structural adaptation to changing skeletal load in the progression toward hip fragility: the study of osteoporotic fractures. J Bone Miner Res 2001;16:1108-19.
11. Bouxsein ML. Determinants of skeletal fragility. Best Pract Res Clin Rheumatol 2005;19:897-911.
12. Carpenter RD, Sigurdsson S, Zhao S, et al. Effects of age and sex on the strength and cortical thickness of the fem- oral neck. Bone 2011;48:741-7.
13. Keyak JH. Improved prediction of proximal femoral frac- ture load using nonlinear finite element models. Med Eng Phys 2001;23:165-73.
14. Johnell O, Kanis JA, Oden A, et al. Predictive value of BMD for hip and other fractures. J Bone Miner Res 2005;20:1185- 94.
15. Cawthon PM, Ewing SK, Mackey DC, et al. Change in hip bone mineral density and risk of subsequent fractures in older men. J Bone Miner Res 2012;27:2179-88.
16. Parfitt AM. Skeletal heterogeneity and the purpose of bone remodeling: implications for the understanding of osteo- porosis. In: Marcus R, Feldman D, Kelsey JL, editors. Osteo- porosis. 2nd ed. San Diego, CA: Academic Press; 2001. p.433- 47.