INTRODUCTION
Despite progress in early detection and treatment of breast cancer, and advances in our understanding of cancer’s molecular basis, breast cancer remains a major cause of death in women.(1) Effective treatment of estrogen receptor (ER) positive breast cancer with anti-estrogenic drugs, such as tamoxifen, is well established. However,
breast carcinomas eventually become refractory to hor- mone therapy.(2) To overcome this limitation on anti- estrogenic therapy, new therapies that selectively target specific molecules playing important roles in cancer growth or progression have been developed. As a result, there has been much success with the erbB-2 targeting agent trastuzumab which was first approved for the treatment of advanced breast cancer in 1998. Subsequently, various molecular regulators of signaling transduction pathways in tumor cells have been under investigation. Among these potential targets, there has been particular interest in several components of the phosphatidylinositol 3- kinase (PI3K)/Akt/mammalian target of rapamycin (mTOR) signaling pathway.
Purpose: The phosphatidylinositol 3-kinase (PI3K)/Akt/
mammalian target of rapamycin (mTOR) pathway has a central role in regulation of cell proliferation, differentiation, motility and survival. This pathway has recently generated great interest because its elements are, potentially, novel targets for the treatment of various malignancies, including breast cancer. Methods: Using tissue microarray sections of breast carcinoma, we performed immunohistochemical studies using antibodies against the phosphorylated forms of Akt (p-Akt) and mTOR (p-mTOR) in 530 invasive breast carcinomas and 30 ductal carcinomas in situ (DCIS). We investigated possible associations between expression of these proteins and clinicopathologic characteristics and disease outcomes. Results: In 530 invasive carcinomas, weak and strong expression of p-Akt was observed in 180 (34.0%) and 288 (54.3%) cases, respectively. The expres- sion of p-Akt was associated with expression of estrogen receptors (ER) (p =0.045), progesterone receptors (PR)
(p =0.003), lymph node metastasis (p <0.001) and cancer stage (p =0.027). Weak and strong expression of p-mTOR was found in 136 (25.7%) and 207 (39.1%) cases, respec- tively. The mTOR pathway was more frequently activated in DCIS than in invasive breast carcinoma (p =0.001). p-mTOR expression was associated with expression of ER (p =0.040), PR (p=0.009), tumor size (p<0.001), and stage (p=0.002). In a univariate analysis, strong expression of p-Akt was asso- ciated with longer disease-free survival (DFS). In a multivari- ate analysis, neither p-Akt nor p-mTOR was associated with DFS. Conclusion: The PI3K/Akt/mTOR pathway is active in DCIS as well as in invasive carcinoma of the breast. Our study also suggests that the PI3K/Akt/mTOR pathway is influenced by ER rather than erbB-2, and that this pathway may contribute more to cancer pathogenesis in ER-positive tumors.
Key Words: Breast, Carcinoma, mTOR protein, Proto-oncogene protein c-akt
Breast Cancer
O R I G I N A L A R T I C L E
Phosphorylated Akt and Phosphorylated mTOR Expression in Breast Invasive Carcinomas: Analysis of 530 Cases
Jungsuk An, Hoiseon Jeong
1, Youngseok Lee
2, Sang Uk Woo
3, Jae Hong Seo
4, Aeree Kim
1Department of Pathology, Gil Medical Center, Gachon University of Medicine and Science, Incheon; 1Department of Pathology, Korea University Guro Hospital, Korea University College of Medicine, Seoul; 2Forensic Medicine Division, Eastern District Office, National Institute of Scientific Investigation, Wonju; 3Department of Surgery and 4Division of Medical Oncology, Department of Internal Medicine, Korea University Guro Hospital, Korea University College of Medicine, Seoul, Korea
Correspondence: Aeree Kim
Department of Pathology, Korea University Guro Hospital, Korea University College of Medicine, 80 Guro-dong, Guro-gu, Seoul 152-703, Korea
Tel: 02-2626-1488, Fax: 02-2626-1489 E-mail: [email protected]
Received: April 20, 2010 Accepted: October 21, 2010
337
The PI3K/Akt/mTOR signaling pathway is an important regulator of cell growth, proliferation and survival.(3,4) Dysregulation of this pathway generates an oncogenic environment, and leads to uncontrolled proliferation of transformed clones.(5) The Akt protein, also known as protein kinase B (PKB), lies downstream of PI3k and upstream of mTOR and is implicated in various cellular processes, including cell growth, proliferation, apoptosis and regulation of gene expression.(6) The mTOR pathway is involved in regulating many aspects of cell growth and proliferation at the translational level.(6,7) Regulation is achieved by two downstream components of mTOR, 1) ribosomal p70 S6 kinase (S6K1) and 2) eukaryotic trans- lation initiation factor 4E (eIF4E)-binding protein 1 (4E- BP1). Activation of S6K1 and eIF4E by mTOR initiates the translation of mRNAs and subsequent increased protein synthesis essential for cell growth and proliferation.(3,8) Recently, many studies have demonstrated that there are several mutations both upstream and downstream of the mTOR kinase in malignant tumors, mutations that play an important role in the development and growth of various tumors.(3,5) These mutations include/are involved in amplification of a catalytic subunit of PI3K, loss of PTEN (phosphatase and tensin homolog deleted on chromosome 10), a tumor-suppressor gene which downregulates expression of either PI3K or Akt kinases, amplification of Akt, and overexpression or amplification of eIF4E or S6K1.(3,9) The mTOR signaling pathway is also up-regulated in various carcinoma cell lines and in human ovarian and breast carcinomas.(10)
Therefore, targeting mTOR kinase may lead to an anti- tumor effect in several types of cancers via cell cycle arrest and cell growth inhibition. There are several mTOR inhi- bitors available today, including rapamycin (sirolimus) and its analogs CCI-779 (temsirolimus), AP23573, and RAD001 (everolimus). Recently, RAD001 (everolimus) showed promising antitumor activity against low-to- intermediate grade neuroendocrine tumors and renal cell carcinomas.(11,12) Moreover, several phase II studies in breast cancer were performed to evaluate the safety and efficacy of temsirolimus or everolimus as a component of a combined multi-drug regimen or as a single drug,
and showed benefit from the combined regimen.(13) However, a large phase III study of letrozole alone or in combination of temsirolimus in postmenopausal women with breast cancer failed to demonstrate any benefit from the combination.(14) It is possible that this failure is not due to the lack of efficacy of this combination, but to treatment of patients who are not specifically selected for mTOR pathway activation. Indeed, there is no predic- tive marker that identifies PI3K/Akt/mTOR pathway- dependent tumors.
Expression of Akt and mTOR in breast cancer has been studied, but various rates of expression have been reported, with conflicting findings regarding their prognostic influ- ence and association with ER or erbB-2 status. Here, we (1) evaluated expression levels of activated Akt (phospho- rylated Akt, p-Akt) and mTOR (phosphorylated mTOR, p-mTOR) in breast cancer patients, and (2) analyzed the relationship between their expression and clinicopatho- logical features of breast cancer such as tumor size, lymph node status, stage of disease, hormone receptor and erbB- 2 status. Their prognostic impact on a large population of patients with breast cancer was also assessed in order to see if the data would support the strategy of targeted therapy of breast cancer using mTOR inhibitors.
METHODS
Tissue samples and clinicopathologic data Sequential archival samples from patients who had undergone surgical treatment and were diagnosed as having primary breast carcinoma at Korea University Guro Hospital between April 1992 and October 2006 were involved in the study. Cases with distant metastases at the time of diagnosis were excluded and 730 cases were initially included in this study. Of the initial 730 cases, 105 had to be excluded due to staining failure resulting from section folding or absence of tumor cells. Of the remaining 625 cases, 65 were excluded due to insufficient clinical data. Finally, a total of 530 invasive carcinomas and 30 ductal carcinomas in situ (DCISs) were evaluated in our study. For all patients, detailed clinicopathologic data including patient age, lymph node status, tumor
size, tumor grade, and survival data were obtained from hospital records. Grading of carcinomas was performed according to the Nottingham combined histologic grading system using the method of Elston and Ellis.(15) The median follow-up time was 58.5 months.
Tissue microarray construction
For tissue microarray (TMA) construction, hematoxyline and eosin stained sections of each tumor were examined.
Representative areas of tumors were selected and marked on the corresponding paraffin block. The selected area in the corresponding paraffin block was punched out and embedded in microarray blocks. One or two 2 mm cores of the selected area in the corresponding paraffin block from each case were arrayed.
Immunohistochemistry
For immunohistochemical analysis, serial 4 μm sections of the TMA block were mounted on electrostatic slides, heat-dried at 56℃for 30 min, deparaffinized in xylene, and rehydrated through graded concentrations of ethanol.
Antibody and antigen retrieval methods are summarized in Table 1. Slides were incubated in a solution of 3% hydro- gen peroxidase in methanol for 15 min to block endogen- ous peroxidase activity. Slides were incubated in 0.3%
bovine serum albumin/1X Tris-buffered saline (TBS) for 20 min to reduce nonspecific background staining. A primary antibody was applied for 30 min at room tem- perature. After a series of TBS rinses, bound antibody was detected using a polymer secondary antibody from the DAKO EnVision+ system (DAKO, Carpinteria, USA).
The slides were rinsed with a TBS series and visualized after a 10 min incubation of liquid 3, 3′-diaminobenzidine in buffered substrate (DAKO, Carpinteria, USA) for 10 min.
The slides were counterstained with hematoxylin.
Assessment of immunohistochemical staining We assessed immunohistochemical staining of TMA sections in a semiquantitative manner. Expression levels of p-Akt and p-mTOR were categorized into three groups based on both intensity and proportion of cancer cells with cytoplasmic or nuclear staining. This was done according to a previously described scoring system with a slight modification.(9) Tumors without a reaction were scored as 0 (negative); tumors with 1-50% of cells showing weak staining or 1-10% of cells with strong staining were scored as 1; tumors with >50% of cells with weak staining or >10%
of cells with strong staining were scored as 2.
In regard to ER and progesterone receptors (PR), cancer cells with nuclear staining were considered as immuno- reactive ones, and evaluated for labeling index and staining score. ER and PR scoring was done using the Allred scoring method.(16) Briefly, a proportion score was assigned that represented the estimated proportion of positive tumor cells on each core as follows: 0, none; 1, <1/100; 2, 1/100- 1/10; 3, 1/10-1/3; 4, 1/3-2/3; 5, >2/3. An intensity score was assigned that estimated the average staining intensity of positive tumor cells in each core as follows: negative, 0; weak, 1; intermediate, 2; and strong, 3. The proportion score and the intensity score were added to obtain a total score. Cases with a total score of 3 or more were con- sidered positive.
With regard to erbB-2, a cancer cell with membranous staining was considered as an immunoreactive one, and was evaluated to determine a score. Membranous staining of erbB-2 was evaluated using the HercepTest�(DAKO, Carpinteria, USA) scoring method as follows: cores with more than 10% of strong membranous staining, 3; cores with more than 10% of moderate staining, 2; cores with more than 10% of weak staining, 1. erbB-2-positive cases were defined as those for which the score was 3.
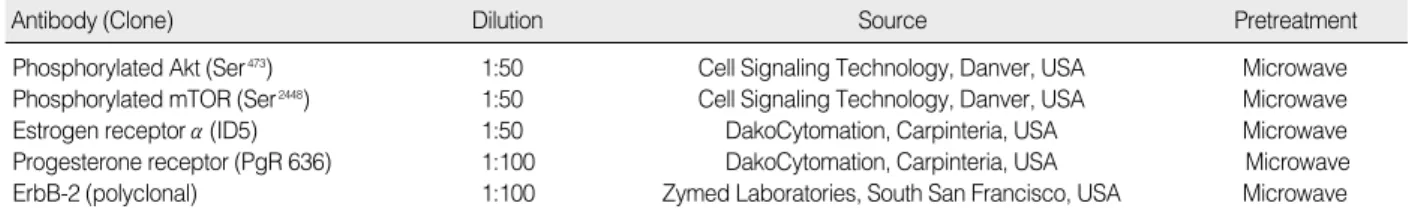
Table 1. Summary of antibodies and antigen retrieval methods used in immunohistochemistry
Antibody (Clone) Dilution Source Pretreatment
Phosphorylated Akt (Ser473) 1:50 Cell Signaling Technology, Danver, USA Microwave Phosphorylated mTOR (Ser2448) 1:50 Cell Signaling Technology, Danver, USA Microwave
Estrogen receptor α(ID5) 1:50 DakoCytomation, Carpinteria, USA Microwave
Progesterone receptor (PgR 636) 1:100 DakoCytomation, Carpinteria, USA Microwave ErbB-2 (polyclonal) 1:100 Zymed Laboratories, South San Francisco, USA Microwave
Fluorescence in situ hybridization
ErbB-2 gene amplification was determined using the Path Vysion�(Vysis, Downers Grove, USA) HER2 DNA Kit containing 2 DNA probes that are directly labeled with a spectrum orange fluorophore (HER2 gene locus on band 17q11.2-12). A spectrum green fluorophore-labeled chro- mosome 17 enumeration probe (CEP17; band 17p11.1- 11.1) was used following the manufacturer’s instructions.
According to the recent guidelines of the American Society of Clinical Oncology and the College of American Patholo- gists (ASCO/CAP),(17) a sample with an HER2/CEP17 ratio greater than 2.2 was considered amplified.
Western blot
To validate the specificity of the antibodies used in this study, western blot analysis was performed in the cell line and in lysates of freshly frozen tissue from 5 breast tumors. Freshly frozen tissues were cut into sections and lysed in NP-40 lysis buffer (50 mMol/L of Tris hydro- chloride, pH 7.4; 150 mMol/L of sodium chloride; 0.5%
NP-40 (Aldrich, St Louis, USA); 50 mMol/L of sodium fluoride; 1 mMol/L of sodium orthovanadate; 1 mMol/L of phenylmethylsulfonyl fluoride; 25 μg/mL of leupeptin;
and 25 μg/mL of aprotinin). The supernatants were cleared by centrifugation. Protein concentrations were measured using a Coomassi plus protein assay reagent (Pierce Chemical, Rockford, USA).
For western blot analyses, 40 μg of crude extracts were boiled in sodium dodecyl sulfate sample buffer; the pro- teins were resolved by sodium dodecyl sulfate-polyacry- lamide gel electrophoresis, transferred to a nitrocellulose membrane (Bio-Rad Laboratories, Hercules, USA), and probed with the primary antibody for erbB-3 (MS-313- P1; NeoMarkers, Fremont, USA). After the blots were incubated for another hour at room temperature with a horseradish peroxidase-labeled secondary antibody (goat antimouse IgG; Perkin Elmer, Boston, USA), signals were detected using the Enhanced Chemiluminescence assay (Amersham Life Science, Arlington Heights, USA) per the manufacturer’s instructions. Positive control samples were included in MCF-7, SK-Br3, and MDA-MB-468 cell lines.
Statistical analysis
Correlations between 1) expression levels of p-Akt or p-mTOR, and 2) clinicopathologic parameters were assessed with 2×3 or 3×3 tables using a Fisher’s exact test because these variables were measured as qualita- tive (ordinal or categorical) data. The influence of levels of p-Akt or p-mTOR on disease-free survival (DFS) was estimated using the Kaplan-Meier method. Survival was calculated from the time of the initial diagnosis to the date of last contact (or the date of death if the patient was deceased). DFS was defined as the interval (measured in months) from the date of initial diagnosis to the date of the first local recurrence or distant metastasis. The association between intervals and levels of p-Akt or p- mTOR was tested using the log-rank test. To determine the effect of levels of p-Akt or p-mTOR on cancer-specific survival, multivariate analysis was performed using the
NA=not available.
Age at diagnosis (yr)
≤29 14 (2.6)
30-39 122 (23.0)
40-49 194 (36.6)
50-59 112 (21.1)
60-69 55 (10.4)
70-79 21 (4.0)
≥80 2 (0.4)
Histologic grade
1 120 (22.6)
2 247 (46.6)
3 141 (26.6)
NA 22 (4.2)
Tumor size (cm)
≤2 234 (44.2)
>2, ≤5 259 (48.9)
>5 22 (4.2)
NA 15 (2.8)
Lymph node metastasis
No 288 (54.3)
Yes 227 (42.9)
NA 15 (2.8)
Stage
I 158 (29.8)
II 264 (49.8)
III 93 (17.5)
NA 15 (2.8)
Table 2. Frequencies and percentages of clinicopathologic characteristics in 530 cases of invasive breast carcinoma
Clinicopathologic characteristics No. of case (%)
Cox proportional hazard survival regression method, controlling for age, tumor size, tumor grade, status of lymph node metastasis, expression of ER, and PR. p- values of less than 0.05 were considered statistically significant. Statistical analysis was performed using the SPSS Statistical Package (version 12.0.1; SPSS, Chicago, USA).
RESULTS
Clinicopathologic characteristics
Of the 530 invasive carcinomas, most cases were ductal (497 cases, 93.8%). The distribution of 530 invasive carci- noma cases according to clinicopathologic characteristics at diagnosis is summarized in Table 2. The median age at the time of diagnosis was 46.0 yr (range, 26-85 yr). A total of 120 cases (22.6%) were grade 1, 247 cases (46.4%)
grade 2, and 141 cases (26.6%) grade 3. Information on tumor size and lymph node status was available for 515 cases. Tumor size ranged from 2 mm to 10 cm in maximal diameter. A total of 234 cases (44.2%) had tumors 2 cm or less in its greatest dimension (T1), 259 cases (48.9%) had tumors between 2 and 5 cm (T2), and 22 cases (4.2%) with tumors more than 5 cm (T3). A total of 227 cases (42.9%) showed lymph node metastasis.
ErbB-2 status was evaluated with immunohistochemical staining or FISH on 502 carcinomas. Among these cases, 120 (23.9%) showed positivity on immunohistochemical staining or gene amplification on the FISH test. ER status was available on 526 carcinomas. ER expression was seen in 299 cases (56.4%).
Frequency of p-Akt and p-mTOR expression Using the criteria described above, weak and strong
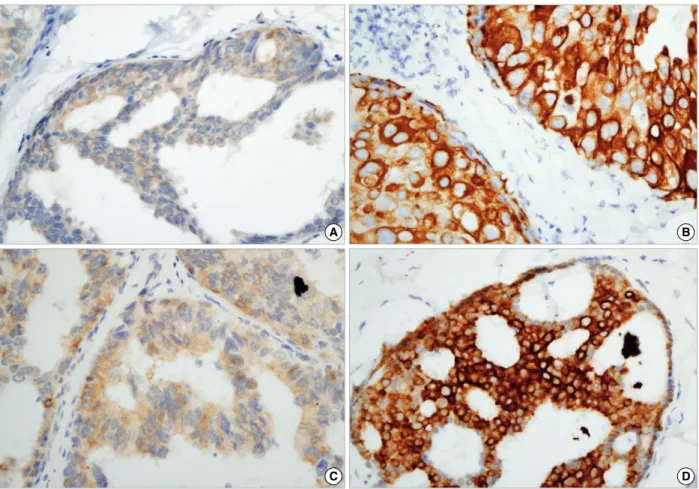
Figure 1. Representative results of phosphorylated Akt (p-Akt) and phosphorylated mTOR (p-mTOR) immunohistochemical staining in samples of ductal carcinoma in situ (×400). (A) A sample with weak staining of p-Akt. (B) A sample with strong staining of p-Akt. (C) A sample with weak staining of p-mTOR. (D) A sample with strong staining of p-mTOR.
C D
A B
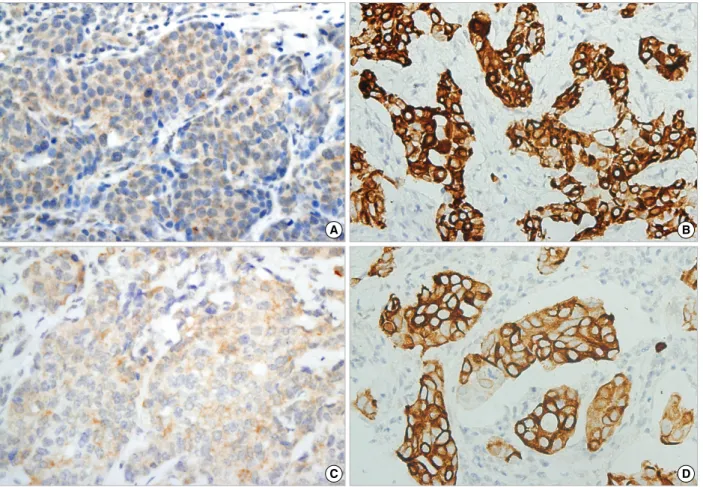
p-Akt staining were detected in, respectively, 6 and 21 of 30 (20.0% and 70.0%) DCISs (Figure 1A, B). In 530 invasive carcinomas, there were 180 (34.0%) samples with weak p-Akt expression and 288 (54.3%) with strong p-Akt expression (Figure 2A, B). Of the 30 DCISs, 7 cases (23.3%) showed weak p-mTOR expression and 21 (70.0%) cases exhibited strong expression (Figure 1C, D). In invasive carcinomas, weak and strong p-mTOR expression was observed in 136 (25.7%) and 207 (39.1%) of 530 cases (Figure 2C, D). There were differences in expression of p-mTOR between DCISs and invasive carcinomas (p=
0.001). A significant correlation was seen between p-Akt and p-mTOR expression in invasive carcinomas (p=0.002) in Fisher’s exact test. Consistent with immunohistoche- mical findings for p-mTOR, the results of western blot analysis were in accord with those of immunohistoche-
mical analysis in the 5 breast tumors (Figure 3).
Association with p-Akt and p-mTOR expression and clinicopathological parameters
Tables 3, 4 show the relationships between expression of p-Akt or p-mTOR and clinicopathologic parameters of invasive carcinomas. Expression of p-Akt was associ- ated with expression of ER (p=0.045) and PR (p=0.003), and was inversely associated with metastasis of lymph nodes (p<0.001). However, no association was noted with erbB-2 status (p=0.167), tumor grade (p=0.884), and tumor size (0.306). Expression of p-mTOR was associated with expression of ER (p=0.040) and PR (p=0.009), and was inversely associated with tumor size (p<0.001). Expression of p-Akt and p-mTOR each showed a significant associa- tion with early stage (p=0.027 and p=0.002, respectively).
Figure 2. Representative results of phosphorylated Akt (p-Akt) and phosphorylated mTOR (p-mTOR) immunohistochemical staining in samples of invasive ductal carcinoma (×400). (A) A sample with weak staining of p-Akt. (B) A sample with strong staining of p-Akt. (C) A sample with weak staining of p-mTOR. (D) A sample with strong staining of p-mTOR.
C D
A B
Patient survival according to expression of p-Akt and p-mTOR
Of 530 patients with invasive carcinoma, 118 had local recurrence or distant metastasis, and 65 died of their disease. Concerning p-Akt and p-mTOR, patients with negative (score 0) or weak (score 1) expression were com- pared with those with strong (score 2) expression, because there was no difference between groups with score 0 and
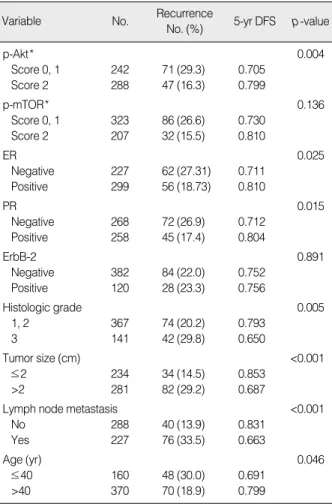
score 1 in the survival analysis. Univariate analysis using the Kaplan-Meier method together with the log-rank test was performed to investigate possible associations of DFS with p-Akt, p-mTOR and other clinicohistologic characteristics (Table 5). Strong expression of p-Akt, positivity for ER and PR, and low tumor grade were asso- ciated with longer DFS. The 5-yr DFS rate was 70.5%
in tumors with negative or weak expression of p-Akt, Figure 3. Western blot validation of immunohistochemical staining of phosphorylated-mTOR (×400). (A) Positive bands in 3 human breast carcinoma cell lines and 4 cases of breast tumors were found on western blots. (B-E) In cases having 1-4 breast tumors, immunohistochemical staining of paraffin tissue is well correlated with bands on western blot analysis.
D E
B C
A p-mTOR
Actin
SK-Br3 MDA-MD-231MDA-MB-468Case 1 Case 2 Case 3 Case 4
ER=estrogen receptor; PR=progesterone receptor.
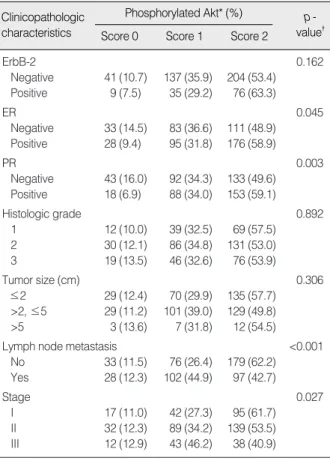
*Tumors without reaction were scored as 0, tumors with 1-50% of cells with weak staining or 1-10% of cells with strong staining were scored as 1, and tumors with >50% of cells with weak staining or >10% of cells with strong staining were scored as 2; �Statistical analyses were done with Fisher’s exact tests.
ErbB-2 0.162
Negative 41 (10.7) 137 (35.9) 204 (53.4) Positive 9 (7.5) 35 (29.2) 76 (63.3)
ER 0.045
Negative 33 (14.5) 83 (36.6) 111 (48.9) Positive 28 (9.4) 95 (31.8) 176 (58.9)
PR 0.003
Negative 43 (16.0) 92 (34.3) 133 (49.6) Positive 18 (6.9) 88 (34.0) 153 (59.1)
Histologic grade 0.892
1 12 (10.0) 39 (32.5) 69 (57.5) 2 30 (12.1) 86 (34.8) 131 (53.0) 3 19 (13.5) 46 (32.6) 76 (53.9)
Tumor size (cm) 0.306
≤2 29 (12.4) 70 (29.9) 135 (57.7)
>2, ≤5 29 (11.2) 101 (39.0) 129 (49.8)
>5 3 (13.6) 7 (31.8) 12 (54.5)
Lymph node metastasis <0.001
No 33 (11.5) 76 (26.4) 179 (62.2) Yes 28 (12.3) 102 (44.9) 97 (42.7)
Stage 0.027
I 17 (11.0) 42 (27.3) 95 (61.7) II 32 (12.3) 89 (34.2) 139 (53.5) III 12 (12.9) 43 (46.2) 38 (40.9)
Table 3. Correlation between phosphorylated Akt and clinico- pathologic characteristics
Clinicopathologic characteristics
Phosphorylated Akt* (%) Score 0 Score 1 Score 2
p - value�
ER=estrogen receptor; PR=progesterone receptor.
*Tumors without reaction were scored as 0, tumors with 1-50% of cells with weak staining or 1-10% of cells with strong staining were scored as 1, and tumors with >50% of cells with weak staining or >10% of cells with strong staining were scored as 2; �Statistical analyses were done with Fisher’s exact tests.
ErbB-2 0.268
Negative 141 (36.9) 95 (24.9) 146 (38.2) Positive 35 (29.2) 31 (25.8) 54 (45.0)
ER 0.040
Negative 90 (39.6) 62 (27.3) 75 (33.0) Positive 96 (32.1) 72 (24.1) 131 (43.8)
PR 0.009
Negative 110 (41.0) 68 (25.4) 90 (33.6) Positive 76 (29.3) 67 (25.9) 116 (44.8)
Histologic grade 0.262
1 39 (32.5) 26 (21.7) 55 (45.8) 2 85 (34.4) 70 (28.3) 92 (37.2) 3 58 (41.1) 33 (23.4) 50 (35.5)
Tumor size (cm) <0.001
≤2 63 (26.9) 64 (27.4) 107 (45.7)
>2, ≤5 108 (41.7) 65 (25.1) 86 (33.2)
>5 14 (63.6) 4 (18.2) 4 (18.2)
Lymph node metastasis 0.350
No 98 (34.0) 70 (25.0) 118 (41.0) Yes 87 (38.3) 61 (26.9) 81 (34.8)
Stage 0.002
I 41 (25.9) 43 (27.2) 74 (46.8) II 104 (39.4) 60 (22.7) 100 (37.9) III 40 (43.0) 30 (32.3) 23 (24.7)
Table 4. Correlation between phosphorylated mTOR and clini- copathologic characteristics
Clinicopathologic characteristics
Phosphorylated mTOR* (%) Score 0 Score 1 Score 2
p - value�
Disease-free survival
1.0
0.8
0.6
0.4
0.2
0.0
0 100 200 300 400
Months
p=0.136
p-mTOR 0/+
p-mTOR ++
Figure 5. Kaplan-Meier plots with log-rank tests of disease-free survival (DFS) in invasive carcinomas in relation to different levels of p-mTOR expression. In contrast to p-Akt, p-mTOR expression had no significant association with DFS (p=0.136).
Disease-free survival
1.0
0.8
0.6
0.4
0.2
0.0
0 100 200 300 400
Months
p=0.004
p-Akt 0/+
p-Akt ++
Figure 4. Kaplan-Meier plots with log-rank tests of disease-free survival (DFS) in invasive carcinomas in relation to different levels of p-Akt expression. The rate of DFS was significantly higher in patients with p-Akt strong-positive tumors than in those with p- Akt negative/weak-positive tumors (p=0.004).
whereas it was 79.9% in p-Akt strong-positive tumors (p=0.004). This difference is shown in Figure 4. Patients with large tumor size, metastasis in the lymph nodes and young age had decreased DFS. In contrast to p-Akt, p- mTOR expression showed no statistical significance in DFS (p=0.136) (Figure 5).
As shown in Table 6, multivariate regression analysis using the Cox proportional hazards regression model, including p-Akt, p-mTOR, ER, PR, tumor grade, tumor size, status of lymph node metastasis and age, demon- strated the tumor size (hazard ratio, 1.730; p=0.009) and
the status of lymph node metastasis (hazard ratio, 2.247;
p<0.001) to be independent prognostic factors for DFS.
None of the other parameters that were studied showed a significant effect on DFS, although strong expression of p-Akt tended to be associated with longer DFS (p=
0.066).
DISCUSSION
The present study evaluated the expression of p-Akt and p-mTOR. We found a correlation between p-Akt and p-mTOR, indicating that Akt is a main up-regulator of the downstream target, mTOR, although there are com- plex regulatory pathways upstream of mTOR. p-Akt p-Akt=phosphorylated Akt; p-mTOR=phosphorylated mTOR; ER=
estrogen receptor; PR=progesterone receptor; DFS=disease-free survival.
*Tumors without reaction were scored as 0, tumors with 1-50% of cells with weak staining or 1-10% of cells with strong staining were scored as 1, and tumors with >50% of cells with weak staining or >10% of cells with strong staining were scored as 2.
p-Akt* 0.004 Score 0, 1 242 71 (29.3) 0.705
Score 2 288 47 (16.3) 0.799
p-mTOR* 0.136
Score 0, 1 323 86 (26.6) 0.730
Score 2 207 32 (15.5) 0.810
ER 0.025
Negative 227 62 (27.31) 0.711 Positive 299 56 (18.73) 0.810
PR 0.015
Negative 268 72 (26.9) 0.712
Positive 258 45 (17.4) 0.804
ErbB-2 0.891
Negative 382 84 (22.0) 0.752
Positive 120 28 (23.3) 0.756
Histologic grade 0.005
1, 2 367 74 (20.2) 0.793
3 141 42 (29.8) 0.650
Tumor size (cm) <0.001
≤2 234 34 (14.5) 0.853
>2 281 82 (29.2) 0.687
Lymph node metastasis <0.001
No 288 40 (13.9) 0.831
Yes 227 76 (33.5) 0.663
Age (yr) 0.046
≤40 160 48 (30.0) 0.691
>40 370 70 (18.9) 0.799
Table 5. Univariate analysis of variables in relation to disease- free survival (DFS) in 530 cases of invasive ductal carcinoma of the breast
Variable No. Recurrence
No. (%) 5-yr DFS p-value
p-Akt=phosphorylated Akt; p-mTOR=phosphorylated mTOR; ER=
estrogen receptor; PR=progesterone receptor; CI=confidence interval.
*Tumors without reaction were scored as 0, tumors with 1-50% of cells with weak staining or 1-10% of cells with strong staining were scored as 1, and tumors with >50% of cells with weak staining or >10% of cells with strong staining were scored as 2.
p-Akt* 0.066
Score 0, 1 1
Score 2 0.694 (0.470-1.025)
p-mTOR* 0.297
Score 0, 1 1
Score 2 0.794 (0.515-1.225)
ER 0.717
Negative 1
Positive 0.910 (0.548-1.513)
PR 0.251
Negative 1
Positive 0.743 (0.447-1.234)
Histologic grade 0.183
1, 2 1
3 1.323 (0.876-1.997)
Tumor size (cm) 0.009
≤2 1
>2 1.730 (1.144-2.618)
Lymph node metastasis <0.001
No 1
Yes 2.247 (1.507-3.353)
Age (yr) 0.178
≤40 1
>40 0.767 (0.521-1.129)
Table 6. Cox Multivariate regression analyses of variables in relation to disease-free survival in 530 cases of invasive ductal carcinoma of the breast
Variable Hazard ratio (95% CI) p -value
exhibited a high incidence of weak and strong expression, 34.0% and 54.3% respectively, in invasive breast carci- nomas. Frequency of weak and strong expression of p- mTOR was 25.7% and 39.1% in the same samples. So far, expression of activated Akt and/or mTOR has been eval- uated by immunohistochemistry in various human cancers including carcinomas of breast, stomach, lung, ovary and liver, and brain glioblastoma.(9,18-24) In breast carci- noma, the rate of p-Akt and p-mTOR overexpression has been reported as 38% to 93.5% and 24% to 69.7%, respectively. This broad range of reported frequencies of both proteins may be due to various factors such as the different criteria for positivity, detection techniques, and patient sample size.
The results of this study showed that TOR is more fre- quently activated in DCISs than in invasive breast carci- nomas (p=0.001). These data are in agreement with recent studies. Bose et al.(20) found high levels of p-Akt and p-mTOR in DCISs as well as in invasive ductal carci- nomas, and p-mTOR was more frequently found in DCIS than in invasive ductal carcinomas. Zhou et al.(9) reported similar data regarding expression of p-Akt and p-mTOR.
In a study with hepatocellular carcinoma and adenoma, phosphorylated mTOR was detected in 15% of hepatocel- lular carcinomas and 33% of hepatic adenomas, immuno- histologically.(24) Taking these results into account, it is postulated that activation of the PI3K/Akt/mTOR path- way might be an early event in mammary carcinogen- esis.(9)
In the analysis of clinicopathologic parameters, we observed a positive correlation of p-Akt or p-mTOR with ER and PR, but not with erbB-2. The direct and indirect activation of the Akt/mTOR pathway by erbB-2 in breast carcinomas was suggested in many studies.(9, 25) Although down-stream regulation of the PI3K/Akt/
mTOR pathway by the receptor tyrosine kinase family was demonstrated in some studies,(18,26) others failed to show such a correlation.(20,21) Instead, other reports suggested ER as an upstream regulator of the Akt/mTOR pathway.(19,22) In a study of 692 invasive breast carci- nomas, Panigrahi et al.(19) found a positive significant correlation of p-AKT with ER, as was found in our study
which suggests the ER as a potential upstream component in development of breast carcinoma rather than PTEN or erbB-2.
Our results suggest the usefulness of mTOR as a ther- apeutic target of breast cancer as well as revealing the pathogenesis of breast cancer. In a recent phase II clinical study, responses to everolimus occurred only in patients with ER-positive breast cancer.(27) The Akt/mTOR path- way stimulated by ER can be considered as an underlying mechanism for the results of that clinical trial.
We investigated the prognostic significance of these activated proteins using Kaplan-Meier survival analysis.
In univariate analysis, strong expression of p-Akt had a favorable effect on DFS. This effect was not found on multivariate analysis with p-Akt, p-mTOR, tumor grade, tumor size, status of lymph node metastasis, status of ER, PR and age. These findings suggest tumor size and lymph node metastasis as independent prognostic factors for decreased DFS. Although the prognostic value of p- Akt in our study is not clear, some previous studies have observed a correlation between higher p-Akt expression and poorer clinical outcomes in breast carcinomas,(9,18, 26) whereas other reports have not demonstrated any correlation between p-Akt or mTOR expression and clin- ical outcomes.(21)
There are several studies in agreement with our findings.
A study by Panigrahi et al.(19) reported that p-Akt expres- sion correlated inversely with adverse tumor variables such as higher grade, larger invasive tumor size, and the Nottingham prognostic index, but Kaplan-Meier survival analysis and multivariate analysis did not show an asso- ciation with p-Akt immunopositivity and survival. In a study with 63 patients with endometrioid-type endome- trial carcinoma, Mori et al.(28) obtained similar results- that higher p-Akt expression appeared to be associated with longer relapse-free survival in univariate analysis.
Of note is that these results, including ours, are not com- patible with the theory that Akt promotes tumor growth and aggressiveness by an anti-apoptotic function and pro-cell cycle entry properties. To explain this discor- dance, Mori et al. suggested that higher p-Akt expression correlates with better prognoses for tumors in estrogen-
responsive tissues, including breast, ovarian, and endo- metrial cancer tissue.
Likewise, Al-Bazz et al.(22), in a recent study with 49 invasive breast carcinomas using immunoblot analysis, found a significant relationship between p-Akt levels and ER status. These authors also observed that intermediate levels of p-Akt were associated with a lower probability of recurrence in univariate analysis, while none of the p-Akt levels showed statistical significance in multivariate analysis. In contrast, the studies, which showed correl- ated expression of Akt and erbB-2, revealed a signifi- cant association between p-Akt and poor prognosis.(9,26) Taking these results into account, the relatively favorable effect of p-Akt on survival in our study may be derived from the well-established relationship between ER posi- tivity and good prognosis, or the loss of ER positivity in the late stage of breast carcinomas. In addition, possible cross-talk between the ER pathway and the PI3K/Akt/
mTOR pathway controlled by tyrosine kinase receptor family members might be considered as an underlying mechanism for this survival result.
In comparison with p-Akt, p-mTOR has been less often studied in breast tumors.(9,20) mTOR seems to be less highlighted than other molecules involved in the PI3k/
Akt/mTOR signaling pathway such as PTEN, PI3K, S6K1 or Akt do. Preclinical studies suggested that mTOR or p-mTOR is not useful as a predictive marker for rapamycin or its analogues in breast cancer cell lines, and demon- strated that patients with p-mTOR expression show a significantly lower DFS rate and that p-mTOR does not show a significant association with ER.(21,29) In our study, p-mTOR expression is not associated with DFS but cor- relates with ER expression. These findings suggest that the effect of p-mTOR on survival might also be influenced by the association of p-mTOR with ER status.
Although many clinical trials are going on to evaluate the effect of mTOR inhibitors in the treatment of various tumors, who will derive a benefit from mTOR inhibition remains unclear. Thus, there is the need to identify pre- dictive markers to select suitable patients for mTOR inhibition. Therefore, several components of the PI3K/
Akt/mTOR signaling pathway are under intensive inves-
tigation as predictors for mTOR inhibition as well as potential therapeutic targets. In a clinical trial in patients with advanced renal cell carcinoma, p-Akt was suggested as a predictive marker for treatment with rapamycin and its analogues.(30) An understanding of the expression and functions of various components of the PI3K/Akt/
mTOR pathway would be important to the application of mTOR in the treatment of cancer in this era of indi- vidually tailored medicine.
CONCLUSION
PI3K/Akt/mTOR pathway is active in DCIS as well as in invasive carcinoma of breast. The PI3K/Akt/mTOR pathway can be influenced by ER more than by erbB-2, and the prognosis in breast carcinoma may depend on the relationship between the Akt/mTOR pathway and ER status. Our data will contribute to the development and application of the PI3K/Akt/mTOR signaling pathway in targeted therapy.
REFERENCES
1. Borg A, Fernö M, Peterson C. Predicting the future of breast cancer.
Nat Med 2003;9:16-8.
2. Lichtner RB. Estrogen/EGF receptor interactions in breast cancer:
rationale for new therapeutic combination strategies. Biomed Phar- macother 2003;57:447-51.
3. Huang S, Houghton PJ. Targeting mTOR signaling for cancer therapy.
Curr Opin Pharmacol 2003;3:371-7.
4. Wullschleger S, Loewith R, Hall MN. TOR signaling in growth and metabolism. Cell 2006;124:471-84.
5. Smolewski P. Recent developments in targeting the mammalian target of rapamycin (mTOR) kinase pathway. Anticancer Drugs 2006;17:
487-94.
6. Gingras AC, Raught B, Sonenberg N. Regulation of translation initi- ation by FRAP/mTOR. Genes Dev 2001;15:807-26.
7. Jacinto E, Hall MN. Tor signalling in bugs, brain and brawn. Nat Rev Mol Cell Biol 2003;4:117-26.
8. Schmelzle T, Hall MN. TOR, a central controller of cell growth. Cell 2000;103:253-62.
9. Zhou X, Tan M, Stone Hawthorne V, Klos KS, Lan KH, Yang Y, et al. Activation of the Akt/mammalian target of rapamycin/4E-BP1 pathway by ErbB2 overexpression predicts tumor progression in breast cancers. Clin Cancer Res 2004;10:6779-88.
10. Xu G, Zhang W, Bertram P, Zheng XF, McLeod H. Pharmacogenomic profiling of the PI3K/PTEN-AKT-mTOR pathway in common human
tumors. Int J Oncol 2004;24:893-900.
11. Yao JC, Phan AT, Chang DZ, Wolff RA, Hess K, Gupta S, et al.
Efficacy of RAD001 (everolimus) and octreotide LAR in advanced low- to intermediate-grade neuroendocrine tumors: results of a phase II study. J Clin Oncol 2008;26:4311-8.
12. Motzer RJ, Escudier B, Oudard S, Hutson TE, Porta C, Bracarda S, et al. Efficacy of everolimus in advanced renal cell carcinoma: a double- blind, randomised, placebo-controlled phase III trial. Lancet 2008;
372:449-56.
13. Baselga J, Semiglazov V, van Dam P, Manikhas A, Bellet M, Mayor- domo J, et al. Phase II randomized study of neoadjuvant everolimus plus letrozole compared with placebo plus letrozole in patients with estrogen receptor-positive breast cancer. J Clin Oncol 2009;27:2630-7.
14. Baselga J. Combining the anti-EGFR agent gefitinib with chemothe- rapy in non-small-cell lung cancer: how do we go from INTACT to impact? J Clin Oncol 2004;22:759-61.
15. Elston CW, Ellis IO, Pinder SE. Pathological prognostic factors in breast cancer. Crit Rev Oncol Hematol 1999;31:209-23.
16. Harvey JM, Clark GM, Osborne CK, Allred DC. Estrogen receptor status by immunohistochemistry is superior to the ligand-binding assay for predicting response to adjuvant endocrine therapy in breast cancer. J Clin Oncol 1999;17:1474-81.
17. Wolff AC, Hammond ME, Schwartz JN, Hagerty KL, Allred DC, Cote RJ, et al. American Society of Clinical Oncology/College of American Pathologists guideline recommendations for human epi- dermal growth factor receptor 2 testing in breast cancer. J Clin Oncol 2007;25:118-45.
18. Pérez-Tenorio G, Stål O. Activation of AKT/PKB in breast cancer predicts a worse outcome among endocrine treated patients. Br J Cancer 2002;86:540-5.
19. Panigrahi AR, Pinder SE, Chan SY, Paish EC, Robertson JF, Ellis IO. The role of PTEN and its signalling pathways, including AKT, in breast cancer; an assessment of relationships with other prognostic factors and with outcome. J Pathol 2004;204:93-100.
20. Bose S, Chandran S, Mirocha JM, Bose N. The Akt pathway in human breast cancer: a tissue-array-based analysis. Mod Pathol 2006;19:
238-45.
21. Noh WC, Kim YH, Kim MS, Koh JS, Kim HA, Moon NM, et al.
Activation of the mTOR signaling pathway in breast cancer and its correlation with the clinicopathologic variables. Breast Cancer Res Treat 2008;110:477-83.
22. Al-Bazz YO, Brown BL, Underwood JC, Stewart RL, Dobson PR.
Immuno-analysis of phospho-Akt in primary human breast cancers.
Int J Oncol 2009;35:1159-67.
23. Anagnostou VK, Bepler G, Syrigos KN, Tanoue L, Gettinger S, Homer RJ, et al. High expression of mammalian target of rapamycin is asso- ciated with better outcome for patients with early stage lung adeno- carcinoma. Clin Cancer Res 2009;15:4157-64.
24. Sahin F, Kannangai R, Adegbola O, Wang J, Su G, Torbenson M.
mTOR and P70 S6 kinase expression in primary liver neoplasms.
Clin Cancer Res 2004;10:8421-5.
25. Klos KS, Wyszomierski SL, Sun M, Tan M, Zhou X, Li P, et al.
ErbB2 increases vascular endothelial growth factor protein synthesis via activation of mammalian target of rapamycin/p70S6K leading to increased angiogenesis and spontaneous metastasis of human breast cancer cells. Cancer Res 2006;66:2028-37.
26. Schmitz KJ, Otterbach F, Callies R, Levkau B, Hölscher M, Hoffmann O, et al. Prognostic relevance of activated Akt kinase in node-negative breast cancer: a clinicopathological study of 99 cases. Mod Pathol 2004;17:15-21.
27. Ellard SL, Clemons M, Gelmon KA, Norris B, Kennecke H, Chia S, et al. Randomized phase II study comparing two schedules of evero- limus in patients with recurrent/metastatic breast cancer: NCIC Cli- nical Trials Group IND.163. J Clin Oncol 2009;27:4536-41.
28. Mori N, Kyo S, Sakaguchi J, Mizumoto Y, Ohno S, Maida Y, et al.
Concomitant activation of AKT with extracellular-regulated kinase 1/2 occurs independently of PTEN or PIK3CA mutations in endo- metrial cancer and may be associated with favorable prognosis. Cancer Sci 2007;98:1881-8.
29. Noh WC, Mondesire WH, Peng J, Jian W, Zhang H, Dong J, et al.
Determinants of rapamycin sensitivity in breast cancer cells. Clin Cancer Res 2004;10:1013-23.
30. Cho D, Signoretti S, Dabora S, Regan M, Seeley A, Mariotti M, et al. Potential histologic and molecular predictors of response to tem- sirolimus in patients with advanced renal cell carcinoma. Clin Geni- tourin Cancer 2007;5:379-85.