INTRODUCTION
Although the prevalence of edentulism is falling in all age groups,1the number of older people is still increasing. India, being a developing country and having a huge population, lacks awareness and management about edentulous state.2,3 Rehabilitating edentulous patients with complete dentures has been the treatment of choice. Study by van Waas4showed that statistically insignificant correlation exists between clin- ical variables and satisfaction in complete denture wearer. It was also found that only features of denture-supporting area assessed by clinician are poor predictors of satisfaction with complete denture wearer.5Because edentulism is a chronic dis- ease so functional improvement is more important than cure;
that’s why outcomes based on patient are most important.6This is also supported by other published literature that sensitivi-
ty of patient-based measure are more than functional measured to differentiate between treatments.7-9 Patient’s perception about subjective experience of their denture is also important for dentists to motivate complete denture wearers.
The success of complete dentures is dependent on the mul- tiple factors.10Patient perception is important for successful treat- ment. The author of the present study hypothesized that apart from biological and technical considerations in fabrication of complete dentures11,12different socio-demographic variables such as age, gender, literacy level, socio-economic and marital status may affect satisfaction towards complete dentures. To evaluate this, a standardized questionnaire that included questions from domains such as mastication, appearance, speech, comfort, health, denture care and social status was used to determine level of complete denture satisfaction with socio-demographic variables.
Effect of sociodemographic variables on complete denture satisfaction
Balendra Pratap Singh1*, MDS, Kedar Nath Pradhan2, MDS, Arvind Tripathi3, MDS, Reema Tua4, MD, Shuchi Tripathi5, MDS
1Department of Prosthodontics, Faculty of Dental Sciences, CSM Medical University, Lucknow, India
2Gangtok hospital, Gangtok, Sikkim, 3Department of prosthodontics, Saraswati dental college, Lucknow, India
4Department of social and preventive medicine, Faculty of medicine, CSM Medical University, Lucknow, India
5Department of Prosthodontics, CSM Medical University, Lucknow, India
PURPOSE. The objective of this study was to evaluate the effect of sociodemographic factors on quality of satisfaction towards denture treat- ment. MATERIALS AND METHODS. One hundred subjects (filling inclusion criteria) who were wearing a denture for at least two months were enrolled and divided into five groups on the basis of sociodemographic variables (age, gender, literacy level, socio-economic and marital sta- tus). Questionnaires consisting of 38 questions (positive and negative attitude towards denture satisfaction) related to patients’perception of clinical outcome in different domains such as mastication, appearance, speech, comfort, health, denture care and social status were scored by the subjects. Questions reflecting positive attitude were scored as 2, 1, or 0 (yes, uncertain and no, respectively) and reversely for the neg- ative questions. Statistical analysis was done by using Statistical Package for Social Sciences (α= .05). RESULTS. Level of denture satisfaction was higher in age subgroup belonging to 45 - 65 years of age in relation to comfort, health and denture care. Female and male showed sig- nificant priority for denture treatment because of esthetic and function respectively. Level of satisfaction was statistically significant with liter- acy level. Upper high income group showed significantly higher level of satisfaction only in case of social status. Married group showed sig- nificantly higher satisfaction level only with comfort. CONCLUSION. Patients’sociodemographic variables were influential factors on denture satisfaction. [J Adv Prosthodont 2012;4:43-51]
KEY WORDS: Dentures; Satisfaction; Compliance; Socio-economic status; Educational status
Corresponding author: Balendra Pratap Singh
Department of Prosthodontics, Faculty of Dental Sciences, CSM Medical University Flat no. 101, new teachers apartment, TG Hostel, chowk, Lucknow, 226003, India Tel. 91 09839121151: e-mail, [email protected]
Received January 14, 2012 / Last Revison January 31, 2012 / Accepted February 10, 2012
ⓒ 2012 The Korean Academy of Prosthodontics
This is an Open Access article distributed under the terms of the Creative Commons Attribution Non-Commercial License (http://creativecommons.org/licenses/by- nc/3.0) which permits unrestricted non-commercial use, distribution, and reproduction in any medium, provided the original work is properly cited.
MATERIALS AND METHODS
All the recruitment for the study was done from Prosthodontics clinic of Medical University, Lucknow. The subjects who fulfilled the inclusion criteria were enrolled in this study.
The inclusion criteria were; without systemic diseases (on the basis of medical history and physician consultation) which affect- ed oral functions, first time denture wearer, period of eden- tulousness between six months to one year and class 1 com- pletely edentulous patient according to classification of com- pletely edentulous state by American College of Prosthodontists.13 Patients were excluded if they belonged to class 2, 3 or 4 types, single arch complete denture and TMJ disorder. Approval for two study was taken from ethical committee of institution.
Subjects had the opportunity to withdraw at anytime and were voluntarily involved in this study with informed consent form signed. 45 - 79 years of subjects were included and asked for their socio-demographic variables such as age, gender, literacy level, socio-economic and marital status.
The socio-economic status was divided into upper high, upper middle and poor class based on the monthly income of the subjects.14
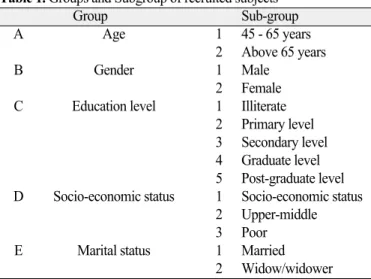
In this study, a total number of 136 subjects were enrolled that had fulfilled the inclusion criteria and had received complete dentures. All the included subjects were divided into five groups on the basis of age, gender, literacy (illiterate sub- jects were questioned orally by a lay person and ticked choice on behalf of subjects), socio-economic and marital sta- tus (Table 1).
Complete Denture was fabricated by post graduate student with four years clinical experience under guidance of the faculty member of the department using standard clinical and laboratory procedures. Their quality was assessed on the basis of quantifying method for denture quality by Sato et al.15as per which only good quality dentures were selected for the study. Before starting denture therapy, treatment eagerness (own will or advised by others) and priority for denture treat- ment esthetics, phonetics or function were questioned. At the denture insertion appointment, printed and verbal post inser- tion instructions were given to each patient with particular empha- sis to report to the Prosthodontic clinic after two months for follow up. Those patients who had been wearing their denture regularly (everyday for at least 8 hours) were included in the study. A standardized questionnaire of 38 questions was giv- en. Particular questions were related to either positive or negative attitudes. This questionnaire had 20 and 18 number of positive and negative attitudes questions. The questionnaire had domains of mastication, appearance, speech, comfort, health, denture care and social status. Questions (1 - 38) were record- ed as yes, no or uncertain. All the items of positive nature were scored as 2, 1, or 0 (yes, uncertain and no, respectively) and reversely for the negative items.
Statistical analysis was done by using Statistical Package for Social Sciences (version 15.0) (SPSS Inc., Chicago, IL, USA). Significance of percentage error of two groups was test- ed by Student “t”test and for level of significance “P”value was used. “P”value of less than .05 was considered statistically significant.
RESULTS
This study was conducted on 100 subjects who had received their complete dentures and were administered with questionnaires containing questions related to quality of satisfaction towards complete dentures. After completion of the questionnaires the scoring was done as per groups on the basis of different domains.
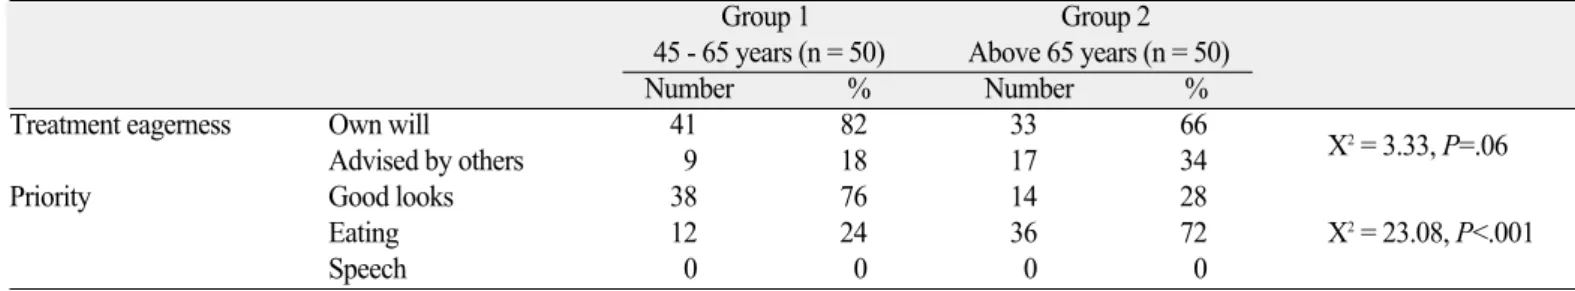
Table 2 showed that esthetics and function were significant priority for denture treatment for subgroup 1 and subgroup 2, respectively. Level of satisfaction was higher in subgroup 2 sub- jects regarding their mastication, appearance, comfort, health, denture care and social status except speech in which subgroup 1 subjects showed more satisfaction (Table 3).
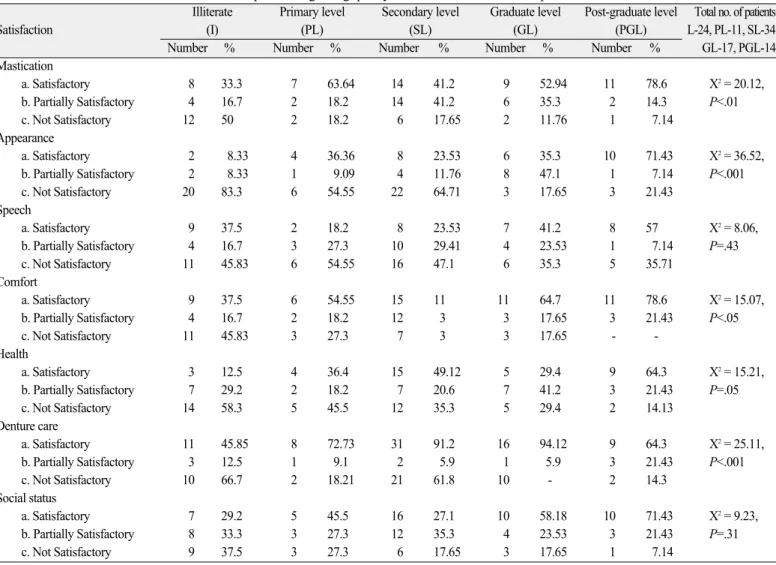
Literate sub-group of subjects were self motivated and more aware for motivated and more aware for esthetic and func- tion in comparison to illiterate sub group (Table 6). Level of satisfaction in mastication, appearance, speech, comfort, health, denture care and social status were found statistically significant with literacy level. Majority of illiterate patient showed partial satisfaction or dissatisfaction (Table 7).
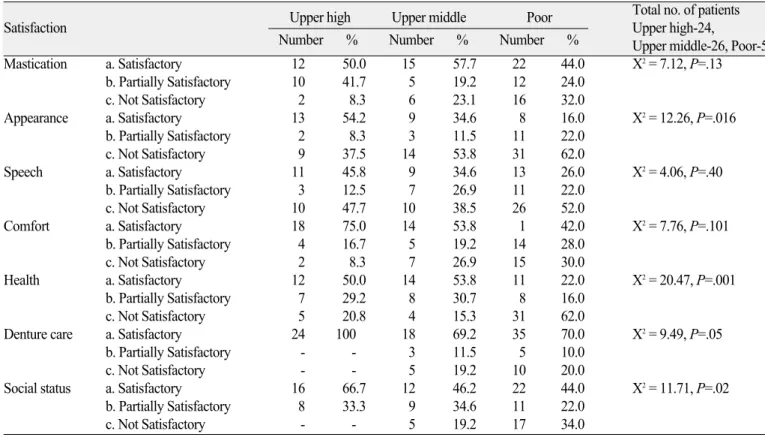
Poor income subjects were advised by others to get denture treatment and their priority was eating properly with complete denture (Table 8). Level of satisfaction was higher in upper high income group regarding appearance, speech, comfort, denture care and social status but significantly only in case of social
Table 1. Groups and Subgroup of recruited subjects
Group Sub-group
A Age 1 45 - 65 years
2 Above 65 years
B Gender 1 Male
2 Female C Education level 1 Illiterate
2 Primary level 3 Secondary level 4 Graduate level 5 Post-graduate level D Socio-economic status 1 Socio-economic status
2 Upper-middle 3 Poor
E Marital status 1 Married
2 Widow/widower
Table 3. Age-wise distribution of patients regarding quality of satisfaction towards complete denture
Sub-group 1 Sub-group 2
Satisfaction 45 - 65 years (n = 50) Above 65 years (n = 50)
Number % Number %
Mastication a. Satisfactory 24 48 25 50 X2= 0.22, P=.89
b. Partially Satisfactory 14 28 13 26
c. Not Satisfactory 11 22 13 26
Appearance a. Satisfactory 3 26 17 34 X2= 1.53, P=.46
b. Partially Satisfactory 10 20 6 12
c. Not Satisfactory 27 54 27 54
Speech a. Satisfactory 18 36 16 32 X2= 0.15, P=.94
b. Partially Satisfactory 10 20 12 24
c. Not Satisfactory 22 44 32 44
Comfort a. Satisfactory 18 36 35 70 X2= 13.47, P<.001
b. Partially Satisfactory 14 28 10 20
c. Not Satisfactory 18 36 5 10
Health a. Satisfactory 12 24 23 46 X2= 5.37, P=.07
b. Partially Satisfactory 13 26 10 20
c. Not Satisfactory 25 50 17 34
Denture care a. Satisfactory 36 72 42 84 X2= 2.10, P=.35
b. Partially Satisfactory 5 10 3 6
c. Not Satisfactory 9 18 5 10
Social status a. Satisfactory 23 46 25 50 X2= 0.22, P=.90
b. Partially Satisfactory 16 32 14 28
c. Not Satisfactory 11 22 11 22
Table 2. Age-wise distribution of patients regarding their denture compliance
Group 1 Group 2
45 - 65 years (n = 50) Above 65 years (n = 50)
Number % Number %
Treatment eagerness Own will 41 82 33 66
X2= 3.33, P=.06
Advised by others 9 18 17 34
Priority Good looks 38 76 14 28
Eating 12 24 36 72 X2= 23.08, P<.001
Speech 0 0 0 0
Table 4. Gender-wise distribution of patients regarding their denture compliance
Male (n = 50) Female (n = 50)
Number % Number %
Treatment eagerness Own will 61 76.3 16 80
X2= 0.13, P=.72
Advised by others 19 23.7 4 20
Priority Good looks 6 7.5 10 50
Eating 74 92.5 10 50 X2= 21.50, P<.001
Speech 0 0 0 0
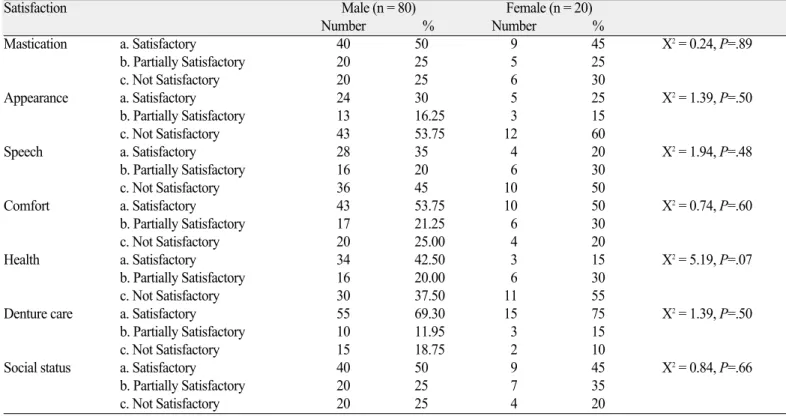
Table 5. Gender-wise distribution of patients regarding quality of satisfaction towards complete denture
Satisfaction Male (n = 80) Female (n = 20)
Number % Number %
Mastication a. Satisfactory 40 50 9 45 X2= 0.24, P=.89
b. Partially Satisfactory 20 25 5 25
c. Not Satisfactory 20 25 6 30
Appearance a. Satisfactory 24 30 5 25 X2= 1.39, P=.50
b. Partially Satisfactory 13 16.25 3 15
c. Not Satisfactory 43 53.75 12 60
Speech a. Satisfactory 28 35 4 20 X2= 1.94, P=.48
b. Partially Satisfactory 16 20 6 30
c. Not Satisfactory 36 45 10 50
Comfort a. Satisfactory 43 53.75 10 50 X2= 0.74, P=.60
b. Partially Satisfactory 17 21.25 6 30
c. Not Satisfactory 20 25.00 4 20
Health a. Satisfactory 34 42.50 3 15 X2= 5.19, P=.07
b. Partially Satisfactory 16 20.00 6 30
c. Not Satisfactory 30 37.50 11 55
Denture care a. Satisfactory 55 69.30 15 75 X2= 1.39, P=.50
b. Partially Satisfactory 10 11.95 3 15
c. Not Satisfactory 15 18.75 2 10
Social status a. Satisfactory 40 50 9 45 X2= 0.84, P=.66
b. Partially Satisfactory 20 25 7 35
c. Not Satisfactory 20 25 4 20
Table 6. Educational status-wise distribution of patients regarding their denture compliance
Illiterate Primary level Secondary Graduate Post-graduate (I) (PL) level (SL) level (GL) level (PGL) (n = 24) (n = 11) (n = 34) (n = 17) (n = 14)
Number % Number % Number % Number % Number %
Treatment Own will 13 54 7 64 28 82 10 59 12 86
X2= 8.21, P<.08
eagerness Advised by others 11 46 4 36 6 18 7 41 2 14
Priority Good looks 3 12.5 1 9.1 5 15 3 18 - -
Eating 21 87.5 10 90.9 29 85 14 82 14 100 X2= 2.75, P <.60
Speech 0 0 0 0 0 0 0 0 0 0
status. Upper middle income group was more satisfied with mas- tication and significantly satisfied with health (Table 9).
DISCUSSION
Limited number of documented literature was present on com- plete denture satisfaction on Indian population. Therefore, this study was planned to assess the level of satisfaction of the sub- jects wearing complete denture prosthesis reporting to the Prosthodontic Department of CSM Medical University,
Lucknow. This study would help subjects to show their sat- isfaction with the prostheses and it may help prosthodon- tists to pay increased attention to the factors of patient concern.
This study was carried out in one hundred edentulous sub- jects on the basis of questionnaires pertaining to level of satisfaction with complete dentures two months after dentures insertion. Quality of satisfaction questionnaires includes the domains of mastication, appearance, speech, comfort, health, denture care and social status of the subjects.
Regarding eagerness of subjects towards denture treatment
Table 7. Educational status-wise distribution of patients regarding quality of satisfaction towards complete denture
Illiterate Primary level Secondary level Graduate level Post-graduate level Total no. of patients:
Satisfaction (I) (PL) (SL) (GL) (PGL) L-24, PL-11, SL-34,
Number % Number % Number % Number % Number % GL-17, PGL-14
Mastication
a. Satisfactory 8 33.3 7 63.64 14 41.2 9 52.94 11 78.6 X2= 20.12,
b. Partially Satisfactory 4 16.7 2 18.2 14 41.2 6 35.3 2 14.3 P<.01
c. Not Satisfactory 12 50 2 18.2 6 17.65 2 11.76 1 7.14
Appearance
a. Satisfactory 2 8.33 4 36.36 8 23.53 6 35.3 10 71.43 X2= 36.52,
b. Partially Satisfactory 2 8.33 1 9.09 4 11.76 8 47.1 1 7.14 P<.001
c. Not Satisfactory 20 83.3 6 54.55 22 64.71 3 17.65 3 21.43
Speech
a. Satisfactory 9 37.5 2 18.2 8 23.53 7 41.2 8 57 X2= 8.06,
b. Partially Satisfactory 4 16.7 3 27.3 10 29.41 4 23.53 1 7.14 P=.43
c. Not Satisfactory 11 45.83 6 54.55 16 47.1 6 35.3 5 35.71
Comfort
a. Satisfactory 9 37.5 6 54.55 15 11 11 64.7 11 78.6 X2= 15.07,
b. Partially Satisfactory 4 16.7 2 18.2 12 3 3 17.65 3 21.43 P<.05
c. Not Satisfactory 11 45.83 3 27.3 7 3 3 17.65 - -
Health
a. Satisfactory 3 12.5 4 36.4 15 49.12 5 29.4 9 64.3 X2= 15.21,
b. Partially Satisfactory 7 29.2 2 18.2 7 20.6 7 41.2 3 21.43 P=.05
c. Not Satisfactory 14 58.3 5 45.5 12 35.3 5 29.4 2 14.13
Denture care
a. Satisfactory 11 45.85 8 72.73 31 91.2 16 94.12 9 64.3 X2= 25.11,
b. Partially Satisfactory 3 12.5 1 9.1 2 5.9 1 5.9 3 21.43 P<.001
c. Not Satisfactory 10 66.7 2 18.21 21 61.8 10 - 2 14.3
Social status
a. Satisfactory 7 29.2 5 45.5 16 27.1 10 58.18 10 71.43 X2= 9.23,
b. Partially Satisfactory 8 33.3 3 27.3 12 35.3 4 23.53 3 21.43 P=.31
c. Not Satisfactory 9 37.5 3 27.3 6 17.65 3 17.65 1 7.14
Table 8. Socio-economic status-wise distribution of patients regarding their denture compliance
Upper high (n = 24) Upper middle (n = 26) Poor (n = 50)
Number % Number % Number %
Treatment eagerness Own will 21 87.5 21 80.8 35 70
X2= 3.09, P=.21
Advised by others 3 12.5 5 19.2 15 30
Priority Good looks 2 8.4 4 15.4 1 2
Eating 2 91.6 22 87.62 49 98 X2= 3.85, P<.15
Speech 0 0 0 0 0 0
in age group category, it was found that maximum number of subgroup 1 subjects was self-motivated whereas subgroup 2 subjects were motivated by others for the treatment. In this find- ing, it is obvious that the subgroup 1 subjects at this age are socially active, professionally engaged and most of them are economically sound, for which the treatment is mandatory whereas in subgroup 2, age compromised, social and economic dependence and in some cases medically compromised con-
ditions like diabetes mellitus, hypertension, retinopathy etc. lim- ited for seeking denture treatment. In priority for denture treatment, subgroup 1 subjects were more conscious about their esthetics and subgroup 2 subjects were concerned towards func- tions. Subgroup 1 subjects consisted of potentially active age group which require social and professional acceptance in which esthetic concern is of utmost important. On the other hand, the subgroup 2 conscious of retired persons, age-wise and social-
Table 9. Socio-economic status-wise distribution of patients regarding quality of satisfaction towards complete denture
Upper high Upper middle Poor Total no. of patients
Satisfaction Upper high-24,
Number % Number % Number % Upper middle-26, Poor-50
Mastication a. Satisfactory 12 50.0 15 57.7 22 44.0 X2= 7.12, P=.13
b. Partially Satisfactory 10 41.7 5 19.2 12 24.0
c. Not Satisfactory 2 8.3 6 23.1 16 32.0
Appearance a. Satisfactory 13 54.2 9 34.6 8 16.0 X2= 12.26, P=.016
b. Partially Satisfactory 2 8.3 3 11.5 11 22.0
c. Not Satisfactory 9 37.5 14 53.8 31 62.0
Speech a. Satisfactory 11 45.8 9 34.6 13 26.0 X2= 4.06, P=.40
b. Partially Satisfactory 3 12.5 7 26.9 11 22.0
c. Not Satisfactory 10 47.7 10 38.5 26 52.0
Comfort a. Satisfactory 18 75.0 14 53.8 1 42.0 X2= 7.76, P=.101
b. Partially Satisfactory 4 16.7 5 19.2 14 28.0
c. Not Satisfactory 2 8.3 7 26.9 15 30.0
Health a. Satisfactory 12 50.0 14 53.8 11 22.0 X2= 20.47, P=.001
b. Partially Satisfactory 7 29.2 8 30.7 8 16.0
c. Not Satisfactory 5 20.8 4 15.3 31 62.0
Denture care a. Satisfactory 24 100 18 69.2 35 70.0 X2= 9.49, P=.05
b. Partially Satisfactory - - 3 11.5 5 10.0
c. Not Satisfactory - - 5 19.2 10 20.0
Social status a. Satisfactory 16 66.7 12 46.2 22 44.0 X2= 11.71, P=.02
b. Partially Satisfactory 8 33.3 9 34.6 11 22.0
c. Not Satisfactory - - 5 19.2 17 34.0
Table 10. Martial status-wise distribution of patients regarding their denture compliance
Married (n = 82) Widow/widower (n = 18)
Number % Number %
Treatment eagerness Own will 69 84.15 15 83.3
X2= 0.07, P=.78
Advised by others 13 15.85 3 16.7
Priority Good looks 15 18.3 2 11.11
Eating 67 81.7 16 88.89 X2= 0.54, P=.46
Speech 0 0 0 0
ly compromised for which functional aspect is more con- cerned.
While considering the quality of satisfaction towards com- plete denture therapy, subgroup 2 subjects were more satisfied with their dentures regarding all domains except speech where the subgroup 1 subjects were more satisfied. This finding may be due to the fact that the ageing population has overwhelming desire for satisfaction at all level of functions in their daily life which have been fulfilled by their den- tures. Other reasons might be due to older subjects do not pre- fer to go to dentist regarding poorly fitting denture and satisfied with their poorly fitting dentures.16It was also supported by the
fact that stereognostic ability is poor in older subjects than younger ones. It was found that presence of prosthesis improve stereognostic ability so subjects having poorer stereognostic ability showed more satisfaction than those having better stereognostic ability.17
Regarding eagerness towards denture treatment in gender cat- egory, female were self-motivated whereas the male were advised by others for the same (Table 4). This finding clearly showed that females are more aware and concerned about their den- ture treatment to restore their lost esthetic, social wellbeing and function. There were equal number of opinions of female towards function and esthetics for priority of making dentures where-
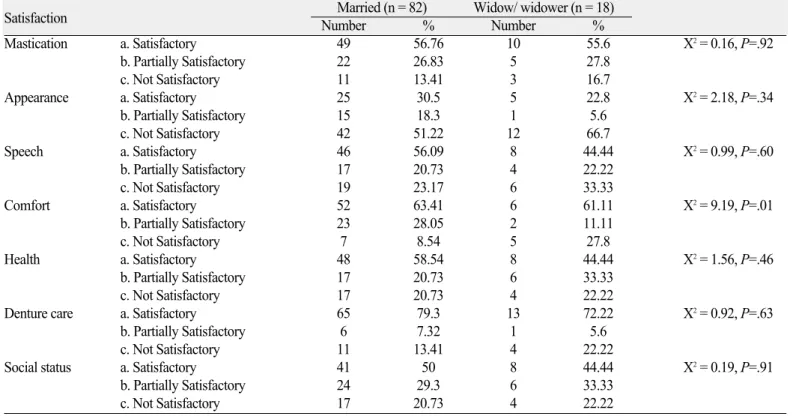
Table 11. Marital status-wise distribution of patients regarding quality of satisfaction towards complete denture
Satisfaction Married (n = 82) Widow/ widower (n = 18)
Number % Number %
Mastication a. Satisfactory 49 56.76 10 55.6 X2= 0.16, P=.92
b. Partially Satisfactory 22 26.83 5 27.8
c. Not Satisfactory 11 13.41 3 16.7
Appearance a. Satisfactory 25 30.5 5 22.8 X2= 2.18, P=.34
b. Partially Satisfactory 15 18.3 1 5.6
c. Not Satisfactory 42 51.22 12 66.7
Speech a. Satisfactory 46 56.09 8 44.44 X2= 0.99, P=.60
b. Partially Satisfactory 17 20.73 4 22.22
c. Not Satisfactory 19 23.17 6 33.33
Comfort a. Satisfactory 52 63.41 6 61.11 X2= 9.19, P=.01
b. Partially Satisfactory 23 28.05 2 11.11
c. Not Satisfactory 7 8.54 5 27.8
Health a. Satisfactory 48 58.54 8 44.44 X2= 1.56, P=.46
b. Partially Satisfactory 17 20.73 6 33.33
c. Not Satisfactory 17 20.73 4 22.22
Denture care a. Satisfactory 65 79.3 13 72.22 X2= 0.92, P=.63
b. Partially Satisfactory 6 7.32 1 5.6
c. Not Satisfactory 11 13.41 4 22.22
Social status a. Satisfactory 41 50 8 44.44 X2= 0.19, P=.91
b. Partially Satisfactory 24 29.3 6 33.33
c. Not Satisfactory 17 20.73 4 22.22
as the male were more concerned for the function. This showed that unlike males females were equally conscious about their esthetic as well as function after denture treatment.18
While considering the genders in this study, the majority of the denture wearer was male. It is because most of the Indian females are housewives. They have limited social interaction and the male/female ratio was also higher in the study popu- lation.19The quality of satisfaction in this study have been found that male were more satisfied than female in mastication, appearance, speech and health (Table 5). There was equal sat- isfaction level in comfort and social status of both the groups.
In denture care, female were found more satisfied than male.
It may appear because male patients are more complied towards denture treatment and satisfaction than their female counterparts. Taylor and Doku20surveyed 29 male and 30 female complete denture patients ranging from 52 - 92 years of age and found that male patients were more satisfied with dentures than female, which is similar to the present finding. Awad and Feine21and Baer et al.22also documented that satisfaction is also depend upon gender. The eagerness of treatment of post- graduate/professional level of literate group of subjects was found to be self-motivated followed by others literate groups, where- as the illiterate group of subjects has to be motivated by oth- ers for the denture treatment (Table 6). This finding revealed that with the increase in literacy rate there is increase in
treatment motivations, which may be related to awareness towards denture treatment. The need for denture treatment for esthet- ics as well as function was found higher with increased literacy level, whereas illiterate group was mainly concerned about their functions. This showed that with the increase in literacy rate there is awareness for esthetics as well as function towards den- ture treatment.
While studying quality of satisfaction of denture treatment of illiterate group of patients with the different levels of literate group, the level of satisfaction was found different in differ- ent literacy level. The overall level of satisfaction was found significantly higher in maximum literate level. Therefore, the level of satisfaction is higher with the increase in literacy rate. This finding revealed that literate subjects may easily under- stand the instruction and limitation of the artificial replacement of teeth.23With the increase in literacy rate there is increase in treatment motivation, which may be related to awareness towards denture treatment.
While studying the compliance of subjects, towards denture in different socio-economic status regarding motivation, the upper high income group subjects were self-motivated, where- as the poor income group of subjects was motivated by others for treatment (Table 8). This finding revealed that the denture treatment is directly related to the income status of subjects.
Regarding priority for denture treatment, maximum number
of poor income group subjects made their denture for function followed by upper high income group subjects were found max- imum in esthetics as well as function. These findings showed that poor income group subjects are more concerned about func- tion for their denture treatment, whereas the upper high and upper middle income group subjects were concerned about both esthet- ics and function.
The satisfaction level towards denture treatment in different economic status level revealed that in appearance and health, the upper and middle income group patients were found sig- nificantly higher in satisfaction than lower income group (Table 9) whereas in mastication, speech comfort, denture care and social status, satisfaction levels were increased with increase in socio-economic status. This finding revealed that the levels of satisfaction is increased with increase in socioe- conomic status, which may be due to either better awareness or better income status so that they can fulfill their desires.24 While considering the martial status of subjects regarding com- pliance towards treatment motivation, the present study has shown that there were no significant difference in married and wid- ow/widowers. Both married and widow/widower were found equally self-motivated and also have been motivated equally by others for denture treatment (Table 10). This similarity may be due to smaller sample size in widow/widower group, which may require further research on a larger sample size in female. While considering the priority for denture treatment, the concern for esthetics was found slightly higher in married and the concern for the function was found higher in wid- ow/widower group. This finding revealed that the widow/wid- ower are least concerned about their esthetics rather they want to restore the function due to various psychological problems whereas the married groups were concerned about both esthetics and function, as they may have been socially and professionally engaged.25
While considering the satisfaction levels of different martial status group of patients towards their complete denture, it is observed that mostly the married group of patients was more satisfied in all levels of satisfaction, whereas the widow/wid- ower group was either partially or dissatisfied (Table 11). This variation in martial status regarding satisfaction level reveals that the widow/widower group of patients was psychologically depressed in all satisfaction levels.
In this study, few limitations are present. Few subjects have complained to their dentist during the follow-up visit, thus introducing bias. This study have small sample size and short follow-up period. Further studies need to target more and diverse population.
CONCLUSION
Socio-demographic characteristics such as age, gender, socio-economic, educational and marital status were associ-
ated with denture satisfaction variables, but not significant with every variable. Although these variables may represent impor- tant co-factors in the patient’s acceptance of dental prosthesis, they may affect the way a patient perceives dental prosthesis outcomes. Aged over 65 years, male, higher income level, high- er literacy and married status are significantly associated with denture satisfaction with many but not all domains.
REFERENCES
1. Steele JG, Treasure E, Pitts NB, Morris J, Bradnock G. Total tooth loss in the United Kingdom in 1998 and implications for the fu- ture. Br Dent J 2000;189:598-603.
2. Shigli K, Hebbal M, Angadi GS. Attitudes towards replacement of teeth among patients at the Institute of Dental Sciences, Belgaum, India. J Dent Educ 2007;71:1467-75.
3. Shigli K, Angadi GS, Hebbal M. Knowledge of prosthodontic treatment among denture-wearers and non-denture-wearers at- tending a dental institute in India: a survey report. Gerodontology 2007;24:211-6.
4. van Waas MA. The influence of clinical variables on patients’
satisfaction with complete dentures. J Prosthet Dent 1990;63:307- 10.
5. Heydecke G, Locker D, Awad MA, Lund JP, Feine JS. Oral and general health-related quality of life with conventional and implant dentures. Community Dent Oral Epidemiol 2003;31:161- 8.
6. Silverman WA. Doing more good than harm. Ann N Y Acad Sci 1993;703:5-11.
7. Feine JS, de Grandmont P, Boudrias P, Brien N, LaMarche C, Tache′R, Lund JP. Within-subject comparisons of implant- supported mandibular prostheses: choice of prosthesis. J Dent Res 1994;73:1105-11.
8. Feine JS, Maskawi K, de Grandmont P, Donohue WB, Tanguay R, Lund JP. Within-subject comparisons of implant-supported mandibular prostheses: evaluation of masticatory function. J Dent Res 1994;73:1646-56.
9. Awad MA, Lund JP, Shapiro SH, Locker D, Klemetti E, Chehade A, Savard A, Feine JS. Oral health status and treatment satisfaction with mandibular implant overdentures and con- ventional dentures: a randomized clinical trial in a senior pop- ulation. Int J Prosthodont 2003;16:390-6.
10. van Waas MA. Determinants of dissatisfaction with dentures:
a multiple regression analysis. J Prosthet Dent 1990;64:569-72.
11. Vervoorn JM, Duinkerke AS, Luteijn F, van de Poel AC.
Assessment of denture satisfaction. Community Dent Oral Epidemiol 1988;16:364-7.
12. Ntala PC, Niarchou AP, Polyzois GL, Frangou MJ. Screening of edentulous patients in a dental school population using the prosthodontic diagnostic index. Gerodontology 2010;27:114-20.
13. Mazurat RD, Mazurat NM. Communicating complexity: Using a diagnostic classification system for edentulous patients. J Can Dent Assoc 2003;69:511-4.
14. Agarwal A. Social classification: the need to update in the present scenario. Indian J Community Med 2008;33:50-1.
15. Sato Y, Tsuga K, Akagawa Y, Tenma H. A method for quantifying complete denture quality. J Prosthet Dent 1998;80:52-7.
16. Mu¨ller F, Wahl G, Fuhr K. Age-related satisfaction with com- plete dentures, desire for improvement and attitudes to im- plant treatment. Gerodontology 1994;11:7-12.
17. Mantecchini G, Bassi F, Pera P, Preti G. Oral stereognosis in eden- tulous subjects rehabilitated with complete removable den- tures. J Oral Rehabil 1998;25:185-9.
18. Baran I, Ergu¨n G, Semiz M. Socio-demographic and econom- ic factors affecting the acceptance of removable dentures. Eur
J Dent 2007;1:104-10.
19. Central Statistical Organisation. "Women and men in India 2004", ministry of Statistics and Programme Implementation, CSO, Government of India, New Delhi, 2005.
20. Taylor RG, Doku HC. Dental survey of healthy older persons.
J Am Dent Assoc 1963;67:63-70.
21. Awad MA, Feine JS. Measuring patient satisfaction with mandibular prostheses. Community Dent Oral Epidemiol 1998;
26:400-5.
22. Baer ML, Elias SA, Reynolds MA. The use of psychological mea- sures in predicting patient satisfaction with complete dentures.
Int J Prosthodont 1992;5:221-6.
23. Celebic′A, Knezovic′-Zlataric′D, Papic′M, Carek V, Baucic′I, Stipetic′J. Factors related to patient satisfaction with complete denture therapy. J Gerontol A Biol Sci Med Sci 2003;58:M948- 53.
24. Berg E, Johnsen TB, Ingebretsen R. Social variables and patient acceptance of complete dentures. A study of patients attending a dental school. Acta Odontol Scand 1985;43:199-203.
25. Diehl RL, Foerster U, Sposetti VJ, Dolan TA. Factors associated with successful denture therapy. J Prosthodont 1996;5:84-90.