Survey of Thoracic CT Protocols and Technical Parameters in Korean Hospitals: Changes before and after Establishment of Thoracic CT Guideline by Korean Society of Thoracic Radiology in 2008
We retrospectively reviewed the thoracic CT scan protocols and technical parameters obtained from hospitals in Korea, one group during May 2007 (n = 100) and the other group during January 2012 (n = 173), before and after the establishment of the thoracic CT Guideline in 2008. Each group was also divided into two subgroups according to the health care delivery level, i.e. the “A” subgroup from primary and the “B” subgroup from secondary and tertiary care hospitals. When comparing the data from 2007 and 2012, the tube current decreased from 179.1 mAs to 137.2 mAs. The scan interval decreased from 6.4 mm to 4.8 mm. Also, the insufficient scan range decreased from 19.0% to 8.7%, and the suboptimal quality scans decreased from 33.0% to 5.2%. Between groups A and B, group B had lower tube voltages, smaller scan thicknesses, and smaller scan intervals.
However, group B had more phase numbers. In terms of the suboptimal quality scans, a decrease was seen in both groups. In conclusion, during the five-year time period between 2007 and 2012, a reduction in the tube current values was seen. And the overall image quality improved over the same time period. We assume that these changes are attributed to the implementation of the thoracic CT guideline in 2008.
Keywords: CT Guideline; Radiation Dose; Image Quality; Thoracic CT Ji-Won Kang, Kyung-Hyun Do,
Kichang Han, Eun-Jin Chae,
Dong-Hyun Yang, and Choong-Wook Lee Department of Radiology and Research Institute of Radiology, University of Ulsan College of Medicine, Seoul, Korea
Received: 20 October 2015 Accepted: 14 December 2015 Address for Correspondence:
Kyung-Hyun Do, MD
Department of Radiology and Research Institute of Radiology, University of Ulsan College of Medicine, Asan Medical Center, 88 Olympic-ro 43-gil, Songpa-gu, Seoul 05505, Korea E-mail: [email protected]
http://dx.doi.org/10.3346/jkms.2016.31.S1.S32 • J Korean Med Sci 2016; 31: S32-37
INTRODUCTION
The number of computed tomography (CT) examinations has been rapidly increasing due to the diagnostic usefulness and technical development. Worldwide, the number of CT scans increased from 1-3 examinations per 1,000 in the human popu- lation between 1977 and 1980 to approximately 35 examinations per 1,000 in the human population between 1997 and 2007 (1- 4). In Korea, there were 1.7 million CT examinations in 2003, and with a rapid increase to 4.8 million examinations in 2009 (Fig. 1) (5,6).
The concern for risks from increased radiation exposure is also increasing because CT examinations are the major source of radiation exposure (7,8). In 2006, the US National Council on Radiation Protection and measurements (NCRP) reported that while CT constitutes only 17% of all radiologic and nuclear med- icine examinations, it accounts for approximately 49% of the collective effective radiation dose due to the relatively high dose per examination (9). Under most circumstances, the risk to an individual patient for developing a malignant tumor due to the CT radiation is low and acceptable compared to the substantial benefit of the CT examination. However, the large number of
patients exposed suggests that even a small individual risk can cause a relatively large number of cancer developments (1,10, 11). Also, in pediatric patients, the lifelong amount of potential radiation exposure is very considerable (12-15).
As radiologists have a major role regarding radiologic exami- nations, we must assure proper radiation dose and good image quality in order to optimize CT examinations according to the general principles of “as low as reasonably achievable (ALARA)”
(16-19). For these goals, many countries have implemented continuing education policies with several countries announc- ing specific guidelines for CT scans, such as The American Col- lege of Radiology Practice Guideline and the European Guide- line on Quality Criteria for CT (2,4). Also in Korea, the Korean Society of Thoracic Radiology (KSTR) established the first tho- racic CT guideline in 2008 (Table 1) (20). Therefore, the purpose of our study is to analyze changes of thoracic CT protocols and technical parameters between 2007 and 2012, before and after the establishment of the thoracic CT guideline.
MATERIALS AND METHODS
We retrospectively reviewed outside hospital CT scans, one group
from a one-month period in May 2007 and the other group from a one-month period in January 2012. All of the CT scans were registered on a picture-archiving communication system (PACS) in our hospital, i.e. a single tertiary-care medical center, by a cli- nician for the purpose of obtaining the opinion of the thoracic radiologists. We randomly selected only one CT scan from each hospital, with a total of 100 CT scans from May 2007, and a total of 173 CT scans from January 2012. In addition, each group of scans was divided into two subgroups, A and B, according to the health care delivery level, i.e. the “A” subgroup from primary care hospitals and the “B” subgroup from secondary and tertia- ry care hospitals (Fig. 2).
We obtained variable CT dose parameters and the scan-ob- taining techniques from each CT scan, i.e. the tube voltage, tube
current, scan thickness, scan interval, and phase number. We got tube voltage, scan thickness, scan interval and phase num- ber from the DICOM information. The tube current was obtain- ed through two different ways. At first, we used data from the dose report sheet if available. Secondly in much more cases with no information from the dose report sheet, we obtained tube current values (mA) from the DICOM information at three points of the topmost level, the mid-thoracic/main pulmonary trunk level, and the lowest level of the CT scan. We calculated the mean value of those three levels. After that, we got “mAs”
value from multiplying mean tube current (mA) by exposure time (seconds).
Two radiologists analyzed the scan range and the image qual- ity. We defined insufficient scan range as the scan range that did not include lung apex or costophrenic angle, according to the KSTR thoracic CT guideline of 2008 (Table 1) (20). We de- fined excessive scan range, which is not specifically indicated in the KSTR thoracic CT guideline, as the scan range that includ- ed images more than the upper clavicle or more than the mid- kidney level. We defined poor image quality scan as the scan that had a large scan interval (≥ 10.0 mm), a gap (larger scan interval than scan thickness), or a severe artifact interfering the interpretation of the image. We also obtained data regarding whether or not the CT scans included the dose report sheet.
We compared the data between 2007 and 2012, using the Mann-Whitney test with continuous variables and the χ2 test with categorical variables. We also compared data between groups A and B, using the t-test or the Mann-Whitney test with continuous variables and the χ2 test or Fisher’s exact test with categorical variables. By convention, P value < 0.05 was con- sidered statistically significant.
Ethics statement
This study was approved by the institutional review board of Seoul Asan Medical Center (IRB No. S2013-1651-0002). Informed consent was waived by the board.
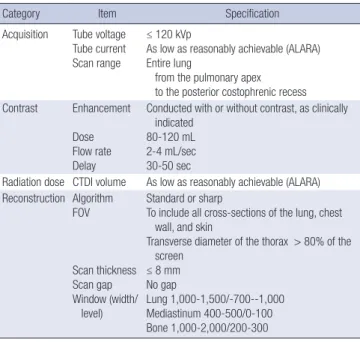
Table 1. Summary of the KSTR thoracic CT guideline in 2008 (20)
Category Item Specification
Acquisition Tube voltage Tube current Scan range
≤ 120 kVp
As low as reasonably achievable (ALARA) Entire lung
from the pulmonary apex to the posterior costophrenic recess Contrast Enhancement
Dose Flow rate Delay
Conducted with or without contrast, as clinically indicated
80-120 mL 2-4 mL/sec 30-50 sec
Radiation dose CTDI volume As low as reasonably achievable (ALARA) Reconstruction Algorithm
FOV
Scan thickness Scan gap Window (width/
level)
Standard or sharp
To include all cross-sections of the lung, chest wall, and skin
Transverse diameter of the thorax > 80% of the screen
≤ 8 mm No gap
Lung 1,000-1,500/-700--1,000 Mediastinum 400-500/0-100 Bone 1,000-2,000/200-300
Annual number of CT scans (thousands)
Year
2003 2004 2005 2006 2007 2008 2009 6,000
5,000
4,000
3,000
2,000
1,000
0
Fig. 1. The number of CT examinations in Korea between 2003 and 2009 (unit = 1,000).
Fig. 2. The flow of this study.
Outside hospital CT scans (n = 306)
Only one CT scan from each hospital (n = 273)
Exclusion (n = 33)
Group A (n = 36) Group B (n = 64) 2007 (n = 100)
Group A (n = 76) Group B (n = 97) 2012 (n = 173)
RESULTS
A comparison between 2007 and 2012
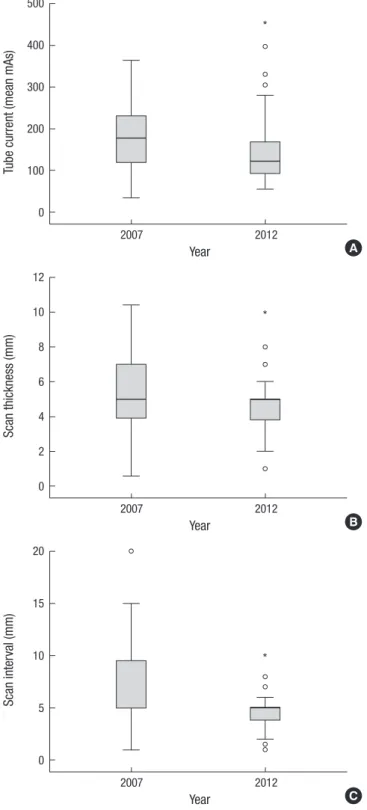
When comparing data between the year 2007 and the year 2012, the tube voltage did not show a significant change. The tube cur- rent decreased from 179.1 mAs to 137.2 mAs with decreased
standard deviation from 76.1 to 65.0. The scan thickness did not show a significant change, although the standard deviation de- creased from 2.7 to 1.9. In terms of the scan interval, it decreased from 6.4 mm to 4.8 mm with decreased standard deviation from 3.0 to 1.7. In addition, scans with a gap decreased from 18.0%
(n = 18) to 1.7% (n = 3). The number of non-single phase CT scans was still quite considerable in 2012 (Table 2) (Fig. 3).
The insufficient scan range decreased from 19.0% (n = 19) to 8.7% (n = 15). Especially the lower margin insufficiency signifi- cantly decreased, rather than the upper margin insufficiency.
The excessive scan range did not show a change. Poor image quality scans decreased from 33.0% (n = 33) to 5.2% (n = 9), and more CT scans included the dose report sheet in 2012 (35.8%, n = 62) than in 2008 (8%, n = 8) (Table 3).
A comparison between group A (primary hospitals) and group B (secondary and tertiary care hospitals)
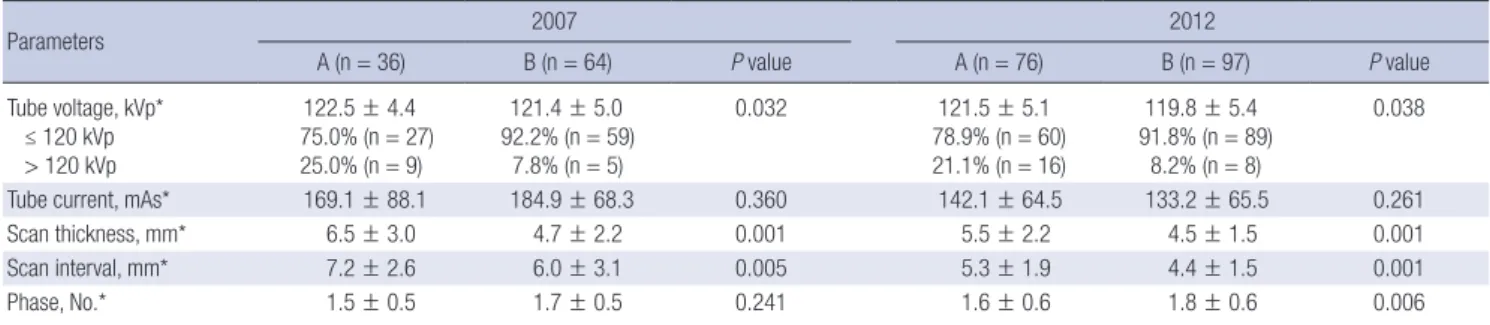
When comparing the data between groups A and B in both 2007 and 2012, group B had scans with lower tube voltages (≤ 120 kVp) (92.2% in 2007 and 91.8% in 2012) than group A (75.0% in 2007 and 78.9% in 2012). There was no significant difference in the tube current (mean mAs) in either 2007 or 2012. Group B had smaller scan thicknesses (4.7 mm in 2007 and 4.5 mm in 2012) than group A (6.5 mm in 2007 and 5.5 mm in 2012) in both 2007 and 2012. Group B also had smaller scan intervals (6.0 mm in 2007 and 4.4 mm in 2012) than group A (7.2 mm in 2007 and 5.3 mm in 2012) in both 2007 and 2012. Group B had more phase numbers (1.8) than group A (1.6) in 2012, with no significant difference in 2007 (Table 4) (Fig. 4).
In the scan range, group B had fewer insufficient scan ranges, although more excessive scan ranges than group A in both 2007 and 2012. Group B had fewer numbers of poor image quality
Table 2. A comparison between 2007 and 2012: tube voltage, tube current, scan thickness, scan interval, and phase number
Parameters 2007 (n = 100) 2012 (n = 173) P value Tube voltage, kVp*
≤ 120 kVp > 120 kVp
121.8 ± 4.8 86.0% (n = 86) 14.0% (n = 14)
120.5 ± 5.3 86.1% (n = 149)
13.9% (n = 24)
0.272
Tube current, mAs* 179.1 ± 76.1 137.2 ± 65.0 < 0.001 Scan thickness, mm* 5.3 ± 2.7 4.9 ± 1.9 0.226 Scan interval, mm* 6.4 ± 3.0 4.8 ± 1.7 < 0.001
Phase, No.* 1.6 ± 0.5 1.7 ± 0.6 0.387
*Mean ± standard deviation.
Fig. 3. A comparison between 2007 and 2012. (A) Tube current. (B) Scan thickness.
(C) Scan interval. °outliers;*extreme values.
Tube current (mean mAs)
Year
2007 2012
500
400
300
200
100
0
*
A
Scan thickness (mm)
Year
2007 2012
12 10
8
6
4
2
0
*
B
Scan interval (mm)
Year
2007 2012
20
15
10
5
0
*
C
Table 3. A comparison between 2007 and 2012: insufficient scan range, excessive scan range, poor image quality scan, and included dose report sheet
Parameters 2007 (n = 100) 2012 (n = 173) P value Insufficient scan range, % 19.0 (n = 19) 8.7 (n = 15) 0.013 Excessive scan range, % 42.0 (n = 42) 38.7 (n = 67) 0.595 Poor image quality, % 33.0 (n = 33) 5.2 (n = 9) < 0.001 Dose report sheet, % 8.0 (n = 8) 35.8 (n = 62) < 0.001
Table 4. A comparison of tube voltage, tube current, scan thickness, scan interval, and phase number between group A and B hospitals
Parameters 2007 2012
A (n = 36) B (n = 64) P value A (n = 76) B (n = 97) P value
Tube voltage, kVp*
≤ 120 kVp > 120 kVp
122.5 ± 4.4 75.0% (n = 27)
25.0% (n = 9)
121.4 ± 5.0 92.2% (n = 59)
7.8% (n = 5)
0.032 121.5 ± 5.1
78.9% (n = 60) 21.1% (n = 16)
119.8 ± 5.4 91.8% (n = 89)
8.2% (n = 8)
0.038
Tube current, mAs* 169.1 ± 88.1 184.9 ± 68.3 0.360 142.1 ± 64.5 133.2 ± 65.5 0.261
Scan thickness, mm* 6.5 ± 3.0 4.7 ± 2.2 0.001 5.5 ± 2.2 4.5 ± 1.5 0.001
Scan interval, mm* 7.2 ± 2.6 6.0 ± 3.1 0.005 5.3 ± 1.9 4.4 ± 1.5 0.001
Phase, No.* 1.5 ± 0.5 1.7 ± 0.5 0.241 1.6 ± 0.6 1.8 ± 0.6 0.006
A group, primary care hospitals; B group, secondary or tertiary care hospitals. *Mean ± standard deviation.
Fig. 4. A comparison between group A and B. (A) Tube current. (B) Scan thickness. (C) Scan interval. °outliers; *extreme values.
Tube current (mean mAs)
Year
2007 2012
500
400
300
200
100
0
*
A Group A B
C
Scan thickness (mm)
Year
2007 2012
12
10
8
6
4
2
0
** *
B Group A B
Scan interval (mm)
Year
2007 2012
20
15
10
5
0
*
*
*
*
***
Group A B
Table 5. Comparison of insufficient scan range, excessive scan range, poor image quality scan, and included dose report sheet between group A and B
Parameters 2007 2012
A (n = 36) B (n = 64) P value A (n = 76) B (n = 97) P value
Insufficient scan range, % 47.2 (n = 17) 3.1 (n = 2) < 0.001 14.5 (n = 11) 4.1 (n = 4) 0.016
Excessive scan range, % 13.9 (n = 5) 57.8 (n = 37) < 0.001 28.9 (n = 22) 46.4 (n = 45) 0.019
Poor image quality, % 44.4 (n = 16) 26.6 (n = 7) 0.068 9.2 (n = 7) 2.1 (n = 2) 0.044
Dose report sheet, % 5.6 (n = 2) 9.4 (n = 6) 0.707 19.7 (n = 15) 48.5 (n = 47) < 0.001
A group, primary care hospitals; B group, secondary or tertiary care hospitals.
scans and included more dose report sheets in 2012, although without a significant differences from those in 2007 (Table 5).
DISCUSSION
When the data between 2007 and 2012 were compared, the tube current decreased, although the tube voltage showed no change.
Even though the parameters of radiation dose were lacked in our study, perhaps the decrease in the tube current can reflect the tendency of the decreased radiation dose. Also, we found more unification of the tube current variability among the hos- pitals in 2012 from the decreased standard deviation. There were smaller scan intervals with decreased gaps, fewer insufficient scan ranges, and fewer poor image quality images in 2012, and thus reflecting the improved image quality. The scan thickness did not suggest a significant change, although the variability (standard deviation) among the hospitals had decreased by 2012.
In addition, more dose report sheets were included in CT scans in 2012. Even though there is no information regarding the dose report sheet in the guideline, we believe it is valuable for moni- toring and managing CT radiation dose. In summary, during the 5-year period, the tube current decreased and the image quality improved in thoracic CT scans obtained in Korea. The variability of the CT protocols among the examined hospitals also became more unified. We assume that these changes can be attributed to the implementation of the thoracic CT guide- line in 2008.
Secondary and tertiary care hospitals showed better image quality scans than primary care hospitals from smaller scan thicknesses, smaller scan intervals, and fewer insufficient scan ranges in both 2007 and 2012. These hospitals showed more phase numbers in 2012 and more excessive scan ranges in both 2007 and 2012, reflecting more radiation dose exposures. They included more dose report sheets in 2012. In summary, we not- ed better image quality scans in the secondary and tertiary care hospitals than in the primary care hospitals, although the pri- mary care hospitals also showed image quality improvement between 2007 and 2012. On the other hand, secondary and ter- tiary care hospitals showed more radiation dose exposures from CT scans.
Continuous education and dissemination of the guideline are still critical because of several reasons. At first, there is sig- nificant variability in CT protocols in each hospital. Second, some hospitals showed only a slight change between 2007 and 2012.
Third, suboptimal quality CT scans still exist. Lastly, secondary and tertiary care hospitals showed excessive phase numbers and scan ranges.
Many countries including US, UK, Germany, the Netherlands, Japan, Taiwan, Sudan, Kenya, Nigeria, and Korea reported their national surveys about CT radiation dose exposure. Among them, the US and UK started national surveys earlier than other
countries and both of them have been doing surveys with mak- ing and revising of the guideline continuously and periodically (1,6,11,21-27). In Korea, we started the national survey since 2007 and the thoracic CT guideline was established for the first time in 2008 (2,4,5). It is important to improve the Korean guide- line through continued national surveys and revisions in the fu- ture. Specifically, we think that revisions about relatively larger scan thickness criteria of 8 mm and no detailed excessive scan range criteria creating more radiation exposure in the 2008 tho- racic CT guideline are needed, from the result of this study.
Our study has some limitations. At first, we did not use ques- tionnaires and direct replies regarding CT protocols and the ra- diation doses from each hospital, which are usually used in the surveys. Instead, we analyzed referred CT scans from other hos- pitals. Therefore, the data did not officially represent each hos- pital. However, we believe that the data sufficiently represented the clinical thoracic CT protocols in Korea. Second, we could not obtain sufficient data regarding the radiation dose parame- ters, such as CTDI (CT dose index) and dose length product (DLP), which are widely used to evaluate the radiation dose.
That was because the CT scans in our study did not include a sufficient number of dose report sheets, which had the CTDI and DLP data. However, we saw that CT scans in 2012 included far more numbers of the dose report sheets than those in 2008.
Therefore, we expect that future studies will include the values of CTDI and DLP.
In conclusion, during the 5-year period from 2007 to 2012, the reduction in the tube current values, improvement of over- all image quality, and more unification among hospitals were seen. Based on this study, we conclude that the implementa- tion of the guideline serves as a platform to bring about those changes. We expect that the present result may be used for fu- ture revisions of the guideline.
DISCLOSURE
The authors have no potential conflicts of interest to disclose.
AUTHOR CONTRIBUTION
Study concept and design of article: Do KH. Data collection and analysis: Do KH, Kang JW, Yang DH. Writing draft: Kang JW, Han K. Revision: Do KH, Kang JW. Approval of final manuscript and agreement of submission: all authors.
ORCID
Ji-Won Kang http://orcid.org/0000-0003-1357-0339 Kyung-Hyun Do http://orcid.org/0000-0003-1922-4680 Kichang Han http://orcid.org/0000-0002-9701-9757 Eun-Jin Chae http://orcid.org/0000-0002-5299-0048
Dong-Hyun Yang http://orcid.org/0000-0001-5477-558X Choong-Wook Lee http://orcid.org/0000-0001-8776-2603
REFERENCES
1. Mettler FA Jr, Bhargavan M, Faulkner K, Gilley DB, Gray JE, Ibbott GS, Li- poti JA, Mahesh M, McCrohan JL, Stabin MG, et al. Radiologic and nucle- ar medicine studies in the United States and worldwide: frequency, radi- ation dose, and comparison with other radiation sources--1950-2007. Ra- diology 2009; 253: 520-31.
2. American College of Radiology. ACR practice guideline for the perfor- mance of pediatric and adult thoracic computed tomography(CT). Avail- able at http://www.acr.org [accessed on 15 October 2015].
3. Brenner DJ, Doll R, Goodhead DT, Hall EJ, Land CE, Little JB, Lubin JH, Preston DL, Preston RJ, Puskin JS, et al. Cancer risks attributable to low doses of ionizing radiation: assessing what we really know. Proc Natl Acad Sci U S A 2003; 100: 13761-6.
4. Multislice Computed Tomography. 2004 CT quality criteria. Available at http://msct.eu/CT_Quality_Criteria.htm [accessed on 15 October 2015].
5. Ministry for Health, Welfare and Family Affairs; National Institute of Food and Drug Safety Evaluation; The Korean Radiological Society; The Kore- an Radiological Technologists Association. Guideline for diagnostic ref- erence level of the radiation exposure of CT examination. Available at http://www.mfds.go.kr/medicaldevice/index.do?nMenuCode=121&pag e=1&categoryCode1=86&page=1&mode=view&boardSeq=49621 [ac- cessed on 15 October 2015].
6. Health Insurance Review and Assessment Service. Assessments of the 2006 state of CT claims reported by the Korea Health Insurance Review and Assessment Service. Available at http://biz.hira.or.kr/ICSFiles/afield- file/2008/01/21/2006_CT.pdf [accessed on 15 October 2015].
7. Brenner DJ, Hall EJ. Computed tomography--an increasing source of ra- diation exposure. N Engl J Med 2007; 357: 2277-84.
8. Hricak H, Brenner DJ, Adelstein SJ, Frush DP, Hall EJ, Howell RW, McCol- lough CH, Mettler FA Jr, Pearce MS, Suleiman OH, et al. Managing radia- tion use in medical imaging: a multifaceted challenge. Radiology 2011;
258: 889-905.
9. National Council on Radiation Protection and Measurements. Ionizing radiation exposure of the population of the United States: NCRP Report No.160. Bethesda, MD: National Council on Radiation Protection and Measurements, 2009.
10. Hall EJ, Brenner DJ. Cancer risks from diagnostic radiology. Br J Radiol 2008; 81: 362-78.
11. Tsushima Y, Taketomi-Takahashi A, Takei H, Otake H, Endo K. Radiation exposure from CT examinations in Japan. BMC Med Imaging 2010; 10:
24.
12. Kim BH, Do KH, Goo HW, Yang DH, Oh SY, Kim HJ, Lee KY, Lee JE. Na- tional survey of radiation doses of pediatric chest radiography in Korea:
analysis of the factors affecting radiation doses. Korean J Radiol 2012; 13:
610-7.
13. Tanimura M, Matsui I, Abe J, Ikeda H, Kobayashi N, Ohira M, Yokoyama M, Kaneko M. Increased risk of hepatoblastoma among immature chil- dren with a lower birth weight. Cancer Res 1998; 58: 3032-5.
14. Shu XO, Potter JD, Linet MS, Severson RK, Han D, Kersey JH, Neglia JP, Trigg ME, Robison LL. Diagnostic X-rays and ultrasound exposure and risk of childhood acute lymphoblastic leukemia by immunophenotype.
Cancer Epidemiol Biomarkers Prev 2002; 11: 177-85.
15. Shu XO, Jin F, Linet MS, Zheng W, Clemens J, Mills J, Gao YT. Diagnostic X-ray and ultrasound exposure and risk of childhood cancer. Br J Cancer 1994; 70: 531-6.
16. Health and Safety at Work etc. Act 1974. Available at http://www.legisla- tion.gov.uk/ukpga/1974/37/pdfs/ukpga_19740037_en.pdf [accessed on 15 October 2015].
17. Goo HW. CT radiation dose optimization and estimation: an update for radiologists. Korean J Radiol 2012; 13: 1-11.
18. Kalra MK, Maher MM, Toth TL, Hamberg LM, Blake MA, Shepard JA, Saini S. Strategies for CT radiation dose optimization. Radiology 2004; 230: 619- 28.
19. Singh S, Kalra MK, Moore MA, Shailam R, Liu B, Toth TL, Grant E, Westra SJ. Dose reduction and compliance with pediatric CT protocols adapted to patient size, clinical indication, and number of prior studies. Radiology 2009; 252: 200-8.
20. Korean Society of Thoracic Radiology Guidelines Standards Committee.
KSTR chest CT practice guidelines and technical standards. Available at http://kstr.radiology.or.kr/data/policy.html [accessed on 15 October 2015].
21. Shrimpton PC, Hillier MC, Meeson S, Golding SJ. Doses from computed tomography(CT) examinations in the UK: 2011 review. London: Public Health England, 2014.
22. Brix G, Nagel HD, Stamm G, Veit R, Lechel U, Griebel J, Galanski M. Radi- ation exposure in multi-slice versus single-slice spiral CT: results of a na- tionwide survey. Eur Radiol 2003; 13: 1979-91.
23. van der Molen AJ, Schilham A, Stoop P, Prokop M, Geleijns J. A national survey on radiation dose in CT in the Netherlands. Insights Imaging 2013;
4: 383-90.
24. Tsai HY, Tung CJ, Yu CC, Tyan YS. Survey of computed tomography scan- ners in Taiwan: dose descriptors, dose guidance levels, and effective dos- es. Med Phys 2007; 34: 1234-43.
25. Suliman II, Abdalla SE, Ahmed NA, Galal MA, Salih I. Survey of comput- ed tomography technique and radiation dose in Sudanese hospitals. Eur J Radiol 2011; 80: e544-51.
26. Wambani JS, Korir GK, Onditi EG, Korir IK. A survey of computed tomog- raphy imaging techniques and patient dose in Kenya. East Afr Med J 2010;
87: 400-7.
27. Ogbole GI, Obed R. Radiation doses in computed tomography: need for optimization and application of dose reference levels in Nigeria. West Afr J Radiol 2014; 21: 1-6.