Deep Learning in Thyroid Ultrasonography to Predict Tumor Recurrence
in Thyroid Cancers
인공지능 딥러닝을 이용한 갑상선 초음파에서의 갑상선암의 재발 예측
Jieun Kil, MD1 , Kwang Gi Kim, PhD2† , Young Jae Kim, PhD2 , Hye Ryoung Koo, MD1 , Jeong Seon Park, MD1*†
1Department of Radiology, Hanyang University College of Medicine, Seoul, Korea
2Department of Biomedical Engineering, College of Medicine, Gachon University, Incheon, Korea
Purpose To evaluate a deep learning model to predict recurrence of thyroid tumor using pre- operative ultrasonography (US).
Materials and Methods We included representative images from 229 US-based patients (male:female = 42:187; mean age, 49.6 years) who had been diagnosed with thyroid cancer on preoperative US and subsequently underwent thyroid surgery. After selecting each representa- tive transverse or longitudinal US image, we created a data set from the resulting database of 898 images after augmentation. The Python 2.7.6 and Keras 2.1.5 framework for neural networks were used for deep learning with a convolutional neural network. We compared the clinical and histological features between patients with and without recurrence. The predictive perfor- mance of the deep learning model between groups was evaluated using receiver operating characteristic (ROC) analysis, and the area under the ROC curve served as a summary of the prognostic performance of the deep learning model to predict recurrent thyroid cancer.
Results Tumor recurrence was noted in 49 (21.4%) among the 229 patients. Tumor size and multifocality varied significantly between the groups with and without recurrence (p < 0.05).
The overall mean area under the curve (AUC) value of the deep learning model for prediction of recurrent thyroid cancer was 0.9 ± 0.06. The mean AUC value was 0.87 ± 0.03 in macrocarci- noma and 0.79 ± 0.16 in microcarcinoma.
Conclusion A deep learning model for analysis of US images of thyroid cancer showed the pos- sibility of predicting recurrence of thyroid cancer.
Index terms Deep Learning; Thyroid Cancer, Papillary; Ultrasonography; Recurrence
Received August 6, 2019 Revised September 24, 2019 Accepted October 8, 2019
*Corresponding author Jeong Seon Park, MD Department of Radiology, Hanyang University College of Medicine,
222 Wangsimni-ro, Seongdong-gu, Seoul 04763, Korea.
Tel 82-2-2290-9164 Fax 82-2-2293-2111 E-mail [email protected] This is an Open Access article distributed under the terms of the Creative Commons Attribu- tion Non-Commercial License (https://creativecommons.org/
licenses/by-nc/4.0) which permits unrestricted non-commercial use, distribution, and reproduc- tion in any medium, provided the original work is properly cited.
ORCID iDs Jieun Kil https://
orcid.org/0000-0003-4170-5720 Kwang Gi Kim
https://
orcid.org/0000-0001-9714-6038 Young Jae Kim
https://
orcid.org/0000-0003-0443-0051 Hye Ryoung Koo
https://
orcid.org/0000-0002-7562-2256 Jeong Seon Park
https://
orcid.org/0000-0002-5550-6645
†These authors contributed equally to this work.
INTRODUCTION
Thyroid cancer is the most common endocrine malignancy worldwide (1-3). Papillary thy- roid carcinoma (PTC) is the most common (70–95%) histologic type and accounts for most new cases (4-6).
Advances in technology have yielded high-frequency ultrasonic transducers and improved spatial resolution, and ultrasonography (US) is the preferred imaging method for thyroid dis- ease screening. The incidence of papillary thyroid microcarcinoma (PTMC) is rapidly increas- ing due largely to improved ultrasonographic detection of small nodules not detected by clini- cal palpation (7-9). Thyroid microcarcinomas, which are almost exclusively PTC, are defined as thyroid cancers measuring ≤ 1 cm in maximum dimension (10). PTMC was introduced as a subtype of papillary thyroid cancer by the World Health Organization in 2004 and accounts for 30% to 40% of all papillary thyroid cancers (11).
Although the prognosis of differentiated thyroid cancer (DTC) is excellent, cervical lymph node metastasis is found pathologically in 30–80% of patients with PTC (3, 12-15), and the over- all tumor recurrence rate varies from 7.7% to 36% (3, 15). Poor prognostic factors in thyroid carcinoma include large tumors, tumors that extend beyond the thyroid capsule, male sex, and lymph-node metastases (16-18). Several studies have revealed that the location, tumor size, de- gree of thyroid capsule abutment, multiplicity, or microcalcifications may be predictive of lat- eral lymph node metastasis in patients with PTC (19-21).
Recently, a deep learning model has been used as a tool for medical image analysis with promising results in various applications such as computerized prognosis for Alzheimer’s dis- ease, organ segmentation, and detection of diseases (22-24). A few studies have investigated the utility of gray-scale US characteristics and a deep learning model in predicting prognosis of PTC (25-28). However, there are no published data regarding prognostic US features using a deep learning model in patients with thyroid cancer. Therefore, we evaluated a deep learning model to predict recurrence of thyroid cancer on preoperative US images.
MATERIALS AND METHODS PATIENTS
This study was approved by our Institutional Review Board, and informed consent was waived (IRB No. 2010-03-031-001). Two radiologists consecutively reviewed the preoperative US images of patients diagnosed with thyroid cancer and underwent surgery between 2006 and 2011. We included 229 patients, 42 males and 187 females (median age, 49.6 years; range, 19–83 years). These patients underwent either total thyroidectomy (n = 173) or hemithyroidec- tomy (n = 56). The mean follow-up period was 7.1 years and ranged from 3.2–13.7 years. The clinical and histological features of age, sex, recurrence site, tumor size, histologic type, mul- tifocality and lymph node metastasis were evaluated in each group. According to our institu- tional protocol, postoperative surveillance for the thyroid cancer patients consisted of annual neck US, clinical physical examination, the measurement of serum thyroid-stimulating hor- mone, free thyroxine, thyroglobulin (Tg), and chest X-ray. Additionally, computed tomography examinations were performed in the patients with suspicious lateral neck lymph node or lung
metastasis.
ULTRASONOGRAPHIC IMAGES
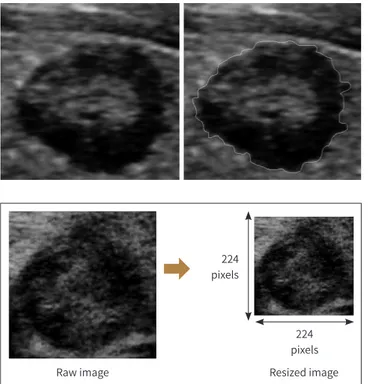
Preoperative US was performed prospectively by one of two radiologists (four and nine years of experience, respectively) dedicated to thyroid imaging interpretation. US examinations were performed using a 5–12 MHz transducer (Philips Medical Systems, Bothell, WA, USA). Each representative transverse or longitudinal US image was selected by consensus of the two ra- diologists. We used the Image J program (National Institute of Mental Health, Bethesda, MD, USA) to draw a region of interest manually on the US images to outline the thyroid cancer (Fig. 1). All raw images were cropped into squares with long axis along the side of the image, which reduce the image distortion caused by resizing process. Finally, cropped images were resized to a 224 × 224 pixel (Fig. 2).
DEEP LEARNING ANALYSIS
Image augmentation protocol was performed as an analysis method in deep learning to overcome the lack of statistical power due to a small number of samples. Using image augmen- tation, initial images were expanded by image transformation such as rotation, translation, scale up, and horizontal flip. An augmented data set with 898 images was used for image analysis.
We used 717 of 898 images for training and 181 images for test data and all data divided per pa- tient basis. Each training/validation split constituted an approximate 80:20 split of the 898 im- ages, retaining the underlying distribution of disease prevalence. In same patient, the mean aug- mented US images were 3.96 images per person in the train set, 3.77 images in the test set, and 3.92 images in the whole data set. All augmented US images of same patients are separately used between train and test set. The learning algorithm generated from the train set of this study was evaluated in a test set consisting of completely independent patient data set.
Fig. 1. The process of manually draw- ing a region of interest on a represen- tative ultrasonograpy image of thy- roid cancer using the Image J program.
The bright line in the image on the right represents the tumor margin.
224 pixels
224 pixels
Raw image Resized image
Fig. 2. A schematic diagram of the process of cropping and resizing an ultrasonograpy image of a patient with thyroid cancer.
The breakdown of training and validation data sets according to tumor size is listed in the Table 1. The images were resized to a 224 × 224 pixel with a Bi-Cubic interpolation algorithm.
We built the system with an NVIDIA TITAN Xp (NVIDIA, Santa Clara, CA, USA) graphics pro- cessing unit, a Xeon E5-1650 v4 (Intel, Santa Clara, CA, USA) central processing unit, and 128 GB of random access memory. The Python 2.7.6 and Keras 2.1.5 (with the TensorFlow backend) frameworks for neural networks were used for deep learning with a convolutional neural net- work. The proposed model for thyroid classification was transferred from the pre-trained on 1.2 million everyday color images from ImageNet (http://www.image-net.org/) that consisted of 1000 categories.
A total of 434 training data was then fine-tuned under the conditions of 16 batch size, 150 epoch, and 0.0001 learning rate using the ResNet-50 model (29). The ResNet-50 model has im- proved performance in terms of training and generalization errors by utilizing shortcut con- nections to significantly reduce the difficulty of deep training (30).
STATISTICAL ANALYSIS
We used the moonBook package within the R statistical language for comparison of demo- graphic characteristics between the no recurrence and recurrence groups (31, 32). We also com- pared demographic information between train and test set. All statistical analysis were per- formed based on per-patient data. Values for predicting recurrent thyroid cancer were calculated as the area under the curve (AUC), and the US images were used as input data for the deep learn- ing approach. The predictive performance of the deep learning model between the no recur- rence and recurrence groups was evaluated using receiver operating characteristic (ROC) anal- ysis, and the area under the ROC curve served as a summary of the prognostic performance of the model in recurrent thyroid cancer. We also performed ROC analysis in subgroups of thy- roid carcinoma larger than 1 cm in greatest diameter (macrocarcinoma) and 1 cm or less (mi- crocarcinoma). In this experiment, 181 US images of pathologically diagnosed thyroid cancer were sampled with k-fold cross-validation (k = 3) for performance of a deep learning program predicting thyroid cancer recurrence with ROC curves. We also compared the AUC values of the validation steps between macrocarcinoma and microcarcinoma. All reported p-values were two-sided, and p < 0.05 was considered statistically significant. We used t-distributed sto- chastic neighbor-embedding (tSNE) method to visualize the predictive performance of the deep learning model.
RESULTS
We first compared the clinical characteristics between train and test set. There was no sig- Table 1. Breakdown of Training and Validation Data Sets According to Tumor Size
Thyroid Cancer
No. of Samples
Training Set Validation Set
No Recurrence Recurrence No Recurrence Recurrence
Microcarcinoma 259 24 65 6
Macrocarcinoma 380 54 96 14
nificant difference in sex, age, cancer size, histologic type, and lymph node metastasis between train set and test set (Table 2). It was only statistically significant at p < 0.022 in multifocality.
The demographic characteristics of the no recurrence and recurrence groups are listed in
Table 2. Comparison of Demographic Characteristics of the Train Set and Test Set
Clinical Variable Subgroup Train Set (n = 181, %) Test Set (n = 48, %) p-Value
Age 50.1 ± 11.7 49.2 ± 13.1 0.612
Sex Male 151 (83.7) 39 (82.0) 0.880
Female 30 (16.3) 9 (18.0)
Tumor size (cm) Median diameter [IQR] 0.6 [0.4–1.2] 0.6 [0.5–1.2] 0.647
Macrocarcinoma 113 (62.5) 30 (61.7) 0.376
Microcarcinoma 68 (37.5) 18 (38.3)
Histologic type PTC 176 (97.1) 47 (98.4) 0.149
FC 3 (1.9) 0 (0.0)
MC 0 (0.0) 1 (1.6)
Other 2 (1.0) 0 (0.0)
Multifocality No 120 (66.3) 39 (80.5) 0.022
Yes 61 (33.7) 9 (19.5)
Lymph node metastasis Yes 172 (95.2) 45 (92.2) 0.127
No 9 (4.8) 4 (7.8)
The results for categorical variables are presented as percentages in parentheses for the three genotypic groups. The Shapiro-Wilk test is used to assess the normality of the continuous variables. The continuous variables are non-normally distributed and are described as median and IQR in brackets. Differences between the groups are assessed using Fisher’s exact test for categorical variables and the Kruskal-Wallis rank sum test for interval scale measurements. A p-value < 0.05 is considered statistically significant.
FC = follicular carcinoma, IQR = interquartile range, MC = medullary carcinoma, PTC = papillary thyroid carcinoma
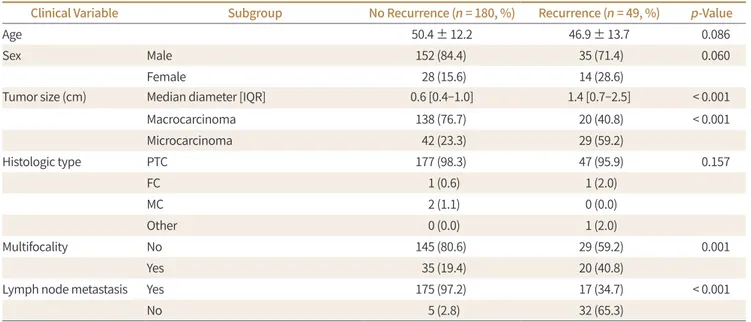
Table 3. Comparison of Demographic Characteristics of the No Recurrence and Recurrence Groups
Clinical Variable Subgroup No Recurrence (n = 180, %) Recurrence (n = 49, %) p-Value
Age 50.4 ± 12.2 46.9 ± 13.7 0.086
Sex Male 152 (84.4) 35 (71.4) 0.060
Female 28 (15.6) 14 (28.6)
Tumor size (cm) Median diameter [IQR] 0.6 [0.4–1.0] 1.4 [0.7–2.5] < 0.001
Macrocarcinoma 138 (76.7) 20 (40.8) < 0.001
Microcarcinoma 42 (23.3) 29 (59.2)
Histologic type PTC 177 (98.3) 47 (95.9) 0.157
FC 1 (0.6) 1 (2.0)
MC 2 (1.1) 0 (0.0)
Other 0 (0.0) 1 (2.0)
Multifocality No 145 (80.6) 29 (59.2) 0.001
Yes 35 (19.4) 20 (40.8)
Lymph node metastasis Yes 175 (97.2) 17 (34.7) < 0.001
No 5 (2.8) 32 (65.3)
The results for categorical variables are presented as percentages in parentheses for the three genotypic groups. The Shapiro-Wilk test is used to assess the normality of the continuous variables. The continuous variables are non-normally distributed and are described as median and IQR in brackets. Differences between the groups are assessed using Fisher’s exact test for categorical variables and the Kruskal-Wallis rank sum test for interval scale measurements. A p-value < 0.05 is considered statistically significant.
FC = follicular carcinoma, IQR = interquartile range, MC = medullary carcinoma, PTC = papillary thyroid carcinoma
the Table 3. Among a total of 229 patients, 180 patients (78.6%) had no recurrent tumors (no re- currence group), while 49 patients had tumor recurrence (21.4%) (recurrence group). The re- currence rate was higher for macrocarcinoma (40.8%) than microcarcinoma (12.7%). Recur- rence sites comprised regional lymph nodes (n = 34, 69.4%), lung (n = 4, 8.2%), bone (n = 2, 4.1%), and others (n = 9, 18.4%). In the patients with tumor recurrence, the median time of recurrence was 42.9 months ± 30.4 (median 35.7 months; range 5.3–110.9 months) after initial surgery. At the time of recurrence, the mean of serum Tg level was 140.5 ± 734 ng/mL. Among 34 patients with regional lymph node recurrence, 8 patients were presenting as a palpable neck mass in physical examination and 48 patients were detected in US.
Tumor size and multifocality were significantly different between the no recurrence and recurrence groups (p < 0.05).
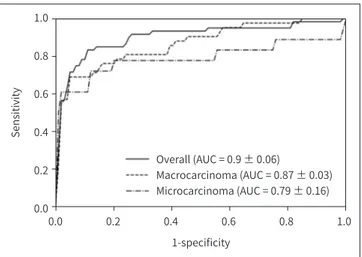
Fig. 3 displays ROC curves for predicting tumor recurrence using a deep learning model in thyroid cancers using three-fold cross-validation. The overall mean AUC value of the deep learn- ing model for predicting recurrent thyroid cancer was 0.9 ± 0.06. The mean AUC value was 0.87 ± 0.03 in macrocarcinoma and 0.79 ± 0.16 in microcarcinoma (Table 4). There were no statistically significant differences between k-fold cross validation of AUC values (p > 0.05).
The Sensitivity, specificity and accuracy of the deep learning program predicting thyroid cancer recurrence are listed in the Table 5.
The intraclass features were divided into two groups on a 2-dimensional (2D) diagram of tu- mor recurrence using the tSNE technique, which revealed patterns distinguishing them in each group (Fig. 4).
DISCUSSION
DTC has an excellent prognosis; however, there is considerable local recurrence and dis- tant metastasis in long-term follow-up. As microcarcinomas are comprising an increasing pro- portion of thyroid cancers, a series of observational trials has shown that most PTMC can be observed with active surveillance (33-35). In the era of active surveillance with DTC or PTMC, studies exploring methods for preoperative prediction of thyroid cancer prognosis have been emerging.
1.0 0.8 0.6 0.4 0.2 0.0
Sensitivity
0.0 0.2 0.4 0.6 0.8 1.0
1-specificity
Overall (AUC = 0.9 ± 0.06)
Macrocarcinoma (AUC = 0.87 ± 0.03) Microcarcinoma (AUC = 0.79 ± 0.16) Fig. 3. Receiver operating character-
istic curves for prediction of thyroid cancer recurrence.
AUC = area under the curve
According to previous studies, tumor size, multiplicity, and extrathyroidal tumor extension or lymph node metastases are poor prognostic factors and patients with these risk factors for recurrence have a nearly seven-fold higher mortality rate (3, 15-18, 36). Our results also showed that thyroid cancers that were larger and multifocal had a significantly higher rate of recurrence (p < 0.05).
Several studies have evaluated poor prognostic factors for thyroid cancer using thyroid US
Table 5. The Sensitivity, Specificity, and Accuracy of the Deep Learning Program Predicting Thyroid Cancer Recurrence
Sensitivity (%) Specificity (%) Accuracy (%)
Macrocarcinoma 59.5 97.2 92.4
Microcarcinoma 27.8 100 93.9
Overall 50.0 97.9 90.0
Fig. 4. 2D visualization of the pres- ence of tumor recurrence generated using the tSNE technique in thyroid cancer between recurrence (open tri- angles) and no recurrence (close cir- cles) groups.
tSNE = t-distributed stochastic neigh- bor-embedding
20 15 10 5 0 -5 -10 -15 -20
y-tSNE
-15 -10 -5 0 5 10 15 20
x-tSNE Non-recurrence Recurrence
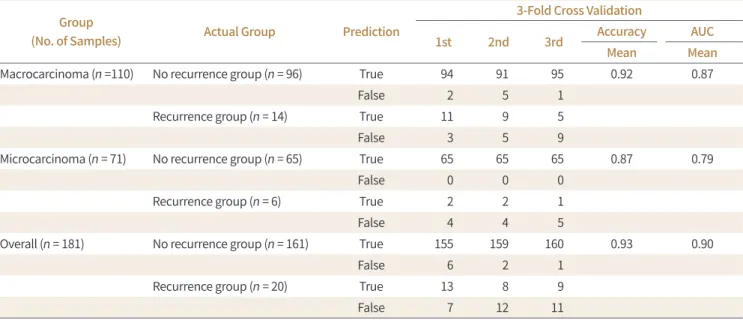
Table 4. Three-Fold Cross-Validation of Performance of the Deep Learning Program Predicting Thyroid Cancer Recurrence with AUC
Group
(No. of Samples) Actual Group Prediction
3-Fold Cross Validation
1st 2nd 3rd Accuracy AUC
Mean Mean
Macrocarcinoma (n =110) No recurrence group (n = 96) True 94 91 95 0.92 0.87
False 2 5 1
Recurrence group (n = 14) True 11 9 5
False 3 5 9
Microcarcinoma (n = 71) No recurrence group (n = 65) True 65 65 65 0.87 0.79
False 0 0 0
Recurrence group (n = 6) True 2 2 1
False 4 4 5
Overall (n = 181) No recurrence group (n = 161) True 155 159 160 0.93 0.90
False 6 2 1
Recurrence group (n = 20) True 13 8 9
False 7 12 11
AUC = area under the curve
image analysis, and several US features have been reported as poor prognostic factors, includ- ing upper location, presence of calcifications, or features suggestive of malignant thyroid nod- ules (20, 37). Recently, various computer-aided analyses of thyroid US images have been used in the detection and differential diagnosis of malignant thyroid nodules, and they showed ex- cellent diagnostic performance with accuracy over 70% or high AUC values over 0.9 (25, 38, 39).
Kim et al. (40) investigated texture analysis of thyroid US in patients with PTMC; however, there was no correlation between prognosis and lymph node metastasis. In our deep learning mod- el for predicting tumor recurrence, the overall AUC value was 0.90 and was slightly higher in macrocarcinoma (0.87 ± 0.03) than microcarcinoma (0.79 ± 0.16). In our data, recurrence of microcarcinoma was less frequent than that of macrocarcinoma (p < 0.001), and the difference in incidence and prevalence of recurrence according to tumor size may have affected model performance.
In our data, we made a deep learning model to predict thyroid cancer recurrence, and the sensitivity was low (50%) and the specificity was high (97.9%). With these results, this model can provide a parameter to subdivide low-risk group in thyroid cancer patients at the time of preoperative US. In the era of active surveillance for the thyroid cancer patients, further in- vestigations including multivariate analysis with deep learning algorithm and many clinical parameters could suggest a better predictive model.
This study has several limitations. First, it was retrospective and performed using data from a single institution; thus, it may be subject to bias. Second, the included US data were obtained using one machine and may not be representative of results from other machines. Third, one representative transverse or longitudinal US image was selected among many slices. Using 3D volumetric data including the whole tumor would be optimal considering the heterogene- ity of cancer. The last limitation is the possibility of overfitting in this deep learning algorithm using relatively small volume of data. To prevent the overfitting in deep learning, we designed to collect US images with a variety of size of thyroid cancer. We also analyzed the cropped im- ages without the area of normal thyroid tissue to reduce the number of potential data features that lead to ruin the model. A larger sample size of patients with recurrent thyroid cancer or multicenter trial may overcome such as overfitting of results.
In conclusion, a deep learning model for analysis of US images showed the possibility of a feasible algorithm to predict thyroid cancer recurrence.
Author Contributions
Conceptualization, P.J.S., K.K.G.; data curation, P.J.S., K.J., K.H.R.; formal analysis, K.J., K.H.R.; in- vestigation, all authors; methodology, P.J.S., K.K.G.; project administration, P.J.S., K.K.G.; resources, P.J.S., K.J., K.H.R.; software, P.J.S., K.J., K.H.R.; supervision, P.J.S., K.K.G.; validation, P.J.S., K.Y.J., K.K.G.; visualization, P.J.S., K.Y.J., K.K.G.; writing—original draft, P.J.S., K.Y.J., K.J.; and writing—review
& editing, P.J.S., K.K.G.
Conflicts of Interest
The authors have no potential conflicts of interest to disclose.
Acknowledgments
This work was supported by the research fund of Hanyang University (HY-2016). This research sup- ported by the Gachon Univ. funding (2017-0211). Jeong Seon Park and Kwang Gi Kim are equally con- tributed.
REFERENCES
1. Ito Y, Kihara M, Takamura Y, Kobayashi K, Miya A, Hirokawa M, et al. Prognosis and prognostic factors of papillary thyroid carcinoma in patients under 20 years. Endocr J 2012;59:539-545
2. Siegel R, Ma J, Zou Z, Jemal A. Cancer statistics, 2014. CA Cancer J Clin 2014;64:9-29
3. Lim H, Devesa SS, Sosa JA, Check D, Kitahara CM. Trends in thyroid cancer incidence and mortality in the United States, 1974-2013. JAMA 2017;317:1338-1348
4. Stewart B, Wild CP. World Cancer Report 2014. Available at. http://publichealthwell.ie/node/725845. Pub- lished 2014. Accessed Nov 19, 2019
5. Baek SK, Jung KY, Kang SM, Kwon SY, Woo JS, Cho SH, et al. Clinical risk factors associated with cervical lymph node recurrence in papillary thyroid carcinoma. Thyroid 2010;20:147-152
6. Conzo G, Docimo G, Ruggiero R, Napolitano S, Palazzo A, Gambardella C, et al. Surgical treatment of papil- lary thyroid carcinoma without lymph nodal involvement. G Chir 2012;33:339-342
7. Cramer JD, Fu P, Harth KC, Margevicius S, Wilhelm SM. Analysis of the rising incidence of thyroid cancer us- ing the surveillance, epidemiology and end results national cancer data registry. Surgery 2010;148:1147- 1152
8. Hughes DT, Haymart MR, Miller BS, Gauger PG, Doherty GM. The most commonly occurring papillary thy- roid cancer in the United States is now a microcarcinoma in a patient older than 45 years. Thyroid 2011;
21:231-236
9. Jung KW, Park S, Kong HJ, Won YJ, Lee JY, Park EC, et al. Cancer statistics in Korea: incidence, mortality, survival, and prevalence in 2008. Cancer Res Treat 2011;43:1-11
10. Hedinger C, Williams ED, Sobin LH. Histologic typing of thyroid tumors. International histologic classifica- tion of tumors. Berlin: Springer 1988:7-68
11. Mazeh H, Chen H. Advances in surgical therapy for thyroid cancer. Nat Rev Endocrinol 2011;7:581-588 12. Mann B, Buhr HJ. Lymph node dissection in patients with differentiated thyroid carcinoma--who benefits?
Langenbecks Arch Surg 1998;383:355-358
13. Roh JL, Park JY, Park CI. Total thyroidectomy plus neck dissection in differentiated papillary thyroid carci- noma patients: pattern of nodal metastasis, morbidity, recurrence, and postoperative levels of serum parathyroid hormone. Ann Surg 2007;245:604-610
14. Wada N, Duh QY, Sugino K, Iwasaki H, Kameyama K, Mimura T, et al. Lymph node metastasis from 259 pap- illary thyroid microcarcinomas: frequency, pattern of occurrence and recurrence, and optimal strategy for neck dissection. Ann Surg 2003;237:399-407
15. Cho BY, Choi HS, Park YJ, Lim JA, Ahn HY, Lee EK, et al. Changes in the clinicopathological characteristics and outcomes of thyroid cancer in Korea over the past four decades. Thyroid 2013;23:797-804
16. Mazzaferri EL, Jhiang SM. Long-term impact of initial surgical and medical therapy on papillary and follicu- lar thyroid cancer. Am J Med 1994;97:418-428
17. Su DH, Chang SH, Chang TC. The impact of locoregional recurrences and distant metastases on the surviv- al of patients with papillary thyroid carcinoma. Clin Endocrinol (Oxf) 2015;82:286-294
18. Schlumberger MJ. Papillary and follicular thyroid carcinoma. N Engl J Med 1998;338:297-306
19. Liu W, Cheng R, Ma Y, Wang D, Su Y, Diao C, et al. Establishment and validation of the scoring system for preoperative prediction of central lymph node metastasis in papillary thyroid carcinoma. Sci Rep 2018;8:6962 20. Kwak JY, Kim EK, Kim MJ, Son EJ, Chung WY, Park CS, et al. Papillary microcarcinoma of the thyroid: pre-
dicting factors of lateral neck node metastasis. Ann Surg Oncol 2009;16:1348-1355
21. Lee SH, Lee SS, Jin SM, Kim JH, Rho YS. Predictive factors for central compartment lymph node metastasis in thyroid papillary microcarcinoma. Laryngoscope 2008;118:659-662
22. Suk HI, Lee SW, Shen D; Alzheimer’s Disease Neuroimaging Initiative. Latent feature representation with stacked auto-encoder for AD/MCI diagnosis. Brain Struct Funct 2015;220:841-859
23. Zhang W, Li R, Deng H, Wang L, Lin W, Ji S, et al. Deep convolutional neural networks for multi-modality isointense infant brain image segmentation. Neuroimage 2015;108:214-224
24. Shin HC, Orton MR, Collins DJ, Doran SJ, Leach MO. Stacked autoencoders for unsupervised feature learn- ing and multiple organ detection in a pilot study using 4D patient data. IEEE Trans Pattern Anal Mach Intell 2013;35:1930-1943
25. Choi WJ, Park JS, Kim KG, Kim SY, Koo HR, Lee YJ. Computerized analysis of calcification of thyroid nodules
as visualized by ultrasonography. Eur J Radiol 2015;1;84:1949-1953
26. Li H, Weng J, Shi Y, Gu W, Mao Y, Wang Y, et al. An improved deep learning approach for detection of thyroid papillary cancer in ultrasound images. Sci Rep 2018;8:6600
27. Ma J, Wu F, Zhu J, Xu D, Kong D. A pre-trained convolutional neural network based method for thyroid nodule diagnosis. Ultrasonics 2017;73:221-230
28. Wu H, Deng Z, Zhang B, Liu Q, Chen J. Classifier model based on machine learning algorithms: application to differential diagnosis of suspicious thyroid nodules via sonography. AJR Am J Roentgenol 2016;207:859- 864
29. He K, Zhang X, Ren S, Sun J. Deep residual learning for image recognition. Proc IEEE Comput Soc Conf Comput Vis Pattern Recognit 2016;12;770-778
30. Pan SJ, Yang Q. A survey on transfer learning. IEEE Trans Knowl Data Eng 2010;22:1345-1359 31. Moon KW. R statistics and graphs for medical papers. Seoul: Hannarae Publishing Co 2015
32. Team RC. A language and environment for statistical computing. Vienna: R Foundation for Statistical Com- puting 2016
33. Haugen BR, Alexander EK, Bible KC, Doherty GM, Mandel SJ, Nikiforov YE, et al. 2015 American Thyroid As- sociation Management Guidelines for adult patients with thyroid nodules and differentiated thyroid can- cer: the American Thyroid Association Guidelines Task Force on thyroid nodules and differentiated thyroid cancer. Thyroid 2016;26:1-133
34. Ito Y, Miyauchi A, Kihara M, Higashiyama T, Kobayashi K, Miya A. Patient age is significantly related to the progression of papillary microcarcinoma of the thyroid under observation. Thyroid 2014;24:27-34 35. Ito Y, Miyauchi A, Kobayashi K, Miya A. Prognosis and growth activity depend on patient age in clinical and
subclinical papillary thyroid carcinoma. Endocr J 2014;61:205-213
36. Lundgren CI, Hall P, Dickman PW, Zedenius J. Clinically significant prognostic factors for differentiated thy- roid carcinoma: a population-based, nested case-control study. Cancer 2006;106:524-531
37. Kim SY, Kwak JY, Kim EK, Yoon JH, Moon HJ. Association of preoperative US features and recurrence in pa- tients with classic papillary thyroid carcinoma. Radiology 2015;277:574-583
38. Jeong EY, Kim HL, Ha EJ, Park SY, Cho YJ, Han M. Computer-aided diagnosis system for thyroid nodules on ultrasonography: diagnostic performance and reproducibility based on the experience level of operators.
Eur Radiol 2019;29:1978-1985
39. Chi J, Walia E, Babyn P, Wang J, Groot G, Eramian M. Thyroid nodule classification in ultrasound images by fine-tuning deep convolutional neural network. J Digit Imaging 2017;30:477-486
40. Kim SY, Lee E, Nam SJ, Kim EK, Moon HJ, Yoon JH, et al. Ultrasound texture analysis: association with lymph node metastasis of papillary thyroid microcarcinoma. PLoS One 2017;12:e0176103
인공지능 딥러닝을 이용한 갑상선 초음파에서의 갑상선암의 재발 예측
길지은1 · 김광기2 · 김영재2 · 구혜령1 · 박정선1*
목적 수술 전 초음파 검사에서 갑상선 종양의 재발을 예측할 수 있는 심층 학습 모델을 개발 하고자 한다.
대상과 방법 수술 전 초음파에서 병리학적으로 확진된 갑상선 수술을 받은 229명의 환자(남 성:여성 = 42:187, 평균 연령, 49.6세)의 대표적인 초음파 이미지를 포함시켰다. 각각 대표적 인 횡축 또는 종축 초음파 이미지가 선택되었다. 신경 네트워크용 Python 2.7.6 및 Keras 2.1.5, convolutional neural network을 사용한 심층 학습이 사용되었다. 재발한 환자와 재발이 없 는 환자의 임상 및 조직학적 특징을 비교하였다. 그룹 간의 심층 학습 모델의 receiver oper- ating characteristic curve 곡선 아래의 영역은 재발 갑상선암을 예측하기 위한 심층 학습 모델의 예측에 사용되었다.
결과 전체 환자 229명 중 49명이 종양 재발(21.4%)을 보였다. 종양의 크기, 다원성은 재발이 없는 군과 재발 군에서 유의한 차이가 있었다(p < 0.05). 재발성 갑상선암 예측을 위한 심층 학습 모델의 전반적인 평균 area under the curve (이하 AUC) 값은 0.9 ± 0.06이었다. 평균 AUC는 macrocarcinoma에서 0.87 ± 0.03, microcarcinoma에서 0.79 ± 0.16이었다.
결론 갑상선암의 초음파 이미지를 이용한 심층 학습 모델로 갑상선암 재발의 예측 모델 구축 의 가능성을 보여주었다.
1한양대학교 의과대학 영상의학과, 2가천대학교 의과대학 의예과