서 론
국민건강영양조사 자료에 따르면 2013년 기준 30세 이상에서 제 2 형 당뇨병 환자는 2백7십만 명에 이르고 25%의 성인에서 당뇨병 전 단계로 진단되었다. 당뇨병은 고혈압, 고지혈증, 심혈관계 질환 및 신 장 질환 등의 여러 합병증으로 인해 사회적, 경제적 부담을 가증시키
는 질병으로 중요성이 대두되고 있다.1) 그래서 당뇨병의 예방에 대한 관심도 증가되고 있는데, 당뇨병의 예방을 위해 당뇨병 이환의 예측 인자에 대한 연구도 활발히 이루어지고 있다.
인슐린 저항성은 제2형 당뇨병의 중요 발병기전이나2,3) 임상에서 측정이 용이하지 않아 임상에서 비교적 쉽게 인슐린 저항성을 예측 할 수 있는 인자에 대한 연구가 진행되고 있다.4-11) 중성지방 대 고밀
Received June 13, 2017 Revised August 18, 2017 Accepted August 28, 2017
Corresponding author Mi-Kyeong Oh Tel: +82-33-610-3325, Fax: +82-33-641-8130 E-mail: [email protected]
ORCID: http://orcid.org/0000-0003-3602-9588
Copyright © 2018 The Korean Academy of Family Medicine
This is an open-access article distributed under the terms of the Creative Commons At- tribution Non-Commercial License (http://creativecommons.org/licenses/by-nc/4.0) which permits unrestricted noncommercial use, distribution, and reproduction in any medium, provided the original work is properly cited.
Original Article
https://doi.org/10.21215/kjfp.2018.8.3.462 eISSN 2233-9116
Korean J Fam Pract. 2018;8(3):462-467
Korean Journal of Family Practice
KJFP
당뇨병이 없는 성인에서 4-5년 추적관찰을 통한 중성지방 대 고밀도지질단백질의 비율과 당화혈색소와의 관계
김현하, 박우주, 장수은, 유승룡, 이현아, 오미경*
울산대학교 의과대학 강릉아산병원 가정의학과
Relationship between the Ratio of Triglyceride to High Density Lipoprotein and Glycated Hemoglobin A in 4-5 Years Follow-up in Non-Diabetic Adults
Hyun-Ha Kim, Woo-Joo Park, Soo-Eun Jang, Seung-Ryong Yoo, Hyeona-A Lee, Mi-Kyeong Oh*
Department of Family Medicine, Gangneung Asan Hospital, University of Ulsan College of Medicine, Gangneung, Korea
Background: There is growing interest in factors that can predict the occurrence of diabetes. Several studies have reported that the ratio of triglyceride to high-density lipoprotein cholesterol (TG/HDL-C ratio) reflects insulin resistance. The present study investigated whether the TG/HDL-C ratio can be a predictor of diabetes mellitus, considering that insulin resistance is an important mechanism for the risk of diabetes mellitus.
Methods: Among 1,177 patients who underwent two or more tests at 4- or 5-year intervals from 2006 to 2016 at a hospital health examination center in Gangwon-do Province, except for patients with chronic illnesses affecting the quality of data and lipid levels, 817 patients were included in the study. High TG/HDL-C ratios were based on previous studies: 3.5 for men and 2.0 for women. We investigated the relationship between the TG/
HDL-C ratio and glycated hemoglobin A (HbA1c) levels, and we examined whether the first TG/HDL-C ratio was related to changes in HbA1c levels and the presence or absence of diabetes after 4–5 years.
Results: Simultaneously, the high TG/HDL-C ratio group had significantly higher mean HbA1c levels. In men, the high TG/HDL-C ratio group showed a tendency of increased HbA1c levels 4–5 years later (P=0.060). In logistic regression analysis, the TG/HDL-C ratio did not show a significant relationship with the incidence of diabetes after 4–5 years.
Conclusion: Although the TG/HDL-C ratio is closely related to HbA1c levels, this study did not predict the increase in HbA1c levels and the occurrence of diabetes after 4–5 years.
Keywords: Triglycerides; Lipoprotein HDL; Glycated Hemoglobin A ; Diabetes Mellitus; Insulin Resistance
김현하 외. 중성지방 대 고밀도지질단백질의 비율과 당화혈색소의 관계 Korean Journal of Family Practice
KJFP
도지단백 콜레스테롤 비(ratio of triglyceride to high-density lipopro- tein cholesterol, TG/HDL-C ratio)는 인슐린 저항성과의 연관성을 반 영한다는 연구가 있었고,12-14) 심근경색에 의한 사망을 증가시키며,15) 공복혈당 및 당화혈색소(glycated hemoglobin A, HbA1c)와 상관관계 가 있음을 보여주는 연구도 발표되었다.16) 하지만 이전의 TG/HDL-C ratio에 대한 연구는 대부분 단면연구로 TG/HDL-C ratio에 대한 추 적 연구는 거의 없는 상태이다. 그래서 본 연구는 종합검진을 받은 수진자 중 당뇨병이 없는 건강한 성인을 대상으로 TG/HDL-C ratio 와 HbA1c의 관계를 포함하여 4–5년 후의 당뇨병의 발생 및 HbA1c 상승과의 관계를 알아보고자 하였다.
방 법
1. 연구 대상
2006년 6월부터 2016년 10월까지 강원도의 대학병원 검진센터에 서 종합건강검진을 받은 수진자 중 2차례 이상 검진을 받고, 그 기간 이 4년 혹은 5년 간격이면서 처음 검사에서 당뇨병을 진단받았거나 치료 중인 환자, 악성 질환을 앓고 있거나 기왕력이 있는 자, 이상지 질혈증으로 진단받고 치료 중인 자, B형 간염 바이러스 보유자를 포 함한 간질환, 뇌경색, 뇌출혈, 갑상선 질환, 중증근 무력증, 협심증의 기왕력이 있는 자를 제외하였으며 처음 검사에서 공복혈당 126 mg/
dL 이상, HbA1c가 6.5% 이상인 자, 그리고 TG와 HDL-C이 음주와 연 관되어 있어 알코올 섭취량 70 g/day 이상, gamma glutamyl transpepti- dase 150 IU/L 이상인 자를 제외한 성인 817명(여자 353명)을 대상으 로 하였다.
2. 연구 방법
1) 신체 계측 및 생활습관 조사
모든 참여자는 설문지를 통하여 기본적인 내용을 조사한 후 의사 가 이학적 진찰을 할 때 직접 문진을 통해 과거력 및 약물 복용력 등 을 재확인하였다. 키와 몸무게는 자동측정기(HC-1500; CAS, Yangju, Korea)를 이용하여, 키는 0.1 cm 단위까지, 몸무게는 0.1 kg 단위까지 측정하였고, 체질량지수(body mass index, BMI)는 측정한 몸무게를 키의 제곱으로 나눠 구하였다. 운동은 문진을 통해 얻은 값을 기준 으로 주 3회 이상 땀이 몸에 배일 정도의 운동을 하는 경우를 규칙 적으로 운동을 하는 것으로 보고 규칙적으로 운동하는 것과 규칙 적으로 운동하지 않는 것으로만 분류하였고, 흡연은 처음 방문 시의 흡연 여부로만 분류하였다. 음주와 총 식이 섭취 열량은 하루 중 먹 는 음식의 종류와 빈도를 설문조사를 통해 조사하여 본 검진센터 영양사가 빈도별 영양분석 방법으로 환산한 내용을 토대로 1일 섭
취량을 산출하였다.
2) 혈액검사
최소 8시간 이상의 공복 상태에서 채혈 검사를 시행하였다. 혈청 총 콜레스테롤농도와 중성지방 농도는 enzymatic calorimetric test로 측정하였고, 고밀도지단백 콜레스테롤은 selective inhibition 방법으 로, 저밀도지단백 콜레스테롤은 homogenous enzymatic calorimetric test로 측정하였고(Hitachi 747; Hitachi, Tokyo, Japan), HbA1c는 HLC- 723 G8 (Tosoh Corp., Tokyo, Japan)로 측정하였다.
3. 통계 분석 방법
모든 분석은 IBM SPSS Statistics for Windows (ver. 23; IBM Co., Ar- monk, NY, USA)를 사용하였으며, 유의확률은 0.05 미만인 경우에 통 계적으로 유의한 것으로 판정하였다.
TG/HDL-C ratio는 채혈을 통해 측정한 각 중성지방 농도와 고밀 도지단백 콜레스테롤을 나누어 소수점 둘째 자리에서 반올림하였 다. 그리고 TG/HDL-C ratio의 상위 25%에서 심장-대사질환 위험도 가 높아진다는 기존의 연구17-19)에 근거하여 상위 25%를 기준하여 각 성별로 TG/HDL-C ratio가 높은 군과 낮은 군으로 분류하였고, 이전 에 한국 성인을 대상으로 이루어진 연구20)에서 상위 25%에 해당하 는 값으로 남자 3.5, 여자 2.0을 제시한 바가 있었기에 본 연구에서 기 준값을 남자 3.5, 여자 2.0을 기준으로 TG/HDL-C ratio가 높은 군과 낮은 군으로 분류하였다.
남자와 여자로 분류하여 연령, 체질량지수, 지질수치, 총칼로리 섭 취, 음주량, TG/HDL-C ratio, HbA1c 등을 연구 등록된 처음 방문 시 상태와 4–5년 후 추적 상태를 비교 분석하기 위해 대응표본 t-검정 (paired t-test analysis)을 실시하였다. TG/HDL-C ratio 상승 여부에 따 른 HbA1c 상태를 살펴보기 위해 독립표본 t-검정(independent t-test analysis)을 실시하였고, 처음 방문 시 TG/HDL-C ratio 상태에 따른 4–5년 후 HbA1c 상승 여부와의 관계를 살펴보기 위해 교차분석의 카이 제곱 검정(chi-square test)을 실시하였다. 또한 처음 방문 시 TG/
HDL-C ratio와 4–5년 후 당뇨병 발생과의 관계를 알아보기 위해 로 지스틱 회귀분석(logistic regression analysis)을 실시하였다.
결 과
1. 연구 대상자의 특성
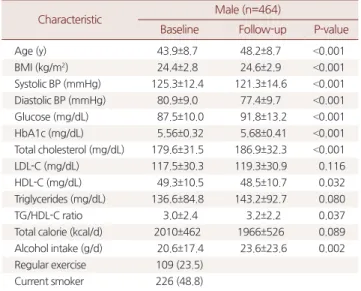
연구 대상자의 임상적 특징 분석결과 평균 나이는 처음 방문에서 남자는 43.9세, 여자는 43.5세였다. 처음 방문과 비교하여 추적검사 에서 남자에서는 BMI가 유의하게 증가하였지만, 여자에서는 BMI는
Original Article
Korean Journal of Family Practice
Hyun-Ha Kim, et al. Relationship between TG/HDL-C Ratio and HbA1c in 4-5 Years Followup
Korean Journal of Family Practice
KJFP
차이가 없었다. 남녀 모두에서 4–5년 후 추적 검사에서 HbA1c와 공 복혈당이 유의하게 상승하는 결과를 보였다(P<0.001). TG/HDL-C ratio는 남자에서는 평균 3.0에서 3.2로 유의하게 상승하였으나 (P=0.037), 여자에서는 유의한 변화를 보이지 않았다(P=0.520). 중성 지방은 남자에서는 상승하는 경향을 보였고, 여자에서는 의미있는 변화를 보이지 않았다(Tables 1, 2).
2. 동시에 측정한 TG/HDL-C ratio와 HbA1c의 관계
남자는 첫 방문에서 TG/HDL-C ratio군에 따라 HbA1c 값이 유의 한 차이를 보이지 않았지만(P=0.377), 추적 검사에서는 TG/HDL-C ratio가 높은 군이 HbA1c의 평균도 유의하게 높은 값을 보였다 (P=0.001). 여자에서는 처음 방문에서도 TG/HDL-C ratio가 높은 군 에서 HbA1c가 높은 결과를 보였고(P<0.001), 추적 검사에서도 TG/
HDL-C ratio와 HbA1c의 평균이 유의한 관계를 보였다(P<0.001) (Ta- ble 3).
3. 처음 방문 시 TG/HDL-C ratio와 4–5년 후 HbA1c 변화의 관계
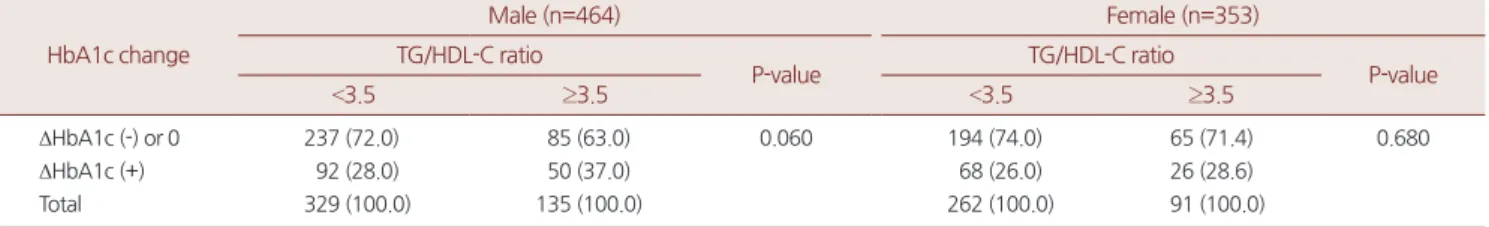
남자에서 처음 방문 시 TG/HDL-C ratio가 높은 군이 4–5년 후 HbA1c가 상승하는 경향을 보였지만(P=0.060), 여자는 유의한 차이 가 없었다(P=0.680) (Table 4).
4. 처음 방문 시 TG/HDL-C ratio와 4–5년 후 당뇨병 발생과의 관계
이분형 로지스틱 회귀분석의 결과 남녀 모두 TG/HDL-C ratio의 처음 값은 4–5년 후 당뇨병 발생과 유의한 관계를 보이지 않았다(남
Table 1. Dermographic characteristics of male at baseline and 4–5 years follow up
Characteristic Male (n=464)
Baseline Follow-up P-value
Age (y) 43.9±8.7 48.2±8.7 <0.001
BMI (kg/m2) 24.4±2.8 24.6±2.9 <0.001
Systolic BP (mmHg) 125.3±12.4 121.3±14.6 <0.001 Diastolic BP (mmHg) 80.9±9.0 77.4±9.7 <0.001
Glucose (mg/dL) 87.5±10.0 91.8±13.2 <0.001
HbA1c (mg/dL) 5.56±0.32 5.68±0.41 <0.001
Total cholesterol (mg/dL) 179.6±31.5 186.9±32.3 <0.001
LDL-C (mg/dL) 117.5±30.3 119.3±30.9 0.116
HDL-C (mg/dL) 49.3±10.5 48.5±10.7 0.032
Triglycerides (mg/dL) 136.6±84.8 143.2±92.7 0.080
TG/HDL-C ratio 3.0±2.4 3.2±2.2 0.037
Total calorie (kcal/d) 2010±462 1966±526 0.089 Alcohol intake (g/d) 20.6±17.4 23.6±23.6 0.002 Regular exercise 109 (23.5)
Current smoker 226 (48.8)
Values are presented as mean±standard deviation or number (%).
BMI, body mass index; BP, blood pressure; HbA1C, hemoglobin A1C; LDL-C, low density lipoprotein cholesterol; HDL-C, high density lipoprotein cholesterol;
TG, triglycerides.
P-values were obtained by analysis of t-test.
Table 2. Dermographic characteristics of female at baseline and 4–5 years follow up
Characteristic Female (n=353)
Baseline Follow-up P-value
Age (y) 43.5±10.1 47.8±10.1 <0.001
BMI (kg/m2) 22.7±3.1 22.8±3.1 0.181
Systolic BP (mmHg) 118.0±16.1 116.5±15.0 0.104
Diastolic BP (mmHg) 75.5±10.5 73.8±9.3 0.005
Glucose (mg/dL) 85.0±9.1 86.3±9.6 0.008
HbA1c (mg/dL) 5.52±0.35 5.61±0.32 <0.001
Total cholesterol (mg/dL) 173.6±30.7 182.6±32.2 0.675
LDL-C (mg/dL) 108.9±28.4 112.6±29.4 0.008
HDL-C (mg/dL) 57.3±13.1 56.8±12.4 0.264
Triglycerides (mg/dL) 90.3±84.7 88.5±51.5 0.675
TG/HDL-C ratio 1.8±3.1 1.7±1.4 0.520
Total calorie (kcal/d) 1,652±407 1,596±419 0.024
Alcohol intake (g/d) 4.2±8.4 4.5±12.0 0.518
Regular exercise 75 (21.2)
Current smoker 7 (2.0)
Values are presented as mean±standard deviation or number (%).
BMI, body mass index; BP, blood pressure; HbA1c, hemoglobin A1c; LDL-C, low density lipoprotein cholesterol; HDL-C, high density lipoprotein cholesterol; TG, triglycerides.
P-values were obtained by analysis of t-test.
Table 3. The relationship of TG/HDL-C ratio and HbA1c at the same time
Variable
Male (n=464) Female (n=353)
TG/HDL-C ratio
P-value TG/HDL-C ratio
P-value
<3.5 ≥3.5 <2.0 ≥2.0
Baseline 329 (70.9) 135 (29.1) 0.377 262 (74.2) 91 (25.8) <0.001
HbA1c (mg/dL) 5.55±0.23 5.58±0.31 5.47±0.34 5.68±0.35
Follow up 315 (67.9) 149 (32.1) 0.001 260 (73.7) 91 (25.8) <0.001
HbA1c (mg/dL) 5.63±0.38 5.77±0.44 5.58±0.32 5.68±0.35
Values are presented as mean±standard deviation or number (%).
TG, Triglycerides; HDL-C, high density lipoprotein cholesterol; HbA1c, hemoglobin A1c.
P-values were obtained by analysis of t-test.
김현하 외. 중성지방 대 고밀도지질단백질의 비율과 당화혈색소의 관계 Korean Journal of Family Practice
KJFP
자 P=0.201, 여자 P=0.608). 처음 방문에서 운동, 흡연, BMI, 총 섭취칼 로리, 알코올 섭취, 나이를 이분형 로지스틱 회귀분석을 실시한 결과 남자는 BMI만이 당뇨병 발생과 유의한 관계를 보였고(P=0.004), 여 자는 연령만이 유의한 관계를 보였다(P=0.037) (Table 5).
고 찰
본 연구는 TG/HDL-C ratio가 인슐린 저항성을 반영한다는 기존 의 연구를 바탕으로 TG/HDL-C ratio가 당뇨병의 발생을 예측할 수 있는지 확인해보고자 하였다. 그 결과로 동시간대 측정한 TG/HDL- C ratio와 HbA1c는 유의한 관계를 가지지만, 처음 방문에서 측정한 TG/HDL-C ratio는 추적 검사에서의 HbA1c와 유의한 관계를 가지지 않았다. 다만 HbA1c의 상승 여부 분석에서는 남자에서 처음 TG/
HDL-C ratio가 높은 군이 HbA1c이 상승하는 경향을 보였다.
인슐린 저항성이 있는 사람은 당뇨병을 진단받기 전부터 당뇨병 합병증 발생이 진행되고 있으며 미세혈관 합병증 및 심혈관 질환이 증가된다. 또한 인슐린 저항성은 제2형 당뇨병 발생의 가장 강력한 예측인자로,21) 인슐린 저항성 상태의 호전이 당뇨병 발병을 예방할 수 있다.4) 인슐린 저항성 측정의 직접적인 방법으로 고인슐린 정상 혈당 글루코스 클램프(hyperinsulinemic euglycemic glucose clamp).5) 인슐린 억제 검사(insulin suppression test)7)가 있고, 간접적인 방법으
로 최소 모델 분석(minimal model analysis),8) 경구 내당능 검사(oral glucose tolerance test)9)가 있지만 매우 번거롭고, 여러 차례의 검사가 필요하기 때문에, homeostasis model assessment-Insulin resistance,10) quantitative insulin sensitivity check index11) 등의 인슐린 저항성의 대 리 지표가 개발되었지만, 이 역시 인슐린 측정을 포함하여 측정시간 에 따른 오차가 크고 비교적 시간이 오래 걸려 1차 진료에서 시행하 기에는 어려운 방법이다.22) 그에 비해 TG/HDL-C ratio는 한 번의 채 혈로 간단하게 측정할 수 있고, 최근 이상지질혈증 환자가 늘어나고 있어 인슐린 저항성이나 당뇨병을 의심하지 않은 환자에게도 많이 시행하고 있는 검사이다.
TG/HDL-C ratio가 성인과, 비만한 소아에서 인슐린 저항성을 반 영한다는 연구가 있었고,12-14) 공복혈당 및 HbA1c와 상관관계를 가짐 을 보여주는 연구도 발표되었다.16) 이렇게 단면연구로 시행한 TG/
HDL-C ratio와 인슐린 저항성, 당뇨병을 연구한 논문들이 발표되었 지만, TG/HDL-C ratio에 대한 추적연구는 거의 없는 상태이다. TG/
HDL-C ratio가 인슐린 저항성을 반영하고, 인슐린 저항성이 당뇨병 을 예측할 수 있는 강력한 인자임을 고려하여 본 연구에서는 TG/
HDL-C ratio와 당뇨병의 발생 및 HbA1c 상승의 직접적인 상관관계 를 분석하였다.
TG/HDL-C ratio는 상위 25%를 기준으로 남자에서 3.5 이상, 여자 에서 2.0 이상을 TG/HDL-C ratio가 높은 군으로 정하였다.20) Table 4. The relationship of baseline TG/HDL-C ratio and change of follow up HbA1c
HbA1c change
Male (n=464) Female (n=353)
TG/HDL-C ratio
P-value TG/HDL-C ratio
P-value
<3.5 ≥3.5 <3.5 ≥3.5
ΔHbA1c (-) or 0 237 (72.0) 85 (63.0) 0.060 194 (74.0) 65 (71.4) 0.680
ΔHbA1c (+) 92 (28.0) 50 (37.0) 68 (26.0) 26 (28.6)
Total 329 (100.0) 135 (100.0) 262 (100.0) 91 (100.0)
Values are presented as number (%).
HDL-C, high density lipoprotein cholesterol; HbA1c, hemoglobin A1c; TG, triglycerides.
P-values were obtained by analysis of chi-square test.
Table 5. The logistic regression for the incidence of DM at 4–5 years follow up according to baseline characters
Characteristic Male Female
OR (95% CI) P-value OR (95% CI) P-value
TG/HDL-C ratio 1.102 (0.949–1.280) 0.201 1.033 (0.913–1.168) 0.608
Exercise 1.401 (0.442–4.445) 0.567 1.134 (0.120–10.734) 0.913
BMI (kg/m2) 1.247 (1.074–1.449) 0.004 1.002 (0.751–1.336) 0.992
Total calorie (kcal/d) 0.999 (0.998–1.001) 0.297 1.001 (0.999–1.003) 0.518
Alcohol intake (g/d) 1.004 (0.976–1.033) 0.795 0.774 (0.422–1.419) 0.407
Age (y) 1.062 (1.001–1.125) 0.645 1.103 (1.006–1.209) 0.037
Smoking 0.741 (0.279–1.974) 0.549 - -
DM, diabetes mellitus; OR, odds ratio; CI, confidence interval; TG, triglycerides; HDL-C, high density lipoprotein cholesterol; BMI, body mass index.
P-values were obtained by analysis of logistic regression analysis.
Hyun-Ha Kim, et al. Relationship between TG/HDL-C Ratio and HbA1c in 4-5 Years Followup
Korean Journal of Family Practice
KJFP
하지만 본 연구의 분석에서 TG/HDL-C ratio와 당뇨병의 발생 및 HbA1c 상승은 유의한 관계를 가지지 않는 결과를 보여주었다. 다만 기존의 연구와 비슷하게 동 시간대 측정한 TG/HDL-C ratio와 HbA1c는 유의한 관계를 보였다.
본 연구에서 TG/HDL-C ratio와 당뇨병 발생 및 HbA1c 상승이 유 의한 관계를 가지지 않은 이유로 먼저 당뇨병 발생 환자 수가 적었음 이 가장 큰 이유로 생각되는데, 표본 집단의 크기가 작고, 두 번의 측 정 간격이 4–5년으로 짧았던 것이 원인으로 보인다. 당뇨병 환자 발 생 수가 더 늘어나기 위해서는 더 큰 표본 집단이 있었다면 환자가 더 늘어났을 것이고, TG/HDL-C ratio가 높은 남자군에서 4–5년이라 는 기간 동안 HbA1c가 증가하는 경향을 보였음을 고려할 때 첫 번째 측정과 두 번째 측정의 시간 간격을 본 연구의 4–5년보다 더 길게 잡 았다면 유의한 결과가 나올 수도 있겠다. 또한, 본 연구에서는 평균 43세의 젊은 연령층을 대상으로 연구하였지만, 연령에 따라 늘어나 는 당뇨병의 특성을 고려할 때 보다 높은 연령층에서 연구한다면 의 미 있는 결과가 나올 수 있을 것으로 생각된다. 그렇지만 본 연구는 TG/HDL-C ratio가 동시에 측정한 HbA1c와 유의한 관계가 있음을 증명하였고, 추적 연구의 처음 시도였음에 의미를 두고자 한다.
앞으로 TG/HDL-C ratio의 당뇨병 발생에 대한 관계를 밝히기 위 한 더 큰 규모의 전향적인 연구와 TG/HDL-C ratio 조절이 당뇨병의 위험을 어느 정도 줄이는지 연구가 필요할 것으로 사료된다.
요 약
연구배경:
최근 당뇨병 발병이 점차 늘어나고 있고, 당뇨병 발생을 예측할 수 있는 인자에 대한 관심이 커지고 있다. 몇몇 연구에서 중 성지방 대 고밀도지질단백질의 비율(TG/HDL-C ratio)이 인슐린 저 항성을 반영한다는 결과들이 발표되었다. 본 연구는 인슐린 저항성 이 당뇨병 발병에 중요한 기전임을 고려하여, 중성지방 대 고밀도지 질단백질의 비율이 당뇨병 발생의 예측 인자가 될 수 있는지 연구해 보았다.방법:
본 연구는 강원도의 한 건강검진센터에서 2006년부터 2016년 까지 4년 혹은 5년 간격으로 2회 이상 검진을 시행한 1,177명 중 자료 미비 및 지질수치에 영향을 주는 만성질환자를 제외한 817명(남자 464명, 여자 353명)을 대상으로 하였다. TG/HDL-C ratio의 의미 있는 높은 수치는 기존 연구에 따라 남자는 3.5, 여자는 2.0을 기준으로 하 였다. TG/HDL-C ratio와 HbA1c와의 관계를 살펴보았고, 처음 TG/HDL-C ratio가 4–5년 후 HbA1c의 변화 및 당뇨병 발생 여부에 관련 성이 있는지 살펴보았다.
결과:
동시에 측정한 TG/HDL-C ratio가 높은 군은 평균 HbA1c의 수 치가 유의하게 높았다. 남자에서 TG/HDL-C ratio가 높은 군이 4–5 년 후 HbA1c가 상승하는 경향을 보였지만(P=0.060), 여자는 의미 있 는 변화가 없었다. 이분형 로지스틱 회귀분석에서 TG/HDL-C ratio 가 4–5년 후 당뇨병 발생과 유의한 관계를 보이지 않았다.결론:
본 연구를 통하여 TG/HDL-C ratio가 HbA1c와 밀접한 관련성 은 있지만, 4–5년 후 HbA1c의 상승 및 당뇨병 발생을 예측하지 못하 였다.중심단어:
중성지방; 고밀도지질단백질; 당화혈색소; 당뇨병; 인슐 린 저항성REFERENCES
1. Korean Diabetes Association. Korean diabetes fact sheet 2015 [Internet].
Seoul: National Health Insurance Service; c2015 [cited 2016 Apr 12]. Avail- able from: http://www.diabetes.or.kr/pro/news/admin.php?category=B&co de=admin&mode=view&number=1427.
2. Reaven GM. Banting lecture 1988. Role of insulin resistance in human dis- ease. Diabetes 1988; 37: 1595-607.
3. DeFronzo RA. Pathogenesis of type 2 diabetes mellitus. Med Clin North Am 2004; 88: 787-835, ix.
4. Buchanan TA, Xiang AH, Peters RK, Kjos SL, Marroquin A, Goico J, et al.
Preservation of pancreatic beta-cell function and prevention of type 2 dia- betes by pharmacological treatment of insulin resistance in high-risk his- panic women. Diabetes 2002; 51: 2796-803.
5. DeFronzo RA, Tobin JD, Andres R. Glucose clamp technique: a method for quantifying insulin secretion and resistance. Am J Physiol 1979; 237: E214- 23.
6. Shen SW, Reaven GM, Farquhar JW. Comparison of impedance to insulin- mediated glucose uptake in normal subjects and in subjects with latent dia- betes. J Clin Invest 1970; 49: 2151-60.
7. Harano Y, Hidaka H, Takatsuki K, Ohgaku S, Haneda M, Motoi S, et al. Glu- cose, insulin, and somatostatin infusion for the determination of insulin sensitivity in vivo. Metabolism 1978; 27(9 Suppl 1): 1449-52.
8. Bergman RN, Ider YZ, Bowden CR, Cobelli C. Quantitative estimation of insulin sensitivity. Am J Physiol 1979; 236: E667-77.
9. Dalla Man C, Campioni M, Polonsky KS, Basu R, Rizza RA, Toffolo G, et al.
Two-hour seven-sample oral glucose tolerance test and meal protocol: min- imal model assessment of beta-cell responsivity and insulin sensitivity in nondiabetic individuals. Diabetes 2005; 54: 3265-73.
10. Matthews DR, Hosker JP, Rudenski AS, Naylor BA, Treacher DF, Turner RC.
Homeostasis model assessment: insulin resistance and beta-cell function from fasting plasma glucose and insulin concentrations in man. Diabetolo- gia 1985; 28: 412-9.
11. Katz A, Nambi SS, Mather K, Baron AD, Follmann DA, Sullivan G, et al.
Quantitative insulin sensitivity check index: a simple, accurate method for assessing insulin sensitivity in humans. J Clin Endocrinol Metab 2000; 85:
김현하 외. 중성지방 대 고밀도지질단백질의 비율과 당화혈색소의 관계 Korean Journal of Family Practice
KJFP
2402-10.
12. McLaughlin T, Abbasi F, Cheal K, Chu J, Lamendola C, Reaven G. Use of metabolic markers to identify overweight individuals who are insulin resis- tant. Ann Intern Med 2003; 139: 802-9.
13. Li C, Ford ES, Meng YX, Mokdad AH, Reaven GM. Does the association of the triglyceride to high-density lipoprotein cholesterol ratio with fasting se- rum insulin differ by race/ethnicity? Cardiovasc Diabetol 2008; 7: 4.
14. Giannini C, Santoro N, Caprio S, Kim G, Lartaud D, Shaw M, et al. The tri- glyceride-to-HDL cholesterol ratio: association with insulin resistance in obese youths of different ethnic backgrounds. Diabetes Care 2011; 34:
1869-74.
15. Bittner V, Johnson BD, Zineh I, Rogers WJ, Vido D, Marroquin OC, et al. The triglyceride/high-density lipoprotein cholesterol ratio predicts all-cause mortality in women with suspected myocardial ischemia: a report from the Women’s Ischemia Syndrome Evaluation (WISE). Am Heart J 2009; 157:
548-55.
16. Park JM, Kang SM, Lee JW, Lee JW, Kim SW, Lee JH, et al. Correlation be- tween the ratio of triglyceride to high-density lipoprotein cholesterol and fasting glucose & hemoglobin A1C. Korean J Fam Pract 2015; 5(Suppl 3):
S462-7.
17. Salazar MR, Carbajal HA, Espeche WG, Leiva Sisnieguez CE, Balbín E, Dul- becco CA, et al. Relation among the plasma triglyceride/high-density lipo-
protein cholesterol concentration ratio, insulin resistance, and associated cardio-metabolic risk factors in med and women. AM J Cardiol 2012; 109:
1749-53.
18. Salazar MR, Carbajal HA, Espeche WG, Aizpurúa M, Leiva Sisnieguez CE, March CE, et al. Identifying cardiovascular disease risk and outcome: use of the plasma triglyceride/high-density lipoprotein cholesterol concentration ratio versus metabolic syndrome criteria. J Intern Med 2013; 273: 595-601.
19. Salazar MR, Carbajal HA, Espeche WG, Leiva Sisnieguez CE, March CE, Balbín E, et al. Comparison of the abilities of the plasma triglyceride/high- density lipoprotein cholesterol ratio and the metabolic syndrome to identify insulin resistance. Diab Vasc Dis Res 2013; 10: 346-52.
20. Sung KC, Reaven G, Kim S. Ability of the plasma concentration ratio of tri- glyceride/high-density lipoprotein cholesterol to identify increased cardio- metabolic risk in an east Asian population. Diabetes Res Clin Pract 2014;
105: 96-101.
21. Lillioja S, Mott DM, Spraul M, Ferraro R, Foley JE, Ravussin E, et al. Insulin resistance and insulin secretory dysfunction as precursors of non-insulin- dependent diabetes mellitus. Prospective studies of Pima Indians. N Engl J Med 1993; 329: 1988-92.
22. Kim JH, Kwon HS, Park YM, Lim SY, Lee JH, Lee SH, et al. Best surrogate marker for insulin resistance in middle aged non-diabetic Korean: Chungju metabolic syndrome study. Korean J Med 2007; 73: 611-7.