Microbiologically Induced Corrosion of Three Tubular Materials
S. Mukadam† and A. Al-Hashem
Petroleum Research Center, Kuwait Institute for Scientific Research, P.O. Box 24885, Safat 13109, Kuwait (Received July 22, 2015; Revised November 27, 2015; Accepted November 27, 2015)
The performance of three tubular materials (C-90, L-80, and N-80) was evaluated in a synthetic brine inoculated with sulfate-reducing bacteria (SRB) in the absence and presence of biocides. A flow loop was used in the evaluation of the three alloys. Morphological examination of the alloy surfaces after exposure to SRB and after biocide treatment was performed by scanning electron microscopy (SEM) to determine the nature of any localized corrosion. The SE images of the coupon samples showed a marked difference between the biocide-treated and untreated samples. Small pits were observed on the ultrasonically cleaned surfaces of the three alloys after exposure to SRB. The biocide treatment reduced the number of SRB on the surfaces of the alloys. Results indicated that C-90 and L-80 alloys exhibited better MIC resistance than N-80 under the conditions used in this study.
Keywords : Flow loop, sulfate-reducing bacteria, pitting attack, biocide
†Corresponding author: [email protected]
1. Introduction
Secondary recovery is becoming increasingly common in oilfields around the world as oil stocks dwindle and prices rise. Introduction of SRB and other microorganisms in injection water for secondary recovery has been asso- ciated with significant problems of souring, loss of in- jectivity, plugging and corrosion in fields that had pre- viously been trouble free and sweet1-6).The potential for MIC, therefore, increases significantly with secondary re- covery operations and must be considered in any program of water injection. There are various factors that affect the degree of souring and corrosion in secondary injection systems. Mineralogy of the formation rock is one factor in SRB contamination. Siderites, iron-bearing minerals, can act as a barrier to H2S production by sequestering sulfide, increasing the time before production souring oc- curs7).The composition of the indigenous microbial com- munity is a second factor. Competitive exclusion of SRB by other, less harmful bacteria can reduce sulfide pro- duction. Encouraging beneficial bacteria has been used successfully to mitigate problems associated with SRB8,9). The alloys of C90, N80 and L80 are often used for oil and gas pipelines due to their corrosion resistance properties. All of these alloys have different combinations of C, Mn, Cr, and Mo10). Many pipe lines suffer corrosion
due to sulfate reducing bacteria that form biofilms within the pipe lines11-15). This corrosion slowly reduces the strength of the steel.
Biofilms are a cohesive matrix of microorganisms, mu- co-polysaccharides (slime), and extracellular constituents that exist in virtually every natural environment. Biofilms form in an environment in response to the presence of a solid surface as well as other factors such as shear force (flow) as a mechanism to avert being removed from that environment. Biofilm formation is a developmental proc- ess moving from attachment, to micro-colony formation, and then to mature biofilm development under the control of specific biofilm genes. The production of a muco-poly- saccharide (slime) on the surface that further protects the biofilm and can often be seen with the naked eye.
Once formed, biofilms are difficult to remove as they show an increased resistance to biocides and antibiotics when compared to planktonic (free-floating) microorga- nisms. Studies have shown a greater than hundred-fold resistance to antibiotics of biofilms when compared to the same bacteria in a planktonic (free floating) state. This resistance is due to the mucopolysaccharide coating that is developed and a physiological alteration in the micro- organism.
The main purpose of this study is to compare the corro- sion behaviour of three different metal alloy pipes (C-90, N-80, and L-80) using brine solution inoculated with Desulfovibro spp. and two different biocides.
Table 1. Tubular alloys tested in this study
Test Assembly
C-90 metal alloy pipe A
N-80 metal alloy pipe B
L-80 metal alloy pipe C
Table 2. Biocide used in this study
Antimicrobial Concentration
Media water Control
Biocide (Hydroxymethylphosphonium sulfate) 500 – 1000 ppm
Table 3. Microbes used in this study
Pathogen Source
Desulfovibro spp. (SRB)
Anaerobic isolate Canadian Laboratory
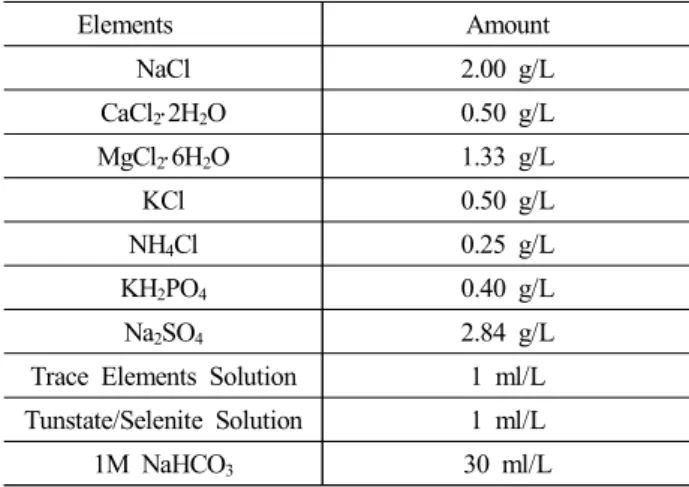
Table 4. Concentration and contents of media water
Elements Amount
NaCl 2.00 g/L
CaCl2×2H2O 0.50 g/L
MgCl2×6H2O 1.33 g/L
KCl 0.50 g/L
NH4Cl 0.25 g/L
KH2PO4 0.40 g/L
Na2SO4 2.84 g/L
Trace Elements Solution 1 ml/L Tunstate/Selenite Solution 1 ml/L
1M NaHCO3 30 ml/L
2. Experimental Procedure
The tubular alloys used in the study are listed in the Table 1 as shown below:
The Antimicrobial used in the study are listed in Table 2 as shown below:
Test microorganism used in the study is in Table 3 as shown below:
2.1 Bacteria culture preparation
A stored SRB, Desulfovibrio vulgaris, from the 4 ℃ PB stock was streaked onto fresh Postgate E agar and given enough time to grow in anaerobic conditions until colonies formed. A loop full of SRB colonies was then inoculated into Postgate C media and grown at 30 ℃ un- der anaerobic conditions. Inoculated Postgate C media was then added to media water (Table 4) to achieve a cell
count of 106 cfu/ml. Then, the inoculated media water was split into 2 separate volumes under anaerobic conditions.
One volume was used for the control and Biocide 1 was added to the second volume. Under anaerobic conditions 4 mL of inoculated media water with or without biocide was put in each well of the 6 well plates. Best lids contain- ing the metal alloy samples were placed in the wells. Plates were then incubated in the CO2 chamber (stationary).
For the control, the media was made as shown in the table 4. For media water, the biocide was added after sterilization. The media water was sterilized and purged with N2.
2.2 Weekly inoculums changes over two months Each week fresh inoculum with fresh biocide was made as described in section 4.1. 8 mL of fresh inoculum was put into each well of the 6 well plates. A sample of the week old inoculum was checked for planktoinc viable cell counts using serial dilutions and spot plating on Postgate E agar.
2.3 Test method
At the end of each time point (2, 4, 8 weeks), each lid of the 6 well BEST plates was rinsed in sterile 0.9
% saline in anaerobic atmosphere.
2.4 Biofilm determination
Each lid was put into 8 mL of sterile Postgate C media and sonicated for 15 minutes.
Following sonication, 100 µl from each well of the 6 well plates was put into the first 12 empty wells of the first row of a 96 well-micro titre plate. 180 µl of media water was put into the remaining rows. A serial dilution (100-10-7) was done by moving 20 µl down each of the 8 rows. 20 µl from each well was removed and spot plated on Postgate B agar.
Plates were incubated and counted after approximately 24 hours of incubation. All data was evaluated as log CFU/mm2. Log difference was calculated by subtracting the average of each biocide treated pipe from the control pipe.
2.5 SEM Preparation
One peg of each metal alloy from each teat was put into a vial containing 2 mL of gluteraldehyde mix. The gluteraldehyde mix with the metal alloy was incubated at 4 ℃ for 24 hours. Following the 24 hours the 2 mL of gluteraldehyde mix was removed from the vials. The vials sat under the hood for 24 hours to air dry. Digital photos of the metal alloy samples were taken. These pho- tos were made into descriptive figures.
Sulfide production from the growth of Desulfovibrio vulgaris Hildenborough in the Anaerobic chamber.
0 5 10 15 20
0 1 2 3 4
Time (days)
sulfide (mM)
Sulfide
Fig. 1. The concentration of sulfide with exposure time in the me- dia with SRB.
Fig. 2. Effect of biocide on SRB growth with time for N-80 alloy.
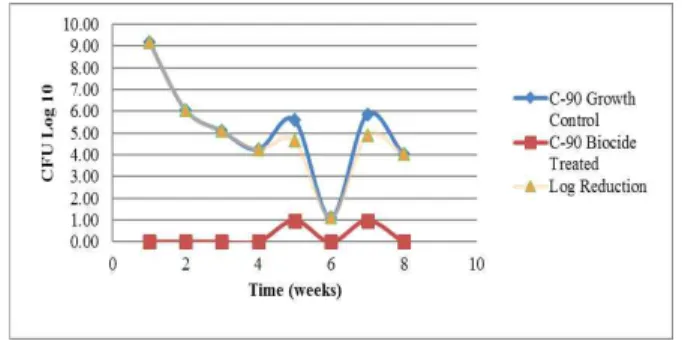
Fig. 3. Effect of biocide on SRB growth with time for C-90 alloy.
Fig. 4. Effect of biocide on SRB growth with time for L-80 alloy.
Fig. 5. Effect of biocide on SRB growth with time for C-90 alloy.
2.6 Corrosion weight differences and BEST plate construction
Prior to the challenge period each trial piece of alloy piping were weighed (together and separate) prior to mounting to the lid of the 6 well plate. Following each challenge period the metal pegs were removed from the BEST device. The metal pegs were washed in 2 mL of washing solution (774 mL HCL, 20g Sb2O3, and 50 g SnCl2).
Following drying, the 6 metal pegs were weighed to- gether and separate. The weight before the challenge mi- nus the weight after the challenge gave the total weight loss or gain due to corrosion from the biocide and/ or the microorganism.
3. Resutls and Discussion
Bacteria growth in the anaerobic chamber was meas- ured by measuring the amount of sulfide produced in the media. Fig. 1 illustrates the growth of SRB followed the typical "S: curve.
3.1 Log reduction planktonic cells
The log reduction of the planktonic cells showed that the biocide treated media water had almost no bacterial activity. This was the case for the every time point and every metal coupon type. This showed large inhibition of SRB activity when the biocide was present (Fig. 2-4).
3.2 Biofilm recovery
Biofilm recovery was good for all three time points.
The C-90 metal seemed to have a slightly amount of bio- film recovery compared to the N-80 and L-80 samples.
The biocide treated samples had almost no recoverable bacteria. This agrees with the SEM data showing no cells present on the biocide treated surfaces. The amount of
cells recovered from sonicating was lower than the plank- tonic amounts. Fig. 5 illustrates a typicalbiofilm recoveries for the three alloys.
Fig. 6-8 show SEM micrographs of the coupon samples revealing a marked difference between the biocide treated
a. Biocide Treated. Some pitting is present.
b. Growth Control. Bacteria cells present.
c. Biocide Treated. No cells present.
d. Growth Control. Some biofilm / slime found.
Fig. 6. SEM micrograph of alloy C-90 after exposure to SRB media.
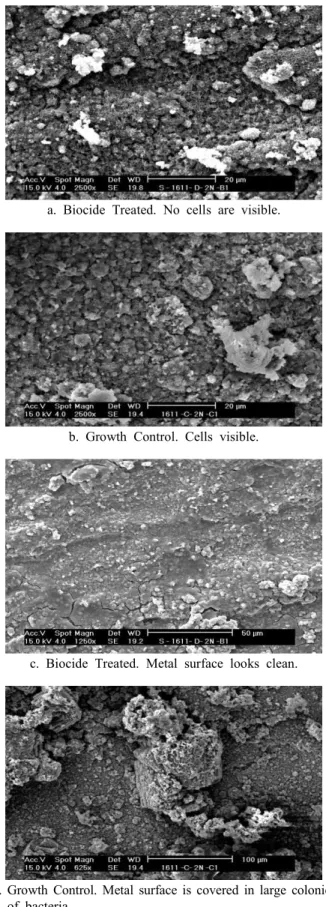
a. Biocide Treated. No cells are visible.
b. Growth Control. Cells visible.
c. Biocide Treated. Metal surface looks clean.
d. Growth Control. Metal surface is covered in large colonies of bacteria.
Fig. 7. SEM micrograph of alloy N-80 after exposure to SRB media.
and untreated samples. AlloyC-90 had no visible cells on the biocide treated coupon. The metal looked cleaner and smoother than the growth control. The growth control on the other hand had large amounts of visible bacteria and the metal surface looked rougher. Slime can be seen in some of the photos (Fig. 6d). Alloy N-80 growth control
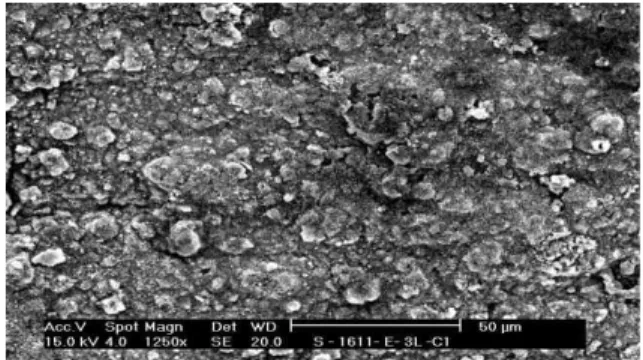
a. Biocide Treated. Some salt deposits are visible. b. Growth Control. Surface looks rough.
c. Biocide Treated. Metal surface looks clean. d. Growth Control. Large amounts of pitting and debris can be seen.
Fig. 8. SEM micrograph of alloy L-80 after exposure to SRB media.
had large amounts of bacteria on its surface along with large bacterial colonies scattered on its surface (Fig. 7).
The metal seemed to be rough and the valleys seemed to be bigger indicating that there was perhaps higher cor- rosion on this sample. The biocide treated coupon had no visible colonies and the metal seemed to be smoother and cleaner. Alloy L-80 growth control had no visible cells on the surface (Fig. 8). This may be because the cells were beneath a slime layer or the fixing process may have removed them. The surface did look different than the biocide treated compound with large amounts of small cube-like formations and high amounts of pitting when compared to the biocide treated samples. The biocide treated had almost no cube like formations and the surface was smoother, with less pits and valleys. This may in- dicate that there was less corrosion happening on the bio- cide treated sample.
4. Conclusions
1. Alloys of L-80, N-80 and C-90 were attacked by a mixed consortium of brine tolerant bacteria containing SRB.
2. The use of effective biocide can reduce MIC attack of the tubular alloys under West Kuwait production
conditions.
3. Attack by bacteria should be a source for concern in secondary injection, since many strains can thrive up to 25 to 30 % salt.
4. Injection water quality is an important parameter in determining MIC of down-hole tubulars.
Acknowledgments
The authors greatly acknowledge the financial support of Kuwait Oil Company (KOC) and Kuwait Institute for Scientific Research (KISR) for this work.
References
1. J. M. Galbraith, K.L. Lofgren, Mater. Performance, 26, 42 (1987).
2. R. A. Agostini, R. D. Young, Mater. Performance, 30, 75 (1991).
3. W. Eden, P. J. Laycock, M. Fielder, Oil reservoir souring, p. 87, HSE Books, UK, http://www.hse.gov.uk/research/
othpdf/200-399/oth385.pdf (1993).
4. O. H. Pucci, Int. Biodeter. Biodegr., 37, 116 (1996).
5. Z. I. Khatib, J. R. Salanitro, proceedings of the SPE Annual Technical Conference and Exhibition, p. 2, Society of Petroleum Engineers, San Antonio, Texas (1997).
6. S. A. Lagoven, Practical Manual of Biocorrosion and Biofouling for the Industry, p. 151, CYTED Research Network, La Plata, Argentina (1998).
7. L. C. Jordan, J. M. Walsh, Proceedings of the Corrosion 2004, p. 11, NACE, New Orleans (2004).
8. G. E. Jenneman, P. D. Moffitt, G. A. Bala, R. H. Webb, Society of Petroleum Engineers, 14, 219 (1999).
9. J. Larsen, M. H. Rod, S. Zwolle, Proceedings of the Corrosion 2004, p. 18, NACE, New Orleans (2004).
10. R. D. Bryant, W. Jansen, J. Boivin, E. J. Laishley, and J. W. Costerton, Appl. Environ. Microb., 57, 2804 (1991).
11. J. A. Straatmann, and J. Grobner, Met. Sci. Heat. Treat., 19, 610 (1977).
12. A. V. Sobral-Santiago, D. Da C. Magalhaes, H. F. G.
de Abreu, H. B. de Sant Ana, and V. M. M. Melo, Acta Micoscopica, 12, 209 (2003).
13. F. P. de Franca, and M. T. S. Lutterbach, J. Ind. Microbiol., 17, 6 (1996).
14. C. O. Obuekwe, D. W. S. Westlake, F. D. Cook, and J.
W. Costerton, Appl. Environ. Microb., 41, 766 (1981).
15. J. M. Romero, C. Angeles-Chavez, and M. Amaya, Corros.
Eng. Sci. Techn., 39, 261 (2004).