INTRODUCTION
Liver fibrosis represents the wound healing response to chronic liver injury brought about by processes such as chron- ic viral hepatitis, excessive alcohol consumption, nonalcoholic steatohepatitis, hemochromatosis, or immune-mediated liver injury (1). Cirrhosis develops if liver fibrosis progresses. Cir- rhosis is characterized by the presence of bands of fibrosis, parenchymal nodules, and vascular distortion, all of which lead to hepatic dysfunction and the major life-threatening complications that characterize the condition.
Therefore, an accurate assessment of disease severity is im- portant in predicting prognosis and guiding treatment deci- sions in patients with chronic liver disease. Liver biopsy is still considered the gold standard for assessing liver fibrosis (2). This procedure is very useful because it provides informa- tion about the degree of liver fibrosis, as well as the severity and extent of inflammation (2). However, it is invasive and can lead to grave complications (3, 4). Furthermore, its accu- racy in assessing fibrosis is questionable because of sampling errors (5-9) and intra- and inter-observer discrepancies (9-11).
In addition, because liver biopsy is a static examination, it does not represent the dynamic changes during the progres- sion of liver fibrosis.
To circumvent the limitations of liver biopsy, noninvasive markers have attracted the attention of many investigators, and various markers in the blood have been proposed as poten- tial indicators of liver fibrosis. Some studies have suggested the fibrosis-predicting models composed of several potential blood markers, including AAR (AST/ALT ratio) (12-14), PGA (prothrombin time, g-GT, apolipoprotein A1), PGAA index (prothrombin time, g-GT, apolipoprotein A1, a2-macroglobu- lin), FibroTest�(15), Forns fibrosis index (FFI) (16), and age to platelet ratio index (APRI) (17). Other reports have suggested several serum markers, including collagen, hyaluronic acid, YKL-40, matrix metalloproteinase (MMP), and tissue inhi- bitor of metalloproteinase (TIMP), all of which have a poten- tial role in the accumulation or degradation of extracellular matrix (ECM) (18, 19). However, comprehensive validating studies dealing with all these blood markers simultaneously in a large group of patients have rarely been carried out, par- ticularly in the area where hepatitis B virus is endemic.
67
Han Hyo Lee1, Yeon Seok Seo1, Soon Ho Um1, Nam Hee Won2, Hanna Yoo3, Eun Suk Jung1, Yong Dae Kwon1, Sanghoon Park1, Bora Keum1, Yong Sik Kim1, Hyung Joon Yim1, Yoon Tae Jeen1, Hoon Jai Chun1, Chang Duck Kim1, and Ho Sang Ryu1
Departments of Internal Medicine1, and Pathology2, College of Medicine; Department of Statistics3, Korea University, Seoul, Korea
Address for Correspondence Soon Ho Um, M.D.
Department of Internal Medicine, Korea University College of Medicine, 73 Inchon-ro, Seongbuk-gu, Seoul 136-705, Korea
Tel : +82.2-920-5019, Fax : +82.2-953-1943 E-mail : [email protected]
This study was supported by a grant from Ministry for Health, Welfare and Family Affairs, Republic of Korea (No. A050021).
Usefulness of Non-invasive Markers for Predicting Significant Fibrosis in Patients with Chronic Liver Disease
The purpose of this prospective study was to verify and compare the strengths of various blood markers and fibrosis models in predicting significant liver fibrosis. One hundred fifty-eight patients with chronic liver disease who underwent liver biopsy were enrolled. The mean age was 41 yr and male patients accounted for 70.2%.
The common causes of liver disease were hepatitis B (67.7%) and C (16.5%) and fatty liver (9.5%). Stages of liver fibrosis (F0-4) were assessed according to the Batts and Ludwig scoring system. Significant fibrosis was defined as ≥F2. Sixteen blood markers were measured along with liver biopsy, and estimates of hepatic fibrosis were calculated using various predictive models. Predictive accuracy was evaluat- ed with a receiver-operating characteristics (ROC) curve. Liver biopsy revealed sig- nificant fibrosis in 106 cases (67.1%). On multivariate analysis, a2-macroglobulin, hyaluronic acid, and haptoglobin were found to be independently related to signifi- cant hepatic fibrosis. A new predictive model was constructed based on these vari- ables, and its area under the ROC curve was 0.91 (95% confidence interval, 0.85- 0.96). In conclusion, a2-macroglobulin, hyaluronic acid, and haptoglobin levels are independent predictors for significant hepatic fibrosis in chronic liver disease.
Key Words : Liver Cirrhosis; Biological Markers; Chronic Liver Disease
ⓒ 2010 The Korean Academy of Medical Sciences.
This is an Open Access article distributed under the terms of the Creative Commons Attribution Non-Commercial License (http://creativecommons.org/licenses/by-nc/3.0) which permits unrestricted non-commercial use, distribution, and reproduction in any medium, provided the original work is properly cited.
Received : 20 October 2008 Accepted : 15 February 2009
This study was performed prospectively in order to assess and compare the predictive power of a variety of previously- reported surrogate markers for identifying significant fibro- sis, and preferably, to establish a more reliable predictive model for liver fibrosis.
MATERIALS AND METHODS Patients
All consecutive patients with chronic liver disease seen in our institution between June 2006 and December 2007 with an indication for percutaneous liver biopsy were included in this study. Liver biopsy was performed for assessment of the severity of liver fibrosis and inflammation prior to treatment or for the evaluation of the cause of liver disease.
The cause of chronic liver disease was determined using standard diagnostic criteria. Chronic hepatitis B was diag- nosed by positive serologic tests for serum hepatitis B surface antigen for at least 6 months. Chronic hepatitis C was diag- nosed by serologic detection of hepatitis C antibody and posi- tive serum hepatitis C virus RNA by polymerase chain reac- tion. Alcoholic liver disease was diagnosed in patients with consumption of at least 80 g of alcohol daily for more than five years without other causes of chronic liver diseases. The diagnosis of nonalcoholic fatty liver disease was in patients with elevated aminotransferses and liver histology showing
steatosis in at least 10% of hepatocytes without causes of chronic liver diseases. Primary biliary cirrhosis was diagnos- ed by at least two of the following criteria: serum alkaline phosphatase more than 1.5 times the upper limit of normal, positive antimitochondrial antibody, and compatible liver histology. The diagnosis of autoimmune hepatitis was based on the revised descriptive criteria reported by the Internation- al Autoimmune Hepatitis Group. Patients were excluded from the study if they had any disorder associated with extra- hepatic fibrosis, including rheumatic, renal, or lung disease;
any cardiovascular disease or cancer; or advanced cirrhosis with evidence of decompensation. Weight and height on the liver biopsy day and average alcohol consumption during the 5 preceding years were recorded for each patient.
All patients provided written informed consent for their participation in the study, and the conditions of the consent were in strict adherence to the principles of the Declaration of Helsinki.
Surrogate markers for fibrosis
Laboratory tests, including platelet count, prothrombin time, alanine aminotransferase (ALT), aspartate aminotrans- ferase (AST), alkaline phosphatase (ALP), and g-glutamyl- transpeptidase (g-GT), were evaluated in all patients on the liver biopsy day, using commercially available assays. Apoli- poprotein A1 (Roche, Munich, Germany), a2-macroglobu- lin (Dade Behring, Marburg, Germany), haptoglobin (Roche,
AST, aspartate aminotransferase; ALT, alanine aminotransferase; PT, prothrombin time; INR, international normalized ratio; g-GT, gamma-glutamyl transpeptidase; AAR, AST/ALT ratio; FFI, Forns fibrosis index; APRI, AST-to-platelet ratio index; ULN, upper limit of normal; API, age-platelet index;
CDS, cirrhosis discriminant score.
Panels Components
AAR AST/ALT
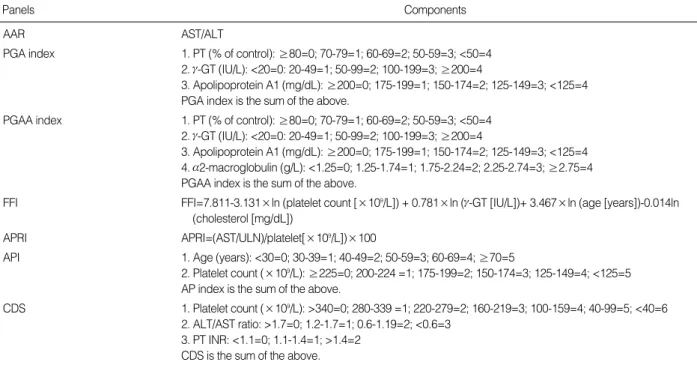
PGA index 1. PT (% of control): ≥80=0; 70-79=1; 60-69=2; 50-59=3; <50=4 2. g-GT (IU/L): <20=0: 20-49=1; 50-99=2; 100-199=3; ≥200=4
3. Apolipoprotein A1 (mg/dL): ≥200=0; 175-199=1; 150-174=2; 125-149=3; <125=4 PGA index is the sum of the above.
PGAA index 1. PT (% of control): ≥80=0; 70-79=1; 60-69=2; 50-59=3; <50=4 2. g-GT (IU/L): <20=0: 20-49=1; 50-99=2; 100-199=3; ≥200=4
3. Apolipoprotein A1 (mg/dL): ≥200=0; 175-199=1; 150-174=2; 125-149=3; <125=4 4. a2-macroglobulin (g/L): <1.25=0; 1.25-1.74=1; 1.75-2.24=2; 2.25-2.74=3; ≥2.75=4 PGAA index is the sum of the above.
FFI FFI=7.811-3.131×ln (platelet count [×109/L]) + 0.781×ln (g-GT [IU/L])+ 3.467×ln (age [years])-0.014ln (cholesterol [mg/dL])
APRI APRI=(AST/ULN)/platelet[×109/L])×100
API 1. Age (years): <30=0; 30-39=1; 40-49=2; 50-59=3; 60-69=4; ≥70=5
2. Platelet count (×109/L): ≥225=0; 200-224 =1; 175-199=2; 150-174=3; 125-149=4; <125=5 AP index is the sum of the above.
CDS 1. Platelet count (×109/L): >340=0; 280-339 =1; 220-279=2; 160-219=3; 100-159=4; 40-99=5; <40=6 2. ALT/AST ratio: >1.7=0; 1.2-1.7=1; 0.6-1.19=2; <0.6=3
3. PT INR: <1.1=0; 1.1-1.4=1; >1.4=2 CDS is the sum of the above.
Table 1. Various predictive models for liver fibrosis in patients with chronic liver disease
Munich, Germany), collagen IV (Fine chemical, Tokyo, Japan), and hyaluronic acid (Corgenix, Denver, CO, USA) were deter- mined in serum samples using an enzyme immunoassay. The procollagen III N-terminal peptide (PIIINP) concentration was measured using a radioimmunoassay (Orion Diagnostica, Espoo, Finland). A sandwich immunoassay was used to quan- tify serum YKL-40 (Metra Biosystems/Quidel, San Diego, CA, USA), matrix metalloproteinases (MMP)-2 and -9 (R &
D Systems, Minneapolis, MN, USA), and tissue inhibitor of metalloproteinase (TIMP)-1 (R & D Systems). In addition, using the results of surrogate markers, various well-known predictive models for fibrosis, including the AST/ALT ratio (AAR) (20), PGA index (prothrombin time, g-GT, apolipo- protein A1) (21), PGAA index (prothrombin time, g-GT, apolipoprotein A1, a2-macroglobulin) (1), Forns fibrosis index (FFI; platelet count, g-GT, age, cholesterol) (16), AST to platelet ratio index (APRI) (17), age platelet index (API) (22), and cirrhosis discriminant score (CDS; platelet count, AST, ALT, PT INR) (23), were calculated using the equa- tions in Table 1.
Liver histology
Liver biopsies were carried out by ultrasound-guided tech- nique using a 16-gauge biopsy needle, and the total length of the biopsy specimen was more than 1.5 cm. Liver biopsy sections were formalin-fixed, paraffin-embedded, and stained routinely with hematoxylin-eosin-saffron and Masson’s tri- chrome. All liver biopsies were evaluated blindly, and the histological changes of chronic hepatitis were classified accord- ing to the Batts and Ludwig scoring system (24) by a single experienced pathologist blinded to both clinical data and the results of noninvasive tests. Fibrosis was staged on a 0-4 scale as follows: F0, no fibrosis; F1, fibrous portal expansion; F2, periportal fibrosis with periportal or rare portal-portal septa;
F3, fibrous septa with architectural distortion but no obvious cirrhosis; F4, cirrhosis. Fibrosis was considered significant when the fibrosis stage was F2 or more.
Statistical analysis
All data were analyzed using SPSS statistical package soft- ware version 13.0 (SPSS Inc., Chicago, IL, USA). Data are presented as mean±SD. Student t-test and the chi-square test were used to compare quantitative and qualitative vari- ables, respectively. Patients were categorized according to the severity of their histologic lesions. The relationship between fibrosis stage and other variables was assessed using Spear- man’s correlation analysis. Logistic regression analysis with a stepwise forward approach was used to determine indepen- dent predictive markers for significant fibrosis among the var- ious markers. In addition, a new predictive model was con- structed by modeling the values of the independent variables and their coefficients of regression. The predictive accuracy
was assessed by calculating the area under the receiver-oper- ating characteristics curve (AUROC). AUROCs were com- pared using the method of Hanley and McNeil (25). A two- tailed P value less than 0.05 was considered statistically sig- nificant.
RESULTS Patient characteristics
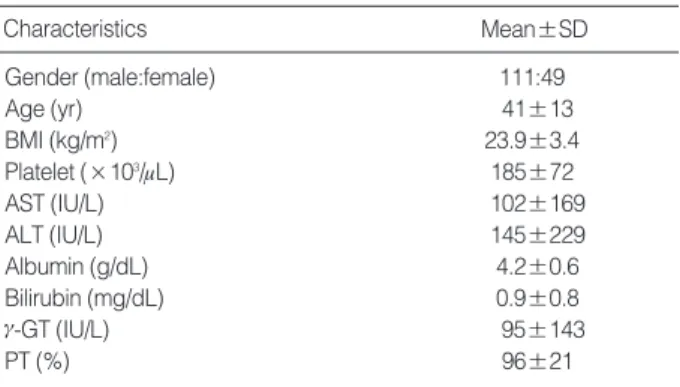
One hundred fifty-eight patients with chronic liver disease were enrolled in this study. Their demographic and baseline characteristics are summarized in Table 2. There were 111 men and 47 women, and their mean age was 41±13 yr. Causes of chronic liver disease included chronic hepatitis B in 107 patients (67.7%), chronic hepatitis C in 26 (16.5%), nonal- coholic fatty liver disease in 15 (9.5%), alcoholic liver disease in 3 (1.9%), autoimmune hepatitis in 3 (1.9%), primary bil- iary cirrhosis in 2 (1.3%), and cryptogenic cirrhosis in 2 (1.3
%). The fibrosis stages identified on liver biopsy was F0 in 18 patients (11.4%), F1 in 34 (21.5%), F2 in 41 (25.9%), F3 in 41 (25.9%), and F4 in 24 (15.2%). A total of 106 pati- ents (67.1%) had significant fibrosis (≥F2).
Correlations between surrogate markers and stage of liver fibrosis
The results of various markers according to fibrosis stage are presented in Fig. 1, and the correlation between various clinical variables and fibrosis stage are shown in Table 3. Pla- telet count, prothrombin time, and haptoglobin and MMP-9 levels showed a negative correlation with fibrosis stage (P<
0.01), whereas the levels of procollagen III, collagen IV, hya- luronic acid, a2-macroglobulin, MMP-2, TIMP-1, and YKL- 40 showed a positive correlation (P<0.01).
BMI, body mass index; AST, aspartate aminotransferase; ALT, alanine aminotransferase; g-GT, gamma-glutamyl transpeptidase; PT, prothrom- bin time.
Characteristics Mean±SD
Gender (male:female) 111:49
Age (yr) 41±13
BMI (kg/m2) 23.9±3.4
Platelet (×103/mL) 185±72
AST (IU/L) 102±169
ALT (IU/L) 145±229
Albumin (g/dL) 4.2±0.6
Bilirubin (mg/dL) 0.9±0.8
g-GT (IU/L) 95±143
PT (%) 96±21
Table 2. Baseline characteristics of patients (n=158)
The efficacy of various surrogate markers for predicting significant liver fibrosis
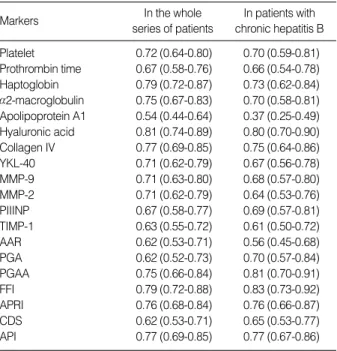
Of 12 single surrogate markers, the AUROCs of hyaluron- ic acid, haptoglobin, collagen IV, and a2-macroglobulin were
above 0.75 (0.81, 0.79, 0.77, and 0.75, respectively) for pre- dicting F≥2 in all enrolled patients. The AUROC of hya- luronic acid was significantly higher than those of platelet count, prothrombin time, PIIINP, MMP-2, MMP-9, TIMP- 1, YKL-40, and apolipoprotein A1 (Table 4). Of the previ-
A
Fig. 1. Box plots of each marker of fibrosis according to the stage of liver fibrosis. The top and bottom of each box are the 25th and 75th percentiles, giving the interquartile range. The line through the middle of each box represents the median. The error bars are the 5th and 95th percentiles.
PIIINP, procollagen III N-terminal peptide; MMP, matrix metalloproteinase; TIMP, tissue inhibitor of metalloproteinase.
Age (yr)
70 60 50 40 30 20 10
F0 F1 F2 F3 F4
Age
B
Prothrombin time (%)
160 140 120 100 80 60 40
F0 F1 F2 F3 F4
Prothrombin time
C
F
I
L
Platelet (K/mL)
400
300
200
100
0
F0 F1 F2 F3 F4
Platelet count
D
Procollagen III (U/mL)
3.0
2.5
2.0 1.5
1.0
0.5
F0 F1 F2 F3 F4
PIIINP
E
Haptoglobin (mg/dL)
250
200
150
100
50
0
F0 F1 F2 F3 F4
Haptoglobin
Collagen IV (ng/mL)
500
400
300
200
100
0
F0 F1 F2 F3 F4
Collagen IV
G
Hyaluronic acid (ng/mL)
300 250 200 150 100 50 0
F0 F1 F2 F3 F4
Hyaluronic acid
H
A2 macroglobulin (mg/dL)
400
300
200
100
F0 F1 F2 F3 F4
a2-macroglobulin
MMP-2 (ng/mL)
500
400
300
200
100
F0 F1 F2 F3 F4
MMP-2
J
MMP-9 (ng/mL)
1,200 1,000 800 600 400 200 0
F0 F1 F2 F3 F4
MMP-9
K
TIMP-1 (ng/mL)
300
250
200
150
100 50
F0 F1 F2 F3 F4
TIMP-1
YKL-40 (ng/mL)
300 250 200 150 100 50 0
F0 F1 F2 F3 F4
YKL-40
ously reported fibrosis prediction models, the AUROCs of the PGAA index, FFI, APRI, and API were above 0.75 (0.75, 0.79, 0.76, and 0.77, respectively) for predicting F≥2. How- ever, the AUROCs of these predictive models were not sig- nificantly superior to those of single surrogate markers (Table 4). Subgroup analysis was performed in patients with chron- ic hepatitis B to exclude the effect of liver disease etiology, and the results were found to be similar to those seen in the whole series (Table 4). Briefly, hyaluronic acid, collagen IV, PGAA, FFI, APRI, and API were useful for the prediction of F≥2 (AUROCs: 0.80, 0.75, 0.81, 0.83, 0.76, and 0.77, respectively).
Uni- and multi-variate analyses for determining factors associated with significant fibrosis (≥F2)
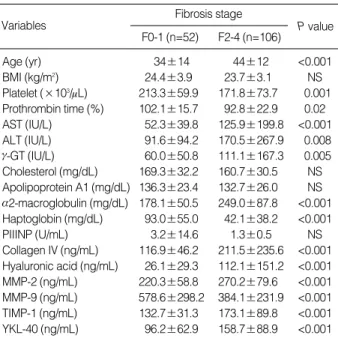
The results of univariate analysis for predicting liver fibro- sis stage ≥F2 are represented in Table 5. The markers show- ing a significant association with fibrosis stages F2-F4 were
age (P<0.001); platelet and PT (P<0.05); ALT, AST, and GGT (P<0.01); haptoglobin, MMP-9, hyaluronic acid, a2-macro- globulin, MMP-9, TIMP-1, and YKL-40 (P<0.001). On multivariate analysis, hyaluronic acid, a2-macroglobulin, and haptoglobin were independent predictive factors associated with significant fibrosis (≥F2) (Table 6).
Establishment of a new predictive model for detecting significant fibrosis (F≥2)
In order to establish a predictive model for detecting sig- nificant liver fibrosis, the independent predictive factors that were significant on multivariate analysis, including hyaluron- ic acid, a2-macroglobulin, and haptoglobin, were categorized into three groups according to their values. By providing ade- quate scores to each category of each factor in consideration of their respective predictive strengths on multivariate anal- ysis, we were able to establish a new predictive model for sig- nificant liver fibrosis, the AHH index (Table 7). AHH score is calculated by the sum of the scores of three variables.
The scores were significantly different between patients with F0-1 (3.2±1.8) and those with F2-4 (6.7±1.8; P<0.001)
AST, aspartate aminotransferase; ALT, alanine aminotransferase; g-GT, gamma-glutamyl transpeptidase; MMP, matrix metalloproteinase; PIIINP, procollagen III N-terminal peptide; TIMP, tissue inhibitor of metallopro- teinase; AAR, AST/ALT ratio; PGA composed of prothrombin time (PT), g-GT, and apolipoprotein A1; PGAA composed of PT, g-GT, apolipopro- tein A1, and a2-macroglobulin; FFI (Forns fibrosis index) composed of platelet count, g-GT, age, and cholesterol; APRI, AST-to-platelet ratio index; API, age platelet index; CDS (cirrhosis discriminant score) com- posed of platelet count, AST, ALT, PT INR.
Fibrosis score vs.
Bivariate Spearman’s rank
correlation coefficient P value
Age (yr) 0.38 <0.001
Platelet count (×103/mL) -0.46 <0.001
Prothrombin time (%) -0.42 <0.001
AST (IU/L) 0.17 NS
ALT (IU/L) -0.06 NS
g-GT (IU/L) 0.13 NS
Cholesterol (mg/dL) -0.15 NS
Apolipoprotein A1 (mg/dL) 0.002 NS
PIIINP (U/mL ) 0.29 0.001
Haptoglobin (mg/dL) -0.50 <0.001
Collagen IV (ng/mL) 0.55 <0.001
Hyaluronic acid (ng/mL) 0.56 <0.001
a2-macroglobulin (mg/dL) 0.45 <0.001
MMP-2 (ng/mL) 0.43 <0.001
MMP-9 (ng/mL) -0.39 <0.001
TIMP-1 (ng/mL) 0.22 0.006
YKL-40 (ng/mL) 0.42 <0.001
AAR 0.33 <0.001
PGA index 0.15 NS
PGAA index 0.37 <0.001
FFI 0.55 <0.001
APRI 0.36 <0.001
CDS 0.24 0.002
API 0.52 <0.001
Table 3. Correlations between various clinical variables and stage of liver fibrosis
AUROC, area under the receiver-operating characteristics curve; CI, confidence interval; AST, aspartate aminotransferase; ALT, alanine amino- transferase; g-GT, gamma-glutamyl transpeptidase; MMP, matrix met- alloproteinase; PIIINP, procollagen III N-terminal peptide; TIMP, tissue inhibitor of metalloproteinase; AAR, AST/ALT ratio; PGA composed of prothrombin time (PT), g-GT, and apolipoprotein A1; PGAA composed of PT, g-GT, apolipoprotein A1, and a2-macroglobulin; FFI (Forns fibro- sis index) composed of platelet count, g-GT, age, and cholesterol; APRI, AST-to-platelet ratio index; API, age platelet index; CDS (cirrhosis dis- criminant score) composed of platelet count, AST, ALT, PT INR.
In the whole series of patients
Markers In patients with
chronic hepatitis B Platelet 0.72 (0.64-0.80) 0.70 (0.59-0.81) Prothrombin time 0.67 (0.58-0.76) 0.66 (0.54-0.78) Haptoglobin 0.79 (0.72-0.87) 0.73 (0.62-0.84) a2-macroglobulin 0.75 (0.67-0.83) 0.70 (0.58-0.81) Apolipoprotein A1 0.54 (0.44-0.64) 0.37 (0.25-0.49) Hyaluronic acid 0.81 (0.74-0.89) 0.80 (0.70-0.90) Collagen IV 0.77 (0.69-0.85) 0.75 (0.64-0.86)
YKL-40 0.71 (0.62-0.79) 0.67 (0.56-0.78)
MMP-9 0.71 (0.63-0.80) 0.68 (0.57-0.80)
MMP-2 0.71 (0.62-0.79) 0.64 (0.53-0.76)
PIIINP 0.67 (0.58-0.77) 0.69 (0.57-0.81)
TIMP-1 0.63 (0.55-0.72) 0.61 (0.50-0.72)
AAR 0.62 (0.53-0.71) 0.56 (0.45-0.68)
PGA 0.62 (0.52-0.73) 0.70 (0.57-0.84)
PGAA 0.75 (0.66-0.84) 0.81 (0.70-0.91)
FFI 0.79 (0.72-0.88) 0.83 (0.73-0.92)
APRI 0.76 (0.68-0.84) 0.76 (0.66-0.87)
CDS 0.62 (0.53-0.71) 0.65 (0.53-0.77)
API 0.77 (0.69-0.85) 0.77 (0.67-0.86)
Table 4. AUROC (95% CI) of various markers or models in pre- dicting significant liver fibrosis (≥F2)
(Fig. 2). The AUROC for ≥F2 on the AHH index was 0.91 (95% confidence interval [CI], 0.85-0.96; P<0.001), which was significantly higher than that of single serum markers like hyaluronic acid, haptoglobin, collagen IV, and a2-macro- globulin, as well as those of previously-reported fibrosis pre- diction models like the PGAA index, FFI, APRI, and API.
Furthermore, the AHH index also showed relatively good
accuracy for predicting ≥F3 and F4 with AUROCs for ≥F3 and F4 of 0.82 (95% CI, 0.75-0.89) and 0.81 (95% CI, 0.73- 0.89), respectively. Predictive efficacies of the AHH index for detecting significant liver fibrosis (≥F2) with various cutoff values are shown in Table 8. Using the cutoff value of 5, the AHH index demonstrated an 89% sensitivity, 78%
specificity, 89% positive predictive value, and 78% nega- tive predictive value in predicting ≥F2. The ROC curve of the AHH index is presented in Fig. 3.
AST, aspartate aminotransferase; ALT, alanine aminotransferase; g-GT, gamma-glutamyl transpeptidase; PIIINP, procollagen III N-terminal pep- tide; MMP, matrix metalloproteinase; TIMP, tissue inhibitor of metallo- proteinase.
Fibrosis stage
P value F0-1 (n=52)
Variables
F2-4 (n=106)
Age (yr) 34±14 44±12 <0.001
BMI (kg/m2) 24.4±3.9 23.7±3.1 NS
Platelet (×103/mL) 213.3±59.9 171.8±73.7 0.001 Prothrombin time (%) 102.1±15.7 92.8±22.9 0.02 AST (IU/L) 52.3±39.8 125.9±199.8 <0.001
ALT (IU/L) 91.6±94.2 170.5±267.9 0.008
g-GT (IU/L) 60.0±50.8 111.1±167.3 0.005 Cholesterol (mg/dL) 169.3±32.2 160.7±30.5 NS Apolipoprotein A1 (mg/dL) 136.3±23.4 132.7±26.0 NS a2-macroglobulin (mg/dL) 178.1±50.5 249.0±87.8 <0.001 Haptoglobin (mg/dL) 93.0±55.0 42.1±38.2 <0.001
PIIINP (U/mL) 3.2±14.6 1.3±0.5 NS
Collagen IV (ng/mL) 116.9±46.2 211.5±235.6 <0.001 Hyaluronic acid (ng/mL) 26.1±29.3 112.1±151.2 <0.001 MMP-2 (ng/mL) 220.3±58.8 270.2±79.6 <0.001 MMP-9 (ng/mL) 578.6±298.2 384.1±231.9 <0.001 TIMP-1 (ng/mL) 132.7±31.3 173.1±89.8 <0.001 YKL-40 (ng/mL) 96.2±62.9 158.7±88.9 <0.001 Table 5. Univariate analysis for the variables associated with sig- nificant liver fibrosis (≥F2)
Regression coefficient
Odds
ratio 95% CI for P value odds ratio
Hyaluronic acid 0.033 1.033 0.964-0.995 0.017 (ng/mL)
a2-macroglobulin 0.017 1.017 1.006-1.061 0.002 (mg/dL)
Haptoglobin -0.025 0.976 0.962-0.990 0.001
(mg/dL)
Table 6. Multiple logistic regression analysis for the variables showing an independent relationship with significant liver fibrosis
AHH score is the sum of the scores of three variables.
Scores Variables
a2-macroglobulin (mg/dL) ≤150=0 151-250=1 >250=3 Hyaluronic acid (ng/mL) ≤15=0 16-60=2 >60=3 Haptoglobin (mg/dL) ≤45=3 46-100=2 >100=0 Table 7. New scoring system (AHH index) for the prediction of significant liver fibrosis
PPV, positive predictive value; NPV, negative predictive value.
Sensitivity (%)
Specificity (%)
PPV (%)
NPV AHH (%)
≥3 98.9 39.1 76.1 94.7
≥5 88.9 78.3 88.9 78.3
≥6 75.6 91.3 94.4 65.6
≥8 37.8 97.8 97.1 44.6
Table 8. Diagnostic accuracy of AHH in predicting significant liver fibrosis using various cutoff values
Fig. 2. AHH index according to significant liver fibrosis.
AHH index
8 7 6 5 4 3 2 1
0 F0-1 F2-4
P <0.001
Fig. 3. ROC curve of the AHH index for the prediction of signifi- cant liver fibrosis: F0-1 vs. F2-4.
Sensitivity
1.0
0.8
0.6
0.4
0.2
0.00.0 0.2 0.4 0.6 0.8 1.0
1-specificity Variables
DISCUSSION
In the management of chronic liver disease, it is clinically important to assess the progression of liver fibrosis. Further- more, with recent improvements in treatment modalities for chronic liver disease, there is an increasing need for accurate noninvasive methods, such as surrogate blood markers, which enable repetitive measurement of the degree of liver fibrosis.
In order for these blood markers to be utilized as accurate pre- dictors of the degree of liver fibrosis, 1) they should reflect the specific changes in the liver during the progression of fibro- sis, 2) they should be sensitive both to fibrogenesis and fibrol- ysis, 3) their metabolic pathways should be defined, and their blood levels and half-life should not be influenced by the func- tion of the liver, kidney, or reticuloendothelial system, and 4) they should be easily measured. However, it is not easy to find a marker that fulfills all these criteria (18, 19).
Liver fibrosis results from accumulation of ECM as a conse- quence of chronic liver injury, leading to architectural changes in the liver parenchyma that eventually cause liver dysfunc- tion and portal hypertension. Therefore, both direct markers, such as components of ECM itself or factors that are involved in the synthesis or degradation of ECM, and indirect mark- ers influenced by liver injury, altered liver function, or por- tal hypertension are all potential markers for predicting the stages of liver fibrosis. For examples, as indirect markers, AST, ALT, and g-GT reflect liver injury; prothrombin time, choles- terol, haptoglobin, and a2-macroglobulin reflect altered liver function caused by architectural changes; platelet counts are closely related with portal hypertension. Collagen, glycopro- tein, and proteoglycan, which are components of the ECM, have drawn attention as potential direct markers. Accumula- tion of these ECM components could be caused not only by an increase in their synthesis, but also by a decrease in their degradation, which might be caused by over-stimulation of the expression of tissue inhibitor of metalloproteinase (26, 27).
Most studies related to blood markers predicting liver fibro- sis have been performed in Western patients with chronic hepatitis C, and it is unknown if their findings can be applied directly to the Asian people. Furthermore, most previous stud- ies have focused on 1 or 2 potential markers predictive of liver fibrosis. Thus, few large comparative studies investigating the majority of these direct and indirect fibrosis markers have been performed. In this study, we included most previously- known direct or indirect potential markers of liver fibrosis and tried to determine if they could also be used in Korean patients, in whom chronic hepatitis B is the main cause of chronic liver disease.
We found that various direct and indirect blood markers known as useful predictors of liver fibrosis in previous West- ern studies were also valuable in Korean patients. In partic- ular, a2-macroglobulin, haptoglobin, and hyaluronic acid were independent factors predictive of significant liver fibro- sis on multivariate regression analysis. a2-macroglobulin and
haptoglobin, the two major components of a2-globulin, are synthesized in hepatocytes, but a2-macroglobulin is also syn- thesized in hepatic stellate cells. Generally, a2-macroglobu- lin is an acute-phase protein, and its synthesis increases with the activation of hepatic stellate cells in inflammatory con- dition and may precipitate liver fibrosis via its inhibition of collagenase (1). Previous studies have already reported that haptoglobin has a negative correlation with the progression of liver fibrosis independent of hemolysis, hypersplenism, or liver failure (16, 28). It has also been suggested that hapto- globin might be related to the growth factors that vary with the progression of liver fibrosis (16). In the present study, hyaluronic acid showed the highest AUROC for predicting
≥F2 among the various single fibrosis markers studied, and its AUROC was superior to those of pre-existing liver fibrosis prediction models such as PGAA, FFI, APRI, and API. The increase in hyaluronic acid in chronic liver disease is caused by increased synthesis by hepatic stellate cells and by a decrease in uptake and degradation by sinusoidal cells. Our results were consistent with previous reports suggesting the usefulness of hyaluronic acid as a liver fibrosis marker (29, 30).
Finally, we constructed the AHH index for the prediction of significant fibrosis with these three independent predic- tive markers: a2-macroglobulin, haptoglobin, and hyaluron- ic acid. The AUROC for predicting ≥F2 of the AHH index was 0.91, which is superior to the AUROCs of the PGA in- dex, PGAA index, FFI, APRI, and API. These results sug- gest that the AHH index could be a good model for predict- ing significant fibrosis in Korean patients with chronic liver disease. Further validation studies are needed to evaluate the predictive efficacy of the AHH index.
In conclusion, a2-macroglobulin, haptoglobin, and hya- luronic acid were independent factors for predicting signifi- cant liver fibrosis in our patients with chronic liver disease.
These markers enabled us to establish a new predictive model useful for detecting significant liver fibrosis.
REFERENCES
1. Naveau S, Poynard T, Benattar C, Bedossa P, Chaput JC. Alpha-2- macroglobulin and hepatic fibrosis. Diagnostic interest. Dig Dis Sci 1994; 39: 2426-32.
2. Dienstag JL. The role of liver biopsy in chronic hepatitis C. Hepa- tology 2002; 36 (5 Suppl 1): S152-60.
3. Cadranel JF, Rufat P, Degos F. Practices of liver biopsy in France:
results of a prospective nationwide survey. For the Group of Epidemi- ology of the French Association for the Study of the Liver (AFEF).
Hepatology 2000; 32: 477-81.
4. Bravo AA, Sheth SG, Chopra S. Liver biopsy. N Engl J Med 2001;
344: 495-500.
5. Colloredo G, Guido M, Sonzogni A, Leandro G. Impact of liver biop- sy size on histological evaluation of chronic viral hepatitis: the smaller the sample, the milder the disease. J Hepatol 2003; 39: 239-44.
6. Bedossa P, Dargere D, Paradis V. Sampling variability of liver fibro- sis in chronic hepatitis C. Hepatology 2003; 38: 1449-57.
7. Siddique I, El-Naga HA, Madda JP, Memon A, Hasan F. Sampling variability on percutaneous liver biopsy in patients with chronic hep- atitis C virus infection. Scand J Gastroenterol 2003; 38: 427-32.
8. Maharaj B, Maharaj RJ, Leary WP, Cooppan RM, Naran AD, Pirie D, Pudifin DJ. Sampling variability and its influence on the diagnos- tic yield of percutaneous needle biopsy of the liver. Lancet 1986; 1:
523-5.
9. Regev A, Berho M, Jeffers LJ, Milikowski C, Molina EG, Pyrsopou- los NT, Feng ZZ, Reddy KR, Schiff ER. Sampling error and intraob- server variation in liver biopsy in patients with chronic HCV infec- tion. Am J Gastroenterol 2002; 97: 2614-8.
10. Intraobserver and interobserver variations in liver biopsy interpre- tation in patients with chronic hepatitis C. The French METAVIR Cooperative Study Group. Hepatology 1994; 20: 15-20.
11. Afdhal NH. Diagnosing fibrosis in hepatitis C: is the pendulum swing- ing from biopsy to blood tests? Hepatology 2003; 37: 972-4.
12. Saadeh S, Cammell G, Carey WD, Younossi Z, Barnes D, Easley K. The role of liver biopsy in chronic hepatitis C. Hepatology 2001;
33: 196-200.
13. Giannini E, Risso D, Botta F, Chiarbonello B, Fasoli A, Malfatti F, Romagnoli P, Testa E, Ceppa P, Testa R. Validity and clinical utili- ty of the aspartate aminotransferase-alanine aminotransferase ratio in assessing disease severity and prognosis in patients with hepatitis C virus-related chronic liver disease. Arch Intern Med 2003; 163:
218-24.
14. Williams AL, Hoofnagle JH. Ratio of serum aspartate to alanine aminotransferase in chronic hepatitis. Relationship to cirrhosis. Gas- troenterology 1988; 95: 734-9.
15. Imbert-Bismut F, Ratziu V, Pieroni L, Charlotte F, Benhamou Y, Poynard T; MULTIVIRC Group. Biochemical markers of liver fibro- sis in patients with hepatitis C virus infection: a prospective study.
Lancet 2001; 357: 1069-75.
16. Forns X, Ampurdanes S, Llovet JM, Aponte J, Quinto L, Martinez- Bauer E, Bruguera M, Sanchez-Tapias JM, Rodes J. Identification of chronic hepatitis C patients without hepatic fibrosis by a simple predictive model. Hepatology 2002; 36: 986-92.
17. Wai CT, Greenson JK, Fontana RJ, Kalbfleisch JD, Marrero JA, Con- jeevaram HS, Lok AS. A simple noninvasive index can predict both significant fibrosis and cirrhosis in patients with chronic hepatitis C. Hepatology 2003; 38: 518-26.
18. Afdhal NH, Nunes D. Evaluation of liver fibrosis: a concise review.
Am J Gastroenterol 2004; 99: 1160-74.
19. Pinzani M, Rombouts K, Colagrande S. Fibrosis in chronic liver dis- eases: diagnosis and management. J Hepatol 2005; 42 (Suppl): S22- 36.
20. Imperiale TF, Said AT, Cummings OW, Born LJ. Need for validation of clinical decision aids: use of the AST/ALT ratio in predicting cirrho- sis in chronic hepatitis C. Am J Gastroenterol 2000; 95: 2328-32.
21. Poynard T, Aubert A, Bedossa P, Abella A, Naveau S, Paraf F, Cha- put JC. A simple biological index for detection of alcoholic liver dis- ease in drinkers. Gastroenterology 1991; 100: 1397-402.
22. Poynard T, Bedossa P. Age and platelet count: a simple index for pre- dicting the presence of histological lesions in patients with antibod- ies to hepatitis C virus. METAVIR and CLINIVIR Cooperative Study Groups. J Viral Hepat 1997; 4: 199-208.
23. Bonacini M, Hadi G, Govindarajan S, Lindsay KL. Utility of a dis- criminant score for diagnosing advanced fibrosis or cirrhosis in pa- tients with chronic hepatitis C virus infection. Am J Gastroenterol 1997; 92: 1302-4.
24. Batts KP, Ludwig J. Chronic hepatitis. An update on terminology and reporting. Am J Surg Pathol 1995; 19: 1409-17.
25. Hanley JA, McNeil BJ. A method of comparing the areas under re- ceiver operating characteristic curves derived from the same cases.
Radiology 1983; 148: 839-43.
26. Schuppan D, Ruehl M, Somasundaram R, Hahn EG. Matrix as a mod- ulator of hepatic fibrogenesis. Semin Liver Dis 2001; 21: 351-72.
27. Arthur MJ. Fibrogenesis II. Metalloproteinases and their inhibitors in liver fibrosis. Am J Physiol Gastrointest Liver Physiol 2000; 279:
G245-9.
28. Bacq Y, Schillio Y, Brechot JF, De Muret A, Dubois F, Metman EH.
Decrease of haptoglobin serum level in patients with chronic viral hepatitis C. Gastroenterol Clin Biol 1993; 17: 364-9.
29. Oberti F, Valsesia E, Pilette C, Rousselet MC, Bedossa P, Aube C, Gallois Y, Rifflet H, Maiga MY, Penneau-Fontbonne D, Cales P.
Noninvasive diagnosis of hepatic fibrosis or cirrhosis. Gastroenterol- ogy 1997; 113: 1609-16.
30. Guechot J, Laudat A, Loria A, Serfaty L, Poupon R, Giboudeau J.
Diagnostic accuracy of hyaluronan and type III procollagen amino- terminal peptide serum assays as markers of liver fibrosis in chron- ic viral hepatitis C evaluated by ROC curve analysis. Clin Chem 1996; 42: 558-63.