Different Response of Body Weight Change According to Ketonuria after Fasting in the Healthy Obese
The relationship between obesity and ketonuria is not well-established. We conducted a retrospective observational study to evaluate whether their body weight reduction response differed by the presence of ketonuria after fasting in the healthy obese. We used the data of 42 subjects, who had medical records of initial urinalysis at routine health check-up and follow-up urinalysis in the out-patient clinic, one week later. All subjects in the initial urinalysis showed no ketonuria. However, according to the follow-up urinalysis after three subsequent meals fasts, the patients were divided into a non-ketonuria group and ketonuria group. We compared the data of conventional low-calorie diet programs for 3 months for both groups. Significantly greater reduction of body weight (-8.6 ± 3.6 kg vs -1.1 ± 2.2 kg, P < 0.001), body mass index (-3.16 ± 1.25 kg/m2 vs -0.43 ± 0.86 kg/m2, P < 0.001) and waist circumference (-6.92 ± 1.22 vs -2.32 ± 1.01, P < 0.001) was observed in the ketonuria group compared to the non-ketonuria group. Fat mass and lean body mass were also more reduced in the ketonuria group. In addition, serum free fatty acid concentration after intervention in the ketonuria group showed significant more increment than in the non-ketonuria group. The presence of ketonuria after fasting may be a predicting factor of further body weight reduction.
Key Words: Ketonuria; Body Weight; Fasting Hyeon-Jeong Kim1, Nam-Seok Joo1,
Kwang-Min Kim1, Duck-Joo Lee1, and Sang-Man Kim2
1Department of Family Practice and Community Health, Ajou University School of Medicine, Suwon;
2Department of Family Medicine, CHA Biomedical Center, CHA University College of Medicine, Seoul, Korea
Received: 20 August 2011 Accepted: 17 January 2012 Address for Correspondence:
Sang-Man Kim, MD
Department of Family Medicine, CHA Biomedical Center, CHA University College of Medicine, 407 Nonhyeon-ro, Gangnam-gu, Seoul 135-913, Korea
Tel: +82.2-3468-3656, Fax: +82.31-219-5218 E-mail: [email protected]
http://dx.doi.org/10.3346/jkms.2012.27.3.250 • J Korean Med Sci 2012; 27: 250-254
INTRODUCTION
For the last few decades, the global population of obese people has been increasing exponentially. According to 2008 data from the World Health Organization (WHO), the number of over- weight adults exceeds 1.5 billion and obese adults are estimat- ed to exceed 500 million. Obesity is the main cause of several chronic diseases such as diabetes, hypertension, hyperlipid- emia, and coronary artery disease (1). Obesity may cause such chronic diseases because of leptin resistance (2, 3), reduced ad- iponectin secretion (4-6), chronic inflammation (7), insulin re- sistance (8), and mitochondrial dysfunction (9).
The relationship between obesity and ketone is unknown.
When the body lacks carbohydrates or protein, energy comes from lipolysis. Ketone is formed during lipolysis, which can then cause ketonemia or ketonuria. By this mechanism, a very low- calorie diet elevates the serum ketone level (10, 11). A study of overweight adults showed that a ketogenic low-carbohydrate diet can produce greater weight loss than low-fat diet, and that a ketogenic low-carbohydrate diet promotes a greater degree of decreased triglyceride level, increased high-density lipoprotein (HDL) cholesterol level than a low-fat diet (12). Another study reported that a ketogenic diet promotes a non-atherogenic lipid
profile as well as weight loss, lower blood pressure, and dimin- ished resistance to insulin with an improvement in blood levels of glucose and insulin. Also it has anti-neoplastic benefits (13).
In a previous study, an obese group of individuals displayed more resistance in formation of ketones than normal weight group. In the study, which was conducted during the Muslim fasting period, ketosis was induced in the normal weight group after 3-6 days, whereas ketosis in the obese group was not in- duced after 20 days (14). Another study showed that, after a ke- togenic diet, a normal weight group had increased blood ketone level after 2-3 days, whereas an obese group showed little or no difference after 10 days (15). In another study, even though ke- tonuria was observed during several weeks, ketonemia-induced symptoms such as headache, loss of appetite, and nausea were not found in obese subjects (16).
We conducted a retrospective observational study to evalu- ate whether the body weight reduction response was different by the presence of ketonuria after fasting in the healthy obese.
MATERIALS AND METHODS Study data
In this retrospective observational study, medical records were
reviewed for the healthy obese patients (body mass index, BMI,
≥ 25 kg/m2) who had participated in a 3-month conventional low-calorie diet program on an out-patient basis, after a routine health check-up conducted from January-December, 2008, at a health promotion center in one university hospital in Suwon, Gyeonggi-do, Republic of Korea. Forty two healthy obese sub- jects aged in their 20s to their 50s who initially had non-ketonu- ria at the routine health check-up were selected. In the out-pa- tient clinic, one week later, the presence of urinary ketone was retested after three subsequent fasts. Subjects’ data were exclud- ed any medical history such as hypertension, type 2 diabetes, cor- onary artery diseases, cerebral artery diseases, and any cancer.
Anthropometry and laboratory measurements
We reviewed medical record such as laboratory data and self- administered questionnaire of study subjects. Among the initial measurement data of routine health check-up, we selected the anthropometry data and several metabolic parameters such as weight, waist circumference, BMI, and body composition param- eters such as lean body mass and fat mass using Bio-impedance analysis, blood pressure, fasting blood sugar, triglycerides, HDL cholesterol, and total cholesterol using venous blood and urine drawn following an 8-hr overnight fast. As well, subjects com- pleted a self-administered questionnaire soliciting information on their history of drinking and smoking. The height and weight were measured with a test gown on using an automatic height- weight meter; results were 0.1 cm and 0.1 kg, respectively. BMI was calculated as weight (kg)/height (m)2. Waist circumference was measured in a straight standing posture with the feet 25-30 cm spacing, distributing the weight evenly on both feet, at the mid- dle point of lower rib and iliac crest to 0.1 cm. The brachial artery blood pressure was measured after at least 15 min of sitting in a chair in a stable condition, using an electronic sphygmomanom- eter (PMS Instruments, Tokyo, Japan) and, in the case of abnor- mal blood pressure level, the blood pressure was measured again after 10 min rest. In the laboratory data, we compared free fatty acid and insulin concentration before and after intervention to indirectly evaluate the difference of fat oxidation. Unfortunately, there were limitations of data on the routine laboratory exami- nation after intervention such as fasting glucose, lipid concen- tration. After 3 months of a conventional low-calorie diet pro- gram conducted in an out-patient clinic, anthropometry was measured again. Body Impedance analyzer 7.0 (Biospace, Seoul, Korea) was used for body composition analysis. Triglycerides, HDL cholesterol, and fasting blood glucose test was measured using a TBA-200FR automatic blood analyzer (Toshiba, Tokyo, Japan). Obese was defined as BMI ≥ 25 kg/m2, following the guidelines of the Korean Society of Study of Obesity in 2006 (17).
We conducted a conventional low-caloric diet program in all subjects. The weight reduction program was composed of be- havior modification, exercise, and nutritional education. We
encouraged the subjects to increase their daily activity and prac- tice any kind of exercise they liked for at least 30 min per day and more than three or four times a week. Each individual under- went an initial nutrition assessment by an investigator, who ed- ucated the subjects about eating a low-calorie diet which would produce a 400-500 kcal daily energy deficit. We prescribed indi- vidually the amounts and types of food. The behavior modifica- tion program encouraged an increase in caloric expenditure while reducing intake, with an emphasis on long-term behavior change.
Measurement of ketonuria
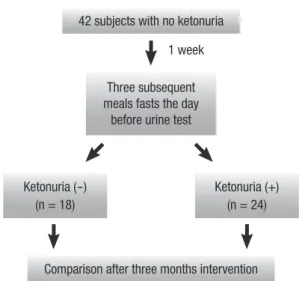
Since all those patients showed no ketonuria in routine health check-ups, we educated patient to fast three subsequent meals the day before urinalysis (one week after the initial check-up) to evaluate the urinary ketonuria (Fig. 1). All patients tolerated the subsequent three meals fasts well with no serious side effects, except for mild general weakness associated with the fasts were observed. The presence of ketonuria was determined using US- 3100R urine test paper (Eiken Chemical, Tokyo, Japan). Ketonu- ria was categorized into four classes: 0, 1+ (10 mg/dL), 2+ (30 mg/dL), 3+ (80 mg/dL). For this study, the results are shown only as qualitative positive state, not blood ketone level.
Statistical analysis
The data was classified into two groups depending on the change of ketonuria state: ketonuria group and non-ketonuria group.
The general characteristics were expressed as mean ± standard deviation, and as variable distribution was observed to be nor- mal, the difference between two groups was compared using parametric methods of independent t test. For analyzing the re- sult, SPSS ver.11.5 (SPSS Ltd., Chicago, IL, USA) was used. All significant P values were < 0.05.
Fig. 1. Evaluation of ketonuria after initial health check-ups.
42 subjects with no ketonuria
Comparison after three months intervention Three subsequent
meals fasts the day before urine test
Ketonuria (-) (n = 18)
Ketonuria (+) (n = 24) 1 week
Ethics statement
The institutional review board of Ajou University Hospital ap- proved this study and waived informed consent (AJIRB-MED- OBS-09-147).
RESULTS
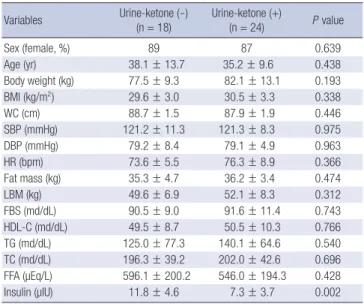
Comparison of clinical characteristic between two groups according to the change of ketonuria after one week The 42 subjects were divided into two groups according to the presence of ketonuria after one week: a ketonuria group (n = 18, average age 38.1 ± 13.7 yr), which progressed from non-keto- nuria to ketonuria during that time, and a non-ketonuria group (n = 24, average age 35.2 ± 9.6 yr), which displayed persistent non-ketonuria. Compared to the clinical characteristics of the patients at baseline, the two groups showed no statistically sig- nificant differences in sex, weight, BMI, waist circumference, blood pressure, heart rate, body fat mass, lean body mass, fast- ing blood glucose, HDL cholesterol, triglycerides and total cho- lesterol. In case of free fatty acid (FFA) and insulin concentra- tion before intervention, FFA concentration showed no differ- ence between the two groups (596.1 ± 200.2 μEq/L vs 546.0 ± 194.3 μEq/L, P = 0.428), however, insulin concentration was lower in the ketonuria group than in the non-ketonuria group (11.8 ± 4.6 μIU vs 7.3 ± 3.7 μIU, P = 0.002) (Table 1).
Comparison of anthropometric changes between the groups after three-month obesity control program
After three months, comparisons of the ketonuria group with
the non-ketonuria group demonstrated significantly greater re- ductions in body weight (-8.6 ± 3.6 kg vs -1.1 ± 2.2 kg, P < 0.001), waist circumference (-6.92 ± 1.22 vs -2.32 ± 1.01, P < 0.001), fat mass (-2.99 ± 2.17 kg vs 0.35 ± 2.70 kg, P < 0.001), and BMI (-3.16 ± 1.25 kg/m2 vs -0.43 ± 0.86 kg/m2, P < 0.001), and lean body mass (-3.06 ± 2.76 kg vs 0.02 ± 1.77 kg, P < 0.001) (Table 2).
The increase of serum FFA concentration was remarkable in the ketonuria group than in the non-ketonuria group (576.9 ± 390.0 μEq/L vs 13.6 ± 172.3 μEq/L, P < 0.001). In case of serum insu- lin concentration, the decrease showed no difference between both groups (-2.95 ± 3.12 μIU vs -2.94 ± 3.17 μIU, P = 0.994). Un- fortunately, laboratory follow-up data were not obtained in all subjects such as fasting blood glucose and lipid concentration, therefore, we could not compare the simple metabolic parame- ters between the two groups. However, the changes of all labo- ratory data we reviewed were favorable in the ketonuria group compared to the non-ketonuria group, even though limited laboratory data.
DISCUSSION
We previously reported that individuals displaying ketonuria after fasting have metabolic superiority over those without keto- nuria (18). In that study, the ketonuria group had a lower pro- portion of obesity, central obesity, or metabolic syndrome; low- er weight, waist circumference, fasting blood glucose, triglycer- ides, blood pressure and insulin; and higher HDL cholesterol.
But, the study was limited by its cross-sectional nature, which made difficulty of causality. To overcome this limitation, we pres- ently analyzed the clinical data conducted in an out-patient clinic during a 3-month obesity intervention program by retrospec- tive observation. Especially, we targeted healthy obese subjects without ketonuria at baseline, comparing the changes of body weight and body composition after the 3-month program ac- cording to the presence of ketonuria. Body weight, body fat, and waist circumference were all reduced more in the ketonuria Table 1. Baseline characteristics of the study subjects
Variables Urine-ketone (-)
(n = 18) Urine-ketone (+)
(n = 24) P value
Sex (female, %) 89 87 0.639
Age (yr) 38.1 ± 13.7 35.2 ± 9.6 0.438
Body weight (kg) 77.5 ± 9.3 82.1 ± 13.1 0.193
BMI (kg/m2) 29.6 ± 3.0 30.5 ± 3.3 0.338
WC (cm) 88.7 ± 1.5 87.9 ± 1.9 0.446
SBP (mmHg) 121.2 ± 11.3 121.3 ± 8.3 0.975
DBP (mmHg) 79.2 ± 8.4 79.1 ± 4.9 0.963
HR (bpm) 73.6 ± 5.5 76.3 ± 8.9 0.366
Fat mass (kg) 35.3 ± 4.7 36.2 ± 3.4 0.474
LBM (kg) 49.6 ± 6.9 52.1 ± 8.3 0.312
FBS (md/dL) 90.5 ± 9.0 91.6 ± 11.4 0.743
HDL-C (md/dL) 49.5 ± 8.7 50.5 ± 10.3 0.766
TG (md/dL) 125.0 ± 77.3 140.1 ± 64.6 0.540
TC (md/dL) 196.3 ± 39.2 202.0 ± 42.6 0.696
FFA (µEq/L) 596.1 ± 200.2 546.0 ± 194.3 0.428
Insulin (µIU) 11.8 ± 4.6 7.3 ± 3.7 0.002
P value was calculated by independent t test. Urine Ketone (-), ketone (-) at initial urine test and ketone (-) at retest 1 week later; Urine Ketone (+), ketone (-) at initial urine test and ketone (+) at retest 1 week later. BMI, body mass index; WC, waist circum- ference; SBP, systolic blood pressure; DBP, diastolic blood pressure; HR, heart rate; bpm, beat per minute; LBM, lean body mass; FBS, fasting blood sugar; HDL-C, high-densi- ty lipoprotein cholesterol; TG, triglyceride; TC, total cholesterol; FFA, free fatty acid.
Table 2. Comparison of anthropometric changes between ketonuria group and non- ketonuria group after 3 months of an obesity control program application
Variables
Changes after 3 months Urine-ketone (-)
(n = 18) Urine-ketone (+)
(n = 24) P value Δ Weight (kg) -1.17 ± 2.22 -8.65 ± 3.69 < 0.001 Δ BMI (kg/m2) -0.43 ± 0.86 -3.16 ± 1.25 < 0.001
Δ WC (cm) -2.32 ± 1.01 -6.92 ± 1.22 < 0.001
Δ Fat mass (kg) 0.35 ± 2.70 -2.99 ± 2.17 < 0.001
Δ LBM (kg) 0.02 ± 1.77 -3.06 ± 2.76 < 0.001
Δ FFA (µEq/L) 13.6 ± 172.3 576.9 ± 390.0 < 0.001
Δ Insulin (µIU) -2.95 ± 3.12 -2.94 ± 3.17 0.994
All values were mean ± standard deviation. P values was calculated by independent t test. Ketone (-), ketone (-) at initial urine test and ketone (-) at retest 1 week later;
Ketone (+), ketone (-) at initial urine test and ketone (+) at retest 1 week later. BMI, body mass index; LBM, lean body mass; FFA, free fatty acid.
group than in the non-ketonuria group after three subsequent fasting periods, although no ketonuria was evident at baseline in any subject. In addition, the increase of serum free fatty acid concentration in the ketonuria group after intervention, which indicated increased fat oxidation indirectly, was more remark- able than in the non-ketonuria group. Serum insulin concen- tration was lower in the ketonuria group than in the non-keto- nuria group at baseline. However, the reduction after interven- tion showed no difference between the two groups.
Ketone body is a general term for three substances (acetoac- etate, β-hydroxybutylic acid, and acetone) produced by decar- boxylation. Ketone bodies are produced in the liver by oxida- tion of fatty acids and are transported to extra-hepatic tissues in the blood to provide energy. Ketone bodies can be measured in the blood and urine. Increased concentration can occur in cir- cumstances including starvation, long-term strenuous exercise, or uncontrolled diabetes. Yet, virtually nothing is known of the relationship between ketone and obesity.
To date, many studies have investigated the influence of keto- genic diets on weight loss and metabolism. A meta-analysis of 447 patients indicated that a low-carbohydrate diet produced a statistically significant loss of weight compared to a low-fat diet (19). When weight change in 311 overweight/obese premeno- pausal women after 12 months was compared according to diet type, the greatest weight loss was associated with a low-carbo- hydrate high-fat diet (20). In another study involving five patients with non-alcoholic fatty liver who consumed a low-carbohydrate, ketogenic diet, four displayed improved histological fat degen- eration, inflammation, and degree of fibrosis after 3 months (21).
In another study, a low-carbohydrate diet produced a more fa- vorable effect in controlling lipid and blood glucose level than a low-fat diet (22). A plethora of other studies have yielded con- sistent findings, yet how ketone bodies induce weight loss and a beneficial metabolic effect remain unknown. Considering that ketone is not produced as well in obese subjects than in normal- weight subjects (14, 15), the role of fat oxidation should be sus- pected in obese individuals. Furthermore, ketone formation af- ter fasting would be expected to reflect a metabolically superior state, in which oxidation and decomposition of fat are achieved more easily. However, a 2008 study involving 16,523 patients who received a physical examination at one center in the year report- ed that only 8.8% displayed ketone formation after fasting. Con- sidering this result, it is difficult to generally consider that the metabolic state of the body is a normal reaction to ketone for- mation after fasting.
Insulin can stimulate the storage of free fatty acid into fat tis- sue via lipoprotein lipase by positive energy balance. Therefore, serum insulin and free fatty acid concentration have a negative correlation and the same pattern was also observed in our study.
Lower concentration of serum insulin in the ketonuria group at baseline may indicate reduced fatty acid synthesis and storage
in the ketonuria group. Reduction of serum insulin concentra- tion after intervention, which was not different between the two groups, in addition to the increased serum fatty acid concentra- tion in the ketonuria group can explain more increase of fat oxi- dation than in the non-ketonuria group. Although serum ketone body formation, which we did not measure, and the presence of ketonuria after fasting may induce weight loss, we noticed that the presence of ketonuria after fasting in the healthy obese subjects may be an independent factor for the response of more reduction of body weight. For the control of body weight, the reduction of body fat, not muscle mass, is essential. Therefore, most studies have focused on the reduction of body fat and the increase of fat oxidation may be a core of the issues. To increase fat oxidation, they believe that their efforts are vital to burn more fats, many obese subjects are trying to modulate their diet, espe- cially ketogenic diet, and increase daily physical activity and do regular exercise. Following our study results, in the healthy obese subjects with ketonuria after several subsequent meals fasting, fat oxidation can be easily obtained and their body weight can be reduced more efficiently. Therefore, in the clinical field, the evaluation of ketonuria in the healthy obese subjects is an essen- tial check-up point and may be a good indicator of good response of body weight reduction. Furthermore, regular assessment of the presence of ketonuria in the middle of body weight control program to evaluate fat oxidation indirectly can be a useful tool for the enhancement of fat oxidation in the body weight reduc- tion program.
Our retrospective study has some limitations. The weakest point is the lack of direct fat oxidation measurement. And also we did not measure respiratory quotient (RQ) and ketone was measured through a urine test and the result was consequently confirmed only as a qualitative measure. Quantitative testing of blood test would have been able to elaborate on the correlations much better. Another is the small sample size, mainly female, which makes it hard to generalize the results and the study was only 3 months; a short-term study can show different results from long-term studies. Although all the subjects were educated to fast three subsequent meals prior to the urine test, adherence was self-verified, and so the accuracy of the fasting state might have been compromised. However, despite of these limitations, our study has the strength of a retrospective observation design, and the results of the body weight reduction according to chang- es of ketonuria after fasting in the healthy obese are valuable.
In conclusion, different body weight changes are evident in subjects with ketonuria after fasting in the healthy obese sub- jects, displaying more body weight reduction than non-ketonu- ria subjects.
REFERENCES
1. Haslam DW, James WP. Obesity. Lancet 2005; 366: 1197-209.
2. Münzberg H, Björnholm M, Bates SH, Myers MG Jr. Leptin receptor ac- tion and mechanism of leptin resistance. Cell Mol life Sci 2005; 62: 642-52.
3. Van Heek M, Compton DS, France CF, Tedesco RP, Fawzi AB, Graziano MP, Sybertz EJ, Strader CD, Davis HR Jr. Diet-induced obese mice develop peripheral, but not central, resistance to leptin. J Clin Invest 1997; 99:
385-90.
4. Miyoshi Y, Funahashi T, Kihara S, Taguchi T, Tamaki Y, Matsuzawa Y, Noguchi S. Association of serum adiponectin levels with breast cancer risk. Clin Cancer Res 2003; 9: 5699-704.
5. Matsuzawa Y, Funahashi T, Nakamura T. Molecular mechanism of met- abolic syndrome X: contribution of adipocytokines adipocyte-derived bioactive substances. Ann N Y Acad Sci 1999; 892: 146-54.
6. Ishikawa M, Kitayama J, Kazama S, Hiramatsu T, Hatano K, Nagawa H.
Plasma adiponectin and gastric cancer. Clin Cancer Res 2005; 11: 466-72.
7. Fantuzzi G. Adipose tissue, adipokines, and inflammation. J Allergy Clin Immunol 2005; 115: 911-9.
8. Succurro E, Marini MA, Frontoni S, Hirbal ML, Andreozzi F, Lauro R, Perticone F, Sesti G. Insulin secretion in metabolically obese, but normal weight in metabolically healthy but obese individuals. Obesity (Silver Spring) 2008; 16: 1881-6.
9. Gianotti TF, Sookoian S, Dieuzeide G, Garcia SI, Gemma C, González CD, Pirola CJ. A decreased mitochondrial DNA content is related to insulin resistance in adolescents. Obesity (Silver Spring) 2008; 16: 1591-5.
10. Beisswenger BG, Delucia EM, Lapoint N, Sanford GJ, Beisswenger PJ.
Ketosis leads to increased methylglyoxal production on the Atkins diet.
Ann NY Acad Sci 2005; 1043: 201-10.
11. Musa-Veloso K, Likhodii SS, Cunnane SC. Breath acetone is a reliable indicator of ketosis in adults consuming ketogenic meals. Am J Clin Nutr 2002; 76: 65-70.
12. Yancy WS Jr, Olsen MK, Guyton JR, Bakst RP, Westman EC. A low-carbo- hydrate, ketogenic diet versus a low-fat diet to treat obesity and hyperlip- idemi: a randomized, controlled trial. Ann Intern Med 2004; 140: 769-77.
13. Pérez-guisado J. Ketogenic diets: additional benefits to the weight loss and unfounded secondary effects. Arch Latinoam Nutr 2008; 58: 323-9.
14. Mohammadiha H. Resistance to ketonuria and ketosis in obese subjects.
Am J Clin Nutr 1974; 27: 1212-3.
15. Kekwick A, Pawan GL, Chalmers TM. Resistance to ketosis in obese sub- jects. Lancet 1959; 2: 1157-9.
16. Thomson TJ, Runcie J, Miller V. Treatment of obesity by total fasting for up to 249 days. Lancet 1966; 2: 992-6.
17. The Asia-Pacific perspective: redefining obesity and its treatment. Mel- bourne: International Diabetes Institute; 2000 Feb. Regional Office for the Western Pacific (WPRO), World Health Organization, the International Association for the Study of Obesity, and the International Obesity Task Force.
18. Joo NS, Lee DJ, Kim KM, Kim BT, Kim CW, Kim KN, Kim SM. Ketonuria after fasting may be related to the metabolic superiority. J Korean Med Sci 2010; 25: 1771-6.
19. Nordmann AJ, Nordmann A, Briel M, Keller U, Yancy WS Jr, Brehm BJ, Bucher HC. Effects of low-carbohydrate vs low-fat diets on weight loss and cardiovascular risk factors: a meta-analysis of randomized controlled trials. Arch Intern Med 2006; 166: 285-93.
20. Gardner CD, Kiazand A, Alhassan S, Kim S, Stafford RS, Balise RR, Krae- mer HC, King AC. Comparison of the Atkins, Zone, Ornish, and LEARN diets for change in weight and related risk factors among overweight pre- menopausal women: the A TO Z Weight Loss Study: a randomized trial.
JAMA 2007; 297: 969-77.
21. Tendler D, Lin S, Yancy WS Jr, Mavropoulos J, Sylvestre P, Rockey DC, Westman EC. The effect of a low-carbohydrate, ketogenic diet on nonal- coholic fatty liver disease: a pilot study. Dig Dis Sci 2007; 52: 589-93.
22. Shai I, Schwarzfuchs D, Henkin Y, Shahar DR, Witkow S, Greenberg I, Golan R, Fraser D, Bolotin A, Vardi H, Tangi-Rozental O, Zuk-Ramot R, Sarusi B, Brichener D, Schwartz Z, Sheiner E, Marko R, Katorza E, Thiery J, Fiedler GM, Bluher M, Stumvoll M, Stampfer MJ; Dietary Intervention Randomized Controlled Trial(DIRECT) Group. Weight loss with a low- carbohydrate, Mediterranean, or low-fat diet. N Engl J Med 2008; 359:
229-41.