A Study on the Walking Recognition Method of Assistance Robot Legs Using EEG and EMG Signals
Dae Seob Shin*★
Abstract
This paper is to study the exoskeleton robot for the walking of the elderly and the disabled. We developed and tested an Exoskeletal robot with two axes of freedom for joint motion. The EEG and EMG signals were used to move the joints of the Exoskeletal robot. By analyzing the EMG signal, the control signal was extracted and applied to the robot to facilitate the walking operation of the walking assistance robot. In addition, the brain-computer interface technology is applied to perform the operation of the robot using brain waves, spontaneous electrical activities recorded on the human scalp. These two signals were fused to study the walking recognition method of the supporting robot leg.
Key words:EEG, EMG, Exoskeletal, Walking Recognition, Walking Assistance Robot
* Dept. of Electronic Information Communication Division, Shin Ansan University
★ Corresponding author
E-mail:[email protected], Tel:+82-2-2679-8556
※ Acknowledgment
Manuscript received Mar. 10, 2020; revised Mar. 23, 2020; accepted Mar. 24, 2020.
This is an Open-Access article distributed under the terms of the Creative Commons Attribution Non-Commercial License (http://creativecommons.org/licenses/by-nc/3.0) which permits unrestricted non-commercial use, distribution, and reproduction in any medium, provided the original work is properly cited.
Ⅰ. Introduction
As information technology is developed and advanced, the interface technology between human and computer is developing and the interface technology between human and computer is diversified in various forms. For a long time, the interface between human and computer has been conducted through text recognition, voice recognition, facial expressions and gestures, and has been studied. Furthermore, various attempts and studies have been made to use human biosignals, and it is thought that various studies will be made in the future. Recently, robots have been used in many fields and are being used in various industries. In this paper, we studied Exoskeletal robots to assist the elderly and the physically
weak. This robot, called Exoskeletons, Power suits or Power assist systems, has been studied since 1960 for use in military or industrial applications.
In this paper, we proposed the structure of the Exoskeletal robot leg with two degrees of freedom, performed the actual design and fabrication, and proposed a method for controlling it. The proposed Exoskaletal robot is automatically driven by EEG, which is a human brain wave signal, and controls the movement of the joint of the robot leg by the concentration of brain waves and recognizes the working method of the robot using the EMG signal. This paper focuses on the structure and user interface of the entire robot rather than a detailed description of the implementation process.
269
Ⅱ. Experimental
1. Exoskeletal Robot Leg
In this system, each leg joint uses DC servo motor to configure 2 degrees of freedom, and the leg joint is composed of 4 servo motors. In addition, each joint uses a controller to control the DC servomotor. In addition, precise position control of the robot was performed by using the potentiometer to control the position of each joint. In addition, the ARM Cortex-M3 32bit CPU was used to control each joint of the robot.
DC motor drive was designed and controlled to control each motor.
Fig. 1. Picture of Exoskeletal Robot Leg.
2. EEG Concentration Analysis
In this paper, after measuring the EEG (Electroencephalogram) signal generated from the scalp for robot control, the concentration is extracted from the indicators related to brain activity. According to the Zigbee wireless module to transmit the control signal to the robot controller to move the robot. EEG signal amplification and filtering were performed, and the measured EEG signal was analyzed by FFT (Fast Fourier Transformation) using LabView to analyze specific frequency region and spectrum. The extracted concentration signal was applied to the control operation of the robot.
EEG Signal Modeling
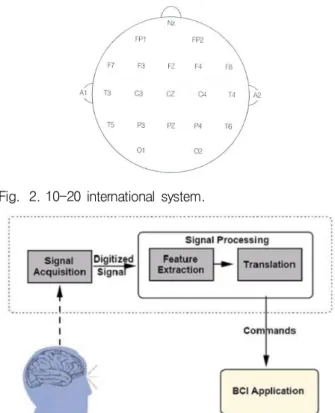
Fig. 2. 10-20 international system.
Fig. 3. EEG signal measurement concept.
- EEG measurement is measured according to international standard 10/20 electrode attachment standard
- FP is frontal lobe, A1 and A2 are left and right earlobe region
- Measure EEG at FP1 and FP2 and use A1 and A2 as reference electrodes
3. EMG signal analysis
In order to control the auxiliary robot, extract the EMG signal on the muscle part of the leg by using BioPack and process the extracted signal for robot control. Judgment was made to operate the robot.
* EMG signal acquisition experiment
- BioPack attaches the surface electrode to the leg muscles using an experimental measuring device, extracts the signal, and processes the signal using a digital signal processing processor.
Fig. 4. BioPack Experiment Device and electrode contact with Vastus medialis.
Fig. 5. standing and sitting posture.
The EMG signal using the surface electrode is a weak electric signal to be delivered to the DSP for processing, and the measured minute signal needs to be expelled approximately 1000 times.
After 1000 times amplification, the rectification process converts negative EMG signals into positive amplitudes. The average of the raw EMG signal before rectification is 0, but after rectification, the average value of the EMG signal can be used as useful information for analyzing the signal. The formula for calculating the average value is as follows.
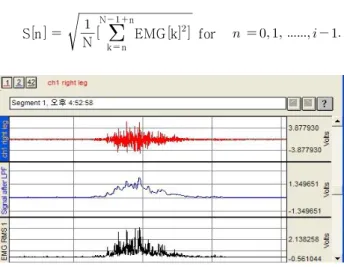
Sn N k n N n
EMG k for
Fig. 6. EMG signal in sitting motion.
The RMS value is the simplest way to extract envelope information and contains information about energy or force on EMG. After obtaining
the RMS signal, a low pass filter is used.
Generally, the information required for the surface EMG signal of human is distributed between 8 and 500Hz, and then filtered using the low pass filter.
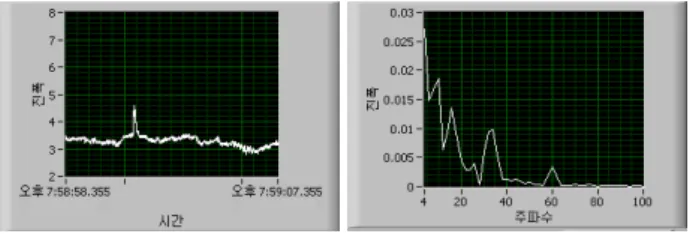
Fig. 7. Robot control Analog signal analysis result.
Fig. 8. Standing → sitting → standing motion.
Fig. 9. Power spectral density (LPF) of the signal passed through the lowpass filter.
* EEG signal acquisition experiment
- Concentration is “the power to focus the mind on something, or the power to focus,” and in psychiatry, the focus is “the mental power to pay attention to the stimulus that has been chosen as important to the external stimuli
that have been received.”
- BCI (Brain-Computer Interface), which measures the EEG related to concentration and controls the concentrated signal in hardware, extracts the feature points or features by classifying the EEG signal and classifies them into control signals[1][2].
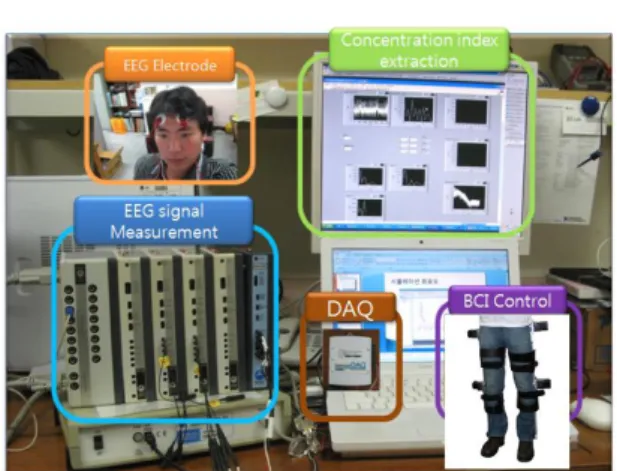
Fig. 10. EEG measuring system.
Fig. 11. EEG measuring Structure.
- To measure the EEG, use the EEG100C module manufactured by Biopack to measure the EEG (gain 5000, normal mode, cutoff frequency 0.1Hz of the high pass filter, and use the notch filter to remove noise of power supply noise).
- Digital signal conversion through SDAQ signal input device of USB type, and timing setting for AD conversion is set to continuous sample mode using LabView 8.5, sampling rate is set to 2Khz and number of samples to 1Khz.
* EEG Signal Processing
Signals measured in the frontal lobe using an international 10-20 system were converted into fast fourier transforms (FFTs) and then separated into respective frequency domains. The FFT equation is the same as (1), (2).
(1)
(2)
Each frequency band value through the FFT is stored in an array. In this paper, the values of SMR waves (12 to 5 Hz), Mid-Bata waves (15 to 20 Hz), and Thata waves (4 to 8 Hz) related to intensive indicators were extracted from the total array values. The values for each frequency domain were obtained through the numerical integration of LabView 8.2. The numerical in- tegration uses the Trapezoidal rule, and the result of integrating the data of the input array with the sampling interval is returned as the numerical integration value. The formula is as shown in (3).
(3)
j:Number of arrays in each frequency range
Fig. 12. EEG signal processing for concentration indicator extraction.
Finally, the equation for extracting the concentration index was calculated using Equation (4).
Concentration indicator
= (SMR+Mid_Beta)/Theta (4)
* EEG signal measurement
It was programmed with NI LabView 8.5 for EEG measurement experiments. EEG data measured in BioPack’s EEG100C was acquired by computer using SDAQ. Using the DAQ Assistant, EEG signals with bands below 100 Hz were sampled at 2 kHz to continuously sample 20 times the value. The signal acquired from SDAQ can be viewed through Raw EEG graph as shown in Fig 13.
Fig. 13. Raw EEG signal and FFT Analysis.
The following figure shows the extracted values
of the SMR, Mid-Bata, and Theta waves associated with the concentration indicator values.
Fig. 14. SMR wave와 Mid-Beta wave.
Fig. 15. Theta wave.
* EEG signal extraction
Raw EEG was classified by frequency band by applying FFT through the spectral measurement function of LabView and displayed only 0~100Hz region, which is the frequency range of interest of EEG signal. In order to divide the frequency
band values of spectral powers classified through FFT into the areas needed for intensive indicators, we use the array function to calculate the total array values for each frequency obtained through FFT to extract the values of SMR, Mid-Beta, and Theta waves. It calculated | required using.
In other words, the frequency band of each region was saved as each array value by applying it to the truncation VI, and the frequency value was displayed on the monitor.The stored array values
were applied to the formula (SRM + Mid_bata) / Theta for extracting the concentration indicators after integrating the frequency domain values to extract the concentration indicators through numerical integration. The figure shows the final concentration index value extracted. The concentration indicator value was expressed as an integer value of 1 to 5, and compared with the variable comparison indicator value, the auxiliary robot leg was set to move if it was higher.
Fig. 16. Final concentration indicator value.
* Assistance Robot Legs Experiment
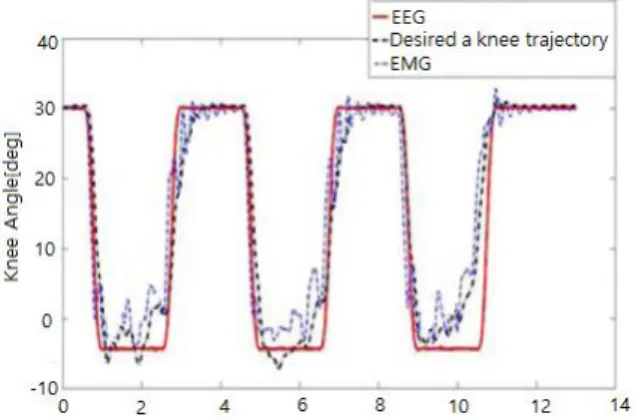
The final robot concentration value was used to control the assisted robot leg. Assistance robot legs were designed to communicate via Bluetooth and a serial communication port was used in LabView to control the robot legs. The legs of the robot can be controlled only by UP / Down by Bluetooth communication. When the final concentration indicator value is larger than the variable comparison indicator, the robot’s legs are UP. If the concentration is good, the robot leg is configured to be even higher. Fig. 17 shows the knee trajectory of the robot knee joint using the acquired EEG and EMG signals.
Fig. 17. Knee joint Prediction by EEG and EMG signals.
Fig. 18. Assistance robot legs experiment.
Ⅲ. Conclusion and Future Work
In this study, we conducted a study on Exoskeletal Robot that can assist the elderly and the disabled.
The EEG signal, which has been studied a lot recently, was used to extract the motion control signal of the robot according to the concentration.
The obtained EEG signal was amplified and output as a TTL level signal, processed by FFT signal to classify the EEG signal into the frequency domain, and the concentration index was obtained.
In addition, the robot sends the robot motion command to the Exoskeletal Robot through the wireless module, and performs the sitting and standing motions. In addition, in this study, EMG signal was used to control walkie-talk of assistant robot, and EMG signal generated from each leg muscle was acquired and analyzed to control assistant robot leg. In addition, if the concentration analysis using the EEG was performed to recognize the user’s prior behavior, the pre-operation of the assistance robot was performed using the analysis.
However, many people think that because of different EMG signals, learning will be necessary by applying artificial intelligence to signals that
change according to leg movement patterns. In addition, according to the concentration of several words, it is thought that research should be conducted to analyze various EEG signals. The EEG and EMG signals were applied to the assistance robot to pre-sell the robot’s movements. However, since the electrode is attached to the skin, it is necessary to develop an electrode to solve the noise and unnecessary data according to the movement of the robot and the user.
References
[1] G. Pfurtscheller et al., “Current trends in Graz brain-computerinterface (BCI) reseach,” IEEE Tras. Rehab. Enginnering., Vol.8, pp.216-219, 2000.
DOI: 10.1109/86.847821
[2] ZHAO QiBin, ZHANG LiQing & CICHOCKI Andrzej “EEG-based asynchronous BCI control of a car in 3D virtual reality environments,”
Chinese Science Bulletin, Vol.54, no.1, pp.78-87, 2009. DOI: 10.1007/s11434-008-0547-3
[3] J. R. Wolpaw, D. J. McFarland, and T. M.
Vaughan “Brain-Computer Communication,” Proceed- ing of the IEEE, Vol.89, No.7, 2001.
[4] Ndre Ferreira, “Human-machine interfaces based on EMG and EEG applied to robotic systems,”
Journal of NeuroEngineering and Rehabilitation, 2008. DOI: 10.1186/1743-0003-5-10
BIOGRAPHY
Dae Seob Shin (Member)
1996:BS degree in Electronics Engineering ,Howon University.
1998:MS degree in Electronics Engineering , Inha University.
2014:Ph. D. degree in Electrical and Biomedical Engineering, Hanyang University
2019~Present:adjunct Professor, Shin Ansan University
<Research Interests>
Image processing, neural network, Adaptive control, Signal Processing, Embedded Control, Rehabilitation robots.