Identification of SNPs in TG and EDG1 genes and
their relationships with carcass traits in Korean cattle (Hanwoo)
Muhammad Cahyadi
1,2, Dyah Maharani
1,3, Seung Heui Ryoo
4, Seung Hwan Lee
5, Jun Heon Lee
1*
1
Department of Animal Science and Biotechnology, College of Agriculture and Life Sciences, Chungnam National University, Daejeon 305-764, Korea
2
Department of Animal Science, Faculty of Agriculture, Sebelas Maret University, Surakarta 57126, Indonesia
3
Faculty of Animal Science, Gadjah Mada University, Yogyakarta 55281, Indonesia
4
Livestock Research Institute, Government of Chungcheongnam-Do, Cheongyang 345-811, Korea
5
Hanwoo Experiment Station, National Institute of Animal Science, RDA, Pyeongchang 232-956, Korea
한우에서 TG와 EDG1 유전자의 단일염기다형 확인 및 도체형질과의 연관성 분석
카야디
1,2ㆍ디아 마하라니
1,3ㆍ유승희
4ㆍ이승환
5ㆍ이준헌
11충남대학교 농업생명과학대학 동물자원생명과학과, 2인도네시아 세베라스마레 대학교 축산학과, 3인도네시아 가자마다 대학교 축산대학,
4충청남도 축산기술연구소, 5축산과학원 한우시험장
Received on 31 July 2012, revised on 11 September 2012, accepted on 12 September 2012
Abstract : Thyroglobulin (TG) gene was known to be regulated fat cell growth and differentiation and the endothelial differentiation sphingolipid G-protein-coupled receptor 1 (EDG1) gene involves blood vessel formation and known to be affecting carcass traits in beef cattle. The aim of this study was to identify the single nucleotide polymorphisms (SNPs) in both TG and EDG1 genes and to analyze the association with carcass traits in Korean cattle (Hanwoo). The T354C SNP in TG gene located at the 3’ flanking region and c.-312A>G SNP located at 3’-UTR of EDG1 gene were used for genotyping the animals using PCR-RFLP method. Three genotypes were identified in T354C SNP in TG gene and only two AA and AG genotypes were observed for the c.-312A>G SNP in EDG1 gene. The results indicated that T354C SNP in TG gene was not significantly associated with carcass traits. However, the c.-312A>G SNP in EDG1 gene had significant effects on backfat thickness (BF) and yield index (YI). These results may provide valuable information for further candidate gene studies affecting carcass traits in Korean cattle and may use as marker assisted selection for improving the quality of meat in Hanwoo.
Key words : TG, EDG1, Carcass traits, Hanwoo
*Corresponding author: Tel: +82-42-821-5779 E-mail address: [email protected]
I. Introduction
Three traits, namely carcass weight (CW), long- issimus muscle area (LMA) and marbling, are considered as important parameters in meat quality, especially in cattle in Korea (Cheong et al., 2006; Lee et al., 2008). Marbling is known as fat deposition in meat that significantly associated with juiciness and flavor
of meat (Shin et al., 2012). In Korea, high marbling score affects consumers’ demands for high quality meat and also determines the cost differences of the meat.
Previously, several studies have been reported the single nucleotide polymorphisms (SNPs) in the can- didate genes which was associated with carcass traits.
This candidate gene approach is one of the effective
tools to select the animals having desirable economic
traits. For example, the polymorphism in MC4R gene
influenced backfat thickness and marbling score,
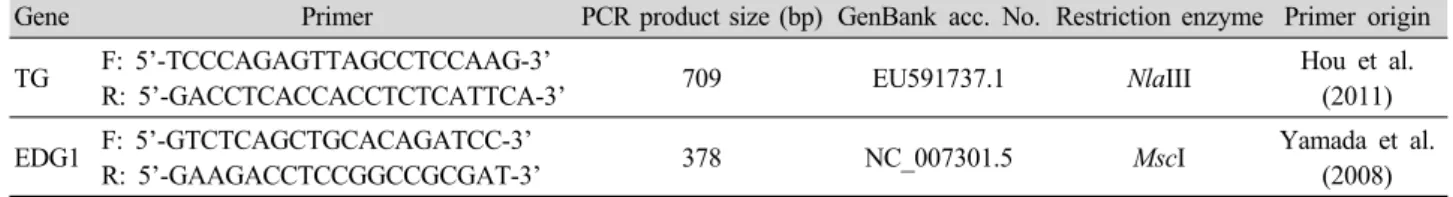
Table 1. Primers and restriction enzyme information.
Gene Primer PCR product size (bp) GenBank acc. No. Restriction enzyme Primer origin TG F: 5’-TCCCAGAGTTAGCCTCCAAG-3’
R: 5’-GACCTCACCACCTCTCATTCA-3’ 709 EU591737.1 NlaIII Hou et al.
(2011) EDG1 F: 5’-GTCTCAGCTGCACAGATCC-3’
R: 5’-GAAGACCTCCGGCCGCGAT-3’ 378 NC_007301.5 MscI Yamada et al.
(2008) especially the SNP marker C1786T in Hanwoo (Seong
et al., 2012). Also, the MYF5 was associated with increased meat tenderness and backfat thickness of beef cattle in China (Ujan et al., 2011). In addition, an SNP in GHR gene was associated the moisture and intramuscular fat in semi membranous muscle in beef samples (Reardon et al., 2010). Another report con- firmed that the presence of SNPs in somatostatin (SST) gene was affected marbling and fat thickness, whereas adiponectin (ADIPOQ) gene affected both rib eye muscle area and fat thickness. These genes are located on BTA1 in cattle (Morsci et al., 2006).
Thyroglobulin gene (TG) produces the precursor for thyroid hormones which regulates metabolism and affects fat cell growth and differentiation. Also, this gene affects homeostasis of fat deports (Gan et al., 2008). This gene has been mapped on BTA14 in the previously known QTL region for carcass traits, especially marbling in Hanwoo (Shin and Chung, 2007).
Hou et al. (2010) reported that 6 novel SNPs were found at the 3’flanking region in TG gene. One of these SNPs, T354C SNP, was strongly associated with marbling scores. In addition, the endothelial differ- entiation sphingolipid G-protein-coupled receptor 1 (EDG1) gene, involved in blood vessel formation, is also known to be affecting carcass traits in beef cattle (Watanabe et al., 2010). This gene has been located in the Quantitative Trait Locus (QTL) region and mapped on BTA3 using radiation hybrid (RH) panel in Japanese Black Cattle (Yamada et al., 2006). Previous study reported by Yamada et al. (2009) showed that a SNP in the 5’ untranslated region (UTR) of EDG1 gene may affect marbling score in Japanese Black Cattle. Both TG and EDG1 genes were located in QTL region. Thus,
they were regarded as a positional functional candidate gene for carcass traits, especially for marbling scores.
Therefore, the aim of this study is to identify the polymorphisms in TG and EDG1 genes and to analyze their associations with carcass traits in Korean cattle, Hanwoo.
II. Materials and Methods
1. Animals and data collection
Seventy three longissimus thoracis Hanwoo beef samples were collected for genomic DNA extraction.
The samples provided by the slaughter house with the help of the regional Hanwoo brand association called
‘‘Tobawoo’’. These cattle were all castrated males and reared under same feeding conditions including the fattening period and approximately 30 months old, these animals were slaughtered. Both carcass and meat quality data were provided by the Tobawoo. The meat parameter data including raw weight (RW), backfat thickness (BF), longissimus muscle (LM), carcass weight (CWT), yield index (YI), yield grade (YG), and marbling score (MS) were used in this study.
2. The DNA extraction and genotyping
For PCR amplification, two pairs of primers were designed for both thyroglobulin (TG) and EDG1 genes.
The primers and restrictiction enzyme information are shown in Table 1.
Polymerase chain reaction was carried out in 20 µl
volume containing 50 ng/µl DNA genome, 0.8 µl of
each primer, 1.6 µl dNTP, 2.0 µl 10X reaction buffer,
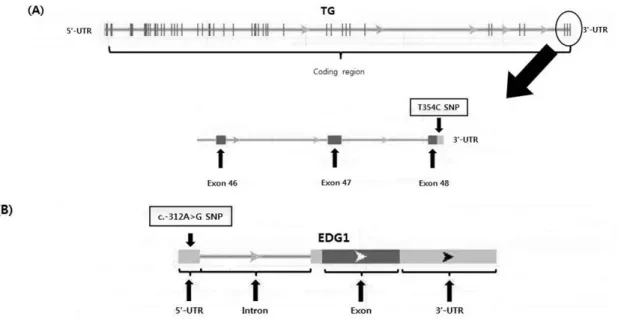
Fig. 1. The gene organizations for TG (A) and EDG1 (B) genes.
0.2 µl HS Taq Polymerase (GenetBio, Korea), and 12.6 µl distilated water. The PCR conditions were as follows: 94℃ for 10 minutes, 34 cycles of 94℃ for seconds, the annealing temperature were 55℃ (TG) and 62℃ (EDG1) for 30 seconds, and 72℃ for 30 seconds, followed by a further 10 minutes final extention at 72℃.
Reaction was performed using either GeneAmp PCR system 2700 (Applied Biosystems, USA) or C1000 TM Thermal Cycler (BioRad, USA). The PCR products were visualized by 1.5% standard agarose gels stained with ethidium bromide (GenetBio, Korea).
Each PCR fragment was purified using an Accu- Prep ® PCR Purification Kit (Bioneer, Korea). Purified PCR products were sequenced using the same primers for PCR reaction in an automated 3730 XL DNA Se- quencer (Applied Biosystems, USA). The DNA sequence of TG and EDG1 genes were compared with reference sequences using the BioEdit program ver. 7.00 (Tom Hall, Ibis Therapeutics, California, USA). The sequence alignment was performed to determine the single nucleotide polymorphism (SNP) positions in the TG and EDG1 genes. The T354C SNP of TG gene was located in the 3’-UTR (Fig. 1A), while the c.-312A>G SNP of EDG1 was located in the 5’-UTR region (Fig. 1B).
These SNPs have been confirmed with the electro- phoregram results. For genotyping these SNPs, PCR- restriction fragment length polymorphism (RFLP) was applied. The restriction enzyme digestion was performed in 20 µl reaction volumes with approximately 15 µl of PCR products and 2 units of each restriction enzyme.
The digested products were run on 3% agarose gels.
3. Statistical analysis
Pearson’s Chi-square test was used to verify the Hardy–Weinberg equilibrium status for the allele and genotype frequencies. The effects of TG and EDG1 genotypes on carcass traits were tested using ANOVA (Analysis of Variance) procedure in the SPSS version 17.0 program (SPSS, USA). The following model was used for the analysis the association of the genotype and carcass traits:
Y ij = µ + β i + ε ij
Where, Y ij is traits observed in the ij th animal, µ is the overall mean, β i is the i th genotype effect, and ε ij
is a random error. In order to test the pairwise differ-
ences between the genotypes, Tukey’s test was also
performed.
Fig. 2. PCR-RFLP results for the SNP T354C genotypes in TG gene (A) and c.-312A>G genotypes in EDG1 gene (B).
Table 2. Genotype and alelle frequencies of TG and EDG1 SNPs in Hanwoo population.
Gene SNP Genotype Genotype frequency Alelle Alelle frequency Chi-square (X
2) test (P-Value)
TG T354C CC 0.34 C 0.61 1.095 (0.05)
TC 0.54 T 0.39
TT 0.12
EDG1 c. -312A>G AA 0.81 A 0.90 -
AG 0.19 G 0.10
GG 0
III. Results
1. Polymorphism of TG and EDG1 in population
Initially we sequenced the PCR product of both the TG and EDG1 genes and identified the SNPs. The T354C SNP of TG gene was used for PCR-RFLP genotyping of the animals. The 709 bp of TG gene PCR product was digested into 282, 190, 112, 72, 31 and 22 bp fragments for the TT genotype using Nla III restriction enzyme. On the other hand, the CC geno- type gave 304, 190, 112, 72, and 31 bp restriction enzyme fragments (Fig. 2A). In case of EDG1 gene, c.-312A>G SNP gave no restriction site of 378 bp PCR product for GG genotype. However, for the AA geno- type, the c.-312A>G SNP was digested into 214 bp and 164 bp with Msc I restriction enzyme (Fig. 2B).
The genotype and alelle frequencies of TG and EDG1 genes are shown in Table 2. For the TG genes, all three genotypes (CC, TC, and TT) were observed. The TC genotype has the highest genotype frequency than other genotypes. The C allele frequency of TG gene was higher than the T allele frequency. In case of
EDG1 gene, only two genotypes, AA and AG, were observed. The AA genotype was higher genotype fre- quency than AG genotype. The Pearson’s Chi-square test was also used to verify the Hardy–Weinberg equilibrium status. The X 2 value of T354C SNP was lower than 3.84, indicating this SNP was in Hardy–
Weinberg equilibrium (Table 2). However, X 2 value of c.-312A>G SNP cannot be tested because only one GG genotype was observed.
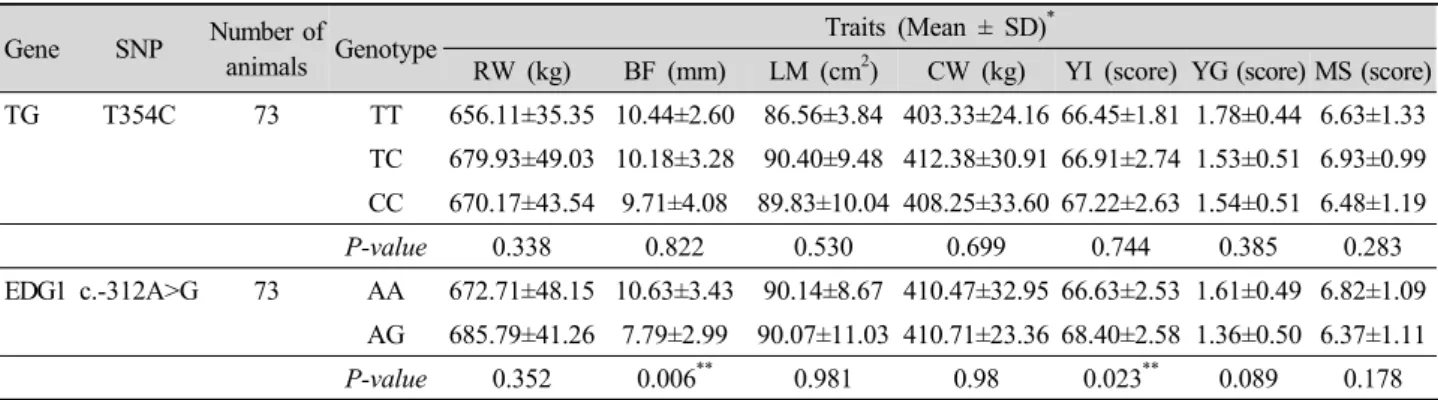
2. The association between identified SNPs and carcass traits in Hanwoo Seven carcass traits, namely raw weight (RW), backfat thickness (BF), longissimus muscle (LM), carcass weight (CW), yield index (YI), yield grade (YG), marbling score (MS), were used for association analysis of the SNPs in TG and EDG1 genes. The T354C SNP in TG gene was no association with the carcass traits. On the other hand, the c.-312A>G SNP in EDG1 gene gave significant results in backfat thickness (BF) (P<0.01). Animals having AA genotypes have higher BF than animals having AG genotypes.
Also, this SNP was significantly associated with YI
Table 3. Association analyses between identified SNPs and carcass traits in Hanwoo.
Gene SNP Number of
animals Genotype Traits (Mean ± SD)
*RW (kg) BF (mm) LM (cm
2) CW (kg) YI (score) YG (score) MS (score) TG T354C 73 TT 656.11±35.35 10.44±2.60 86.56±3.84 403.33±24.16 66.45±1.81 1.78±0.44 6.63±1.33
TC 679.93±49.03 10.18±3.28 90.40±9.48 412.38±30.91 66.91±2.74 1.53±0.51 6.93±0.99 CC 670.17±43.54 9.71±4.08 89.83±10.04 408.25±33.60 67.22±2.63 1.54±0.51 6.48±1.19
P-value 0.338 0.822 0.530 0.699 0.744 0.385 0.283
EDG1 c.-312A>G 73 AA 672.71±48.15 10.63±3.43 90.14±8.67 410.47±32.95 66.63±2.53 1.61±0.49 6.82±1.09 AG 685.79±41.26 7.79±2.99 90.07±11.03 410.71±23.36 68.40±2.58 1.36±0.50 6.37±1.11
P-value 0.352 0.006
**0.981 0.98 0.023
**0.089 0.178
*