Development of a Foot Pressure Distribution Measuring Device for Lower Limb Rehabilitaion
Junghyeon Choi
1, Jaeyong Seo
2, Jun Mo Park
31
R&D Center, AIRLab,
2R&D Center, THK Company Co., Ltd.,
3Department of Computer Engineering, Dongseo University
요 약
• 주제어 :
Abstract It is important to train lower limb muscle strength using a tilting table to recover the lower extremity function of hemiplegia patients. It is known that the foot deformity and poor posture of hemiplegia patients can reduce the effectiveness of lower limb rehabilitation training. In this study, we developed a sensor system that can measure the foot pressure distribution of the patients for the load control of the lower extremity during lower limb rehabilitation training and it can be substituted for conventional high-cost technologies.
• Key Words : Hemiplegic Patient, Foot Pressure, Rehabilitation, Conductive Rubber, Sensor
Received 27 April 2017, Revised 18 May 2017, Accepted 8 June 2017
Ⅰ. Introduction
Hemiplegia means that paralysis is on one vertical half of the body. It is usually caused by injury to parts of the brain that control movements of the limbs, trunk, face, etc.
One of the main neuro-physiological techniques in physical rehabilitation of hemiplegic patients is that of weight transfer toward and weight bearing over the affected leg [1]. The most used training method for increasing muscle strength of lower limb is to use a tilting table [2]. However, foot and joint deformity of hemiplegic patients can cause a problem that their postures are unstable when they use the tilting table. It may reduce the effectiveness of lower limb rehabilitation [3-5].
In particular, most hemiplegic patients show WBA(Weight Bearing Asymmetry) symptoms that cannot load their weight evenly on both feet [6]and it may cause asymmetric walking postures.
In addition, it is very important to regain even weight, balanced standing posture, and symmetrical walking posture to restore walking ability in rehabilitation [1][7]. Therefore, the medical staff needs to continuously monitor the training accuracy in rehabilitation.
However, in clinical practice, continuous patient observation and monitoring is not possible by the medical staff. Generally, it is not easy the medical staff to know exactly how much weight is actually transferred on the affected side during training or how this weight is distributed on the foot.
The purpose of this paper is to develop a low-cost and high-efficiency foot pressure sensor system which can measure foot pressure distribution in real-time for lower limb rehabilitation and to assess the usefulness of it as an objective and clinical measurement tool.
Ⅱ. Methods
2.1 Sensors
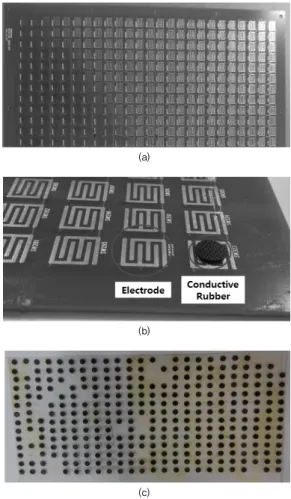
The proposed sensor is using the elasticity of the conductive rubber. As shown in Figure 1 (a), the electrode plate is arranged in a 25×14 array and the conductive rubber is attached as shown in Figure 1 (b), (c)
(a)
(b)
(c)
Fig. 1. Sensor PCB with conductive rubber
The conductive rubbers applied to the electrodes
are contacted with the two electrodes (A and B),
as shown in Figure 2 (a). When the load is
applied as shown in Figure 2 (b), the conductive
rubber is stretched and the resistance is decreased
accordingly. One pair of the electrode(A, B) is
defined as ONE cell, and the displacement value measured in real-time according to the changing resistance value is displayed as the pressure value of the cell. One sensor array has350 cells on printed circuit board.
(a)
(b)
Fig. 2. Sensing algorithm
2.2 Circuit
The sensor circuit consists of ADC module for measuring foot pressure in real time from 350 electrodes and a communication module for data transmission. The measured values are collected by an analog MUX circuit and converted to digital values by a 32bit microcontroller (Nuvoton) with internal ADC. The converted pressure value is transmitted to the PC by serial communication and displayed on the monitor through the exclusive viewer program.
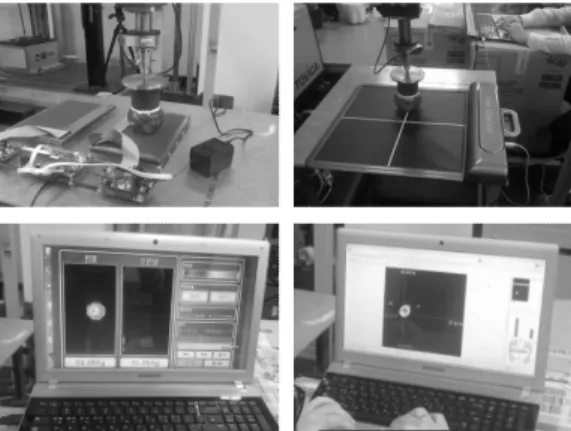
Fig. 3. Foot pressure sensor system
Figure 3 shows the implemented foot pressure measurement device and Figure 4 is a schematic diagram of measurement, communication, and processing of foot pressure signals.
Fig. 4. Foot pressure sensing system GU
Fig. 5. Signal Processing construction
Fig. 6. Calculation of Exercise load
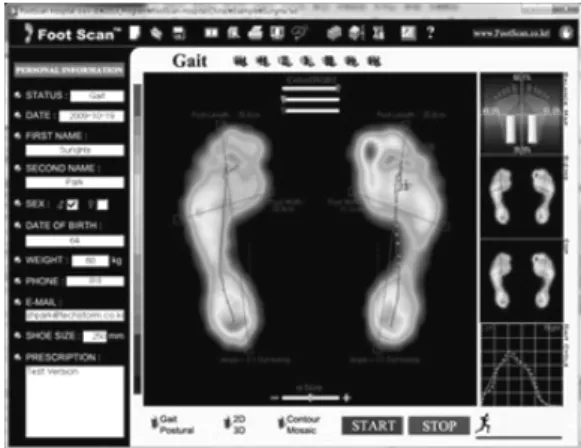
2.3 User Interface
Figure 5 shows for measuring foot pressure in real-time with actual hemiplegia patient on a tilt table. High-pressure areas are indicated in red, and yellow, green, and blue areas are displayed by the measured foot pressure value.
Fig. 7. Usability test
2.4 Experiment
Experiments were conducted to confirm the reliability of the developed sensor. A spherical elastic jig was produced and mounted on a material test system (MTS), and it pressed at a constant pressure of 200N.
In the same condition, the jig is mounted on reference equipment (GHiWell) and pressed with 200N to perform a comparative test. Then the measured values were compared and analyzed with each other. Figure 6 shows the sensor accuracy test with the material test system.
Fig. 8. Sensor reliability test
Ⅲ. Results
Figure 7 (a) shows the distribution of measured pressure with the developed equipment. Figure 7 (b) shows the distribution of measured pressure with the comparative equipment.
In the developed pressure sensor, when the load of 200N is added, the value of each cell shows an equivalent deviation. But the reference equipment shows a saturation phenomenon showing the same value in a wide area.
The developed equipment in this study does not cause supersaturation because it shows the pressure after measuring the maximum and minimum pressure values first and then re-scaling.
(a) (b)
Fig. 8. Result comparison