• 검색 결과가 없습니다.

A PCR Denaturing Gradient Gel Electrophoresis (DGGE) Analysis of Intestinal Microbiota in Gastric Cancer Patients Taking Anticancer Agents

N/A
N/A
Protected

Academic year: 2021

Share "A PCR Denaturing Gradient Gel Electrophoresis (DGGE) Analysis of Intestinal Microbiota in Gastric Cancer Patients Taking Anticancer Agents"

Copied!
9
0
0

로드 중.... (전체 텍스트 보기)

전체 글

(1)

A PCR Denaturing Gradient Gel Electrophoresis (DGGE) Analysis of Intestinal Microbiota in Gastric Cancer Patients Taking Anticancer Agents

Sun Nyoung Yu

1,2

and Soon Cheol Ahn

1,2

*

1

Department of Microbiology and Immunology, Pusan National University School of Medicine, Yangsan 50612, Korea

2

Immunoregulatory Therapeutics Group in Brain Busan 21 Project, Pusan National University, Yangsan 50612, Korea Received July 31, 2017 /Revised September 13, 2017 /Accepted September 27, 2017

Intestinal microbiota is an important factor in the development of immune defense mechanisms in the human body. Treatments with anticancer agents, such as 5-Fluorouracil, Cisplatin, and Oxaliplatin, significantly change the temporal stability and environment of intestinal bacterial flora. The anticancer treatment chemotherapy often depresses the immune system and induces side effects, such as diarrhea. This study investigated the effects anticancer agents have on the intestinal microbial ecosys- tems of patients with gastric cancer. An exploration of the diversity and temporal stability of the dom- inant bacteria was undertaken using a DGGE with the 16S rDNA gene. Researchers collected stool samples from patients zero, two and eight weeks after the patients started chemotherapy. After the treatment with anticancer agents, the bacteria strains Sphingomonas paucimobilis, Lactobacillus gasseri, Parabacteroides distasonis and Enterobacter sp. increased. This study focused on the survival of the bene- ficial microorganisms Bifidobacterium and Lactobacillus in the intestines of cancer patients. The admin- istration of antigastric cancer agents significantly decreased Lactobacillus and Bifidobacterium pop- ulations and only moderately affected the main bacterial groups in the patients' intestinal ecosystems.

The results showed the versatility of a cultivation independent–PCR DGGE analysis regarding the visual monitoring of ecological diversity and anticancer agent-induced changes in patients' complex intestinal microbial ecosystems.

Key words : Anticancer agent, diversity, intestinal microbiota, PCR-DGGE

*Corresponding author

*Tel : +82-51-510-8092, Fax : +82-55-382-8090

*E-mail : ahnsc@pusan.ac.kr

This is an Open-Access article distributed under the terms of the Creative Commons Attribution Non-Commercial License (http://creativecommons.org/licenses/by-nc/3.0) which permits unrestricted non-commercial use, distribution, and reproduction in any medium, provided the original work is properly cited.

Journal of Life Science 2017 Vol. 27. No. 11. 1290~1298 DOI : https://doi.org/10.5352/JLS.2017.27.11.1290

Introduction

Gastric cancer is the leading cancer type in Korea.

Treatment for cancer may include surgery, chemotherapy and radiation therapy. Gastric cancer patients often have to undergo major abdominal surgery along with chemotherapy.

Combination chemotherapy [1] using 5-fluorouracil, carmus- tine, semustine, and doxorubicin, and more recently cispla- tin, and platinum, have been used for the treatment of ad- vanced cancer. These drugs are highly effective antibacterial agents [5, 12], of which some can be administered orally, thereby having major pharmacoeconomic advantages over other antibiotics [4]. Yet these agents have been shown to induce substantial short- and long-term side effects, includ- ing diarrhea and constipation [20]. Evidence demonstrates

that chemotherapy-induced diarrhea is associated with an imbalance in the intestinal bacteria ecosystem [22].

The distal intestinal tract of humans harbors a complex bacterial community termed the microbiota, the composition of which is represented in the feces. Methods in molecular microbiology have become a valid supplement to traditional techniques [14]. Molecular methods that identify bacteria, es- pecially those that can sequence the genes encoding for ribo- somal 16S rDNA, have become very important tools in studying bacterial communities in patients’ fecal samples [14]. Culture-independent methods are now often used be- cause they are believed to overcome problems associated with selective cultivation and isolation of bacteria in cul- tured samples. The principal reason to use culture-in- dependent techniques is the lack of knowledge about the real conditions under which most bacteria grow in their nat- ural habitat; it is also difficult to develop media for culti- vation that accurately resemble these conditions[13].

In recent years, the intestinal microflora has been simu-

lated by developing and marketing preparations of living

microbial cells that, when consumed, are believed to influ-

ence the composition of the bacteria in the intestine and ben-

(2)

efit the well being of the consumer [16]. Probiotics are live microorganisms which, when administered in adequate amounts, confer a health benefit to the host. Lactobacillus and Bifidobacterium are commonly used as probiotics. Several studies reported the protective effect of probiotic con- sumption on patients receiving anticancer agents [11].

Microbiological investigations of the compositions of ter- restrial and microbial communities have shown the versa- tility of denaturing gradient gel electrophoresis (DGGE) combined with PCR as a molecular analytical method. In this technique, DNA is extracted from patients’ fecal samples and a variable sequence region of the 16S rDNA gene is amplified by PCR [19]. In the last decade, molecular finger- printing techniques such as DGGE, terminal restriction frag- ment length polymorphisms or single strand conformation polymorphisms became important and frequently used tools in microbial ecology.

In DGGE, DNA fragments of the same length but with different base-pair sequences (G+C contents) can be sepa- rated. Separation in DGGE is based on the electrophoretic mobility of a partially melted DNA molecule in poly- acrylamide/bis gels. Sequence variants of particular frag- ments will therefore stop migrating at different positions in the denaturing gradient and hence can be separated effec- tively by DGGE. This technique has been successfully ap- plied to identifying sequence variations in a number of genes from several different organisms [19].

The current study was designed to investigate the effect of chemotherapy on the intestinal ecosystem of gastric can- cer patients. For this purpose, bacterial population finger- printing of feces was determined using PCR followed by DGGE analysis of the 16S rDNA gene with universal and species-specific primers. Microbial changes detected in the microbiota profiles were further characterized.

Materials and Methods

Subject and sample collection

The subjects of this study were 3 patients who were pre- viously diagnosed with gastric cancer in the Gastroenterol- ogy Clinic at Pusan National University Hospital in Korea.

The patients were given 5-fluorouracil, cisplatin, and ox- aliplatin chemotherapy for 8 weeks.

The ward staff collected stool samples from the patients on sampling days–0, 2 and 8 weeks after the start of chemotherapy. Fecal specimens were collected in sterile

tubes, immediately delivered to the laboratory, and frozen at -70°C where they were stored until analysis.

Prepared of genomic DNA for denaturing gradient gel electrophoresis (DGGE)

Total DNA was extracted from fecal samples by using the QIAamp

®

DNA Stool Mini Kit (QIAgen, Canada) according to the manufacturer’s instructions with some modifications [10]. Briefly, fecal samples were lysed in ASL buffer (QIAgen), which is specially developed to remove inhibitory substances from stool samples, centrifuged, and then the su- pernatant was transferred to a clean 2 ml tube to remove cell debris. The InhibitEx tablet, provided by the manu- facturer, was suspended in each sample. The role of the tab- let is to remove the DNA-damaging substances and poly- merase chain reaction (PCR) inhibitors. DNA was pre- cipitated with ethanol and applied to a column provided in the kit and dissolved in AE buffer (10mM Tris-HCl, 0.5mM EDTA, pH 9.0). Finally, genomic DNA samples were stored at -20°C.

Polymerase chain reaction (PCR) of 16s rDNA with universal primers

PCR amplification of the 16S rDNA genes was carried out with the universal primers Bact-11F and Bact-1492R (Table 1). The PCR program consisted of the following steps: initial denaturing at 95°C for 10 min, followed by 30 cycles of dena- turing at 95°C for 1 min, primer annealing at 55°C for 1 min, extension at 72°C for 1 min, and final extension for 10 min at 72°C. Amplification products were purified using a PCR products purification kit (QIAgen).

The V1-V3 region of the 16S rDNA gene of bacteria in the intestinal contents was amplified with primers Bact-11F (GC) and Bact-536R (Table 1). Touchdown PCR [7] was per- formed by using 20 cycles consisting of denaturation at 95°C for 1 min, primer annealing at 65°C for 1 min (temperature was decreased by 0.5°C every cycle until the touchdown temperature of 55°C was reached) and primer extension at 72°C for 1 min. Fifteen additional cycles were carried out at an annealing temperature of 55°C. For the last extension step, tubes were incubated for 10 min at 72°C.

PCR of 16s rDNA with species-specific primers

The bifidobacterial population was investigated by nested

PCR [3]. The first PCR applied primers Bif-26F and Bif-3R

(Table 1) described by Kaufmann et al. [8] and amplified a

(3)

Table 1. List of primers

Primer Sequence (5’→3’)

Bact-011F Bact-1492R Bact-011F(GC) Bact-0536R Bif-26F Bif-3R Bif-0164F(GC) Bif-0662R Lac-0159F(GC) Lac-0677R GC clamp

AGA GTT TGA TCC TGG CTC AG ACG CGT ACC TTG TTA CGA CTT

(GC-clamp) AGA GTT TGA TCC TGG CGC AG GW

1

A TTA CCG CGG CK

2

G CTG

GAT TCT GGC TCA CGA TGA ACG CGG GTG CTN

3

CCC CAC TTT CAT G (GC-clamp) GTG GTA ATG CCG GAT G CCA CCG TTA CAC CGG GAA

(GC-clamp) AAA CAG R

4

TG CTA ATA CCG CAC CGC TAC ACA TGG AG

CGC CCG CCG CGC GCG GCG GGC GGG GCG GGG GCA CGG GGG

*

1

W is A or T,

2

K is G or T,

3

N is A, G, T and C,

4

R is A or G

1417 bp fragment of the Bifidobacterium’ s 16S rDNA gene.

The following PCR program was used: initial denaturation at 94°C for 5 min, three cycles of denaturation at 94°C for 4 sec, annealing at 57°C for 2 min, extension at 72°C for 1 min, 30 cycles of denaturation at 94°C for 20 sec, annealing at 57°C for 1 min, extension at 72°C for 1 min and final extension at 72°C for 5 min. A second PCR was performed using the amplicons of the first PCR as template DNA. PCR amplification of the V1-V3 regions of bacterial 16s rDNA genes was carried out using the specific bacterial primers set Bif-0164F (GC) and Bif-0662R. The forward primer con- tained a GC clamp (5’-CGC CCG CCG CGC GCG GCG GGC GGG GCG GGG GCA CGG GGG-3’) to facilitate separation of the amplicons in a DGGE gel.

PCR amplification of the Lactobacillus species 16S rDNA genes was carried out with the universal primers Bact-11F and Bact-1492R (Table 1). The amplification program was the same as previously described. And the lactobacilli pop- ulation was Lactobacillus species-specific primers were Lac-159F (GC) and Lac-677R (Table 1). The amplification program was 92°C for 2 min followed by 30 cycles of 95°C for 30 sec, 30 sec at the 55°C annealing temperature, and 72°C for 30 sec. A cycle of 72°C for 5 min concluded the program.

Moreover, to check for specificity, the sequences of the selected PCR primers were compared to the sequences avail- able in the BLAST database search program (www.ncbi.

nlm.nih.gov/BLAST).

Denaturing gradient gel electrophoresis (DGGE) analysis

DGGE was performed with a D-Code system (Bio-Rad,

Hercules, CA) utilizing 16-cm × 16-cm × 1-mm gels. Eight percent polyacrylamide gels were prepared and run with 0.5X TAE buffer, (20 mM Tris base, 10 mM acetic acid, 0.5 mM EDTA, pH 8.0) diluted from 50X TAE buffer. The gels contained 30 to 50% gradient of urea and formamide increas- ing in the direction of electrophoresis. A denaturing solution containing 40% formamide and 7 M urea was used. The elec- trophoresis was conducted with a constant voltage of 70 V at 65°C for about 16 hr 30 min. After electrophoresis, the gels were stained with ethidium bromide (10 μg/ml in DW) solution for 30 min, observed by UV illumination. DGGE fingerprints obtained from the 16S rDNA banding patterns were digitized by using Image J program (http://rsbweb.

nih.gov/ij),

Sequencing and sequence analysis

To confirm the identification of the intestinal microbiota established by DGGE and species-specific primers, we am- plified and sequenced the variable region of the 16S rDNA gene of each fragment and conducted a ribosomal database project (RDP) search (www.rdp.cme.edu/). Amplification of the variable region was accomplished with primers (lacking the GC clamp) and the same thermal cycler (BioRad) pro- gram as described above for DGGE. DNA sequencing was performed by the Genotech staff (Genotech co., Daejeon, Korea).

Statistical analyses

PCR-DGGE profiles were compared using XLStat pro-

gram (http://xlstat.com). The analysis included the number,

position, and intensity of PCR-DGGE bands (PCR-amplified

16S rDNA fragments) in the gel.

(4)

A B C

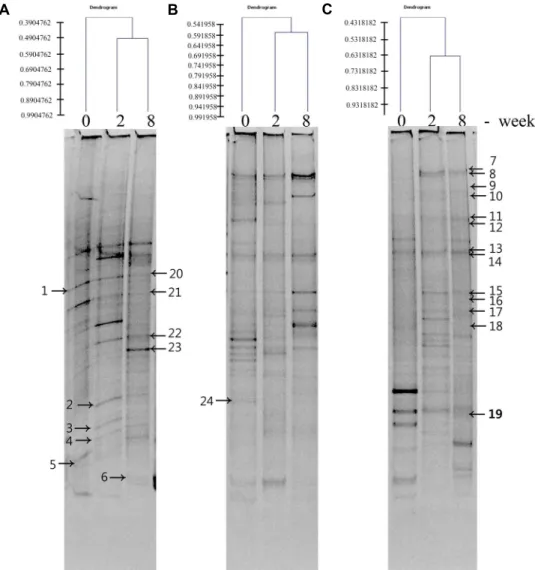
Fig. 1. PCR-DGGE profiles representing the bacterial diversity in fecal samples. DGGE of PCR fragments on 30% to 50% denaturing gradient gel. Each lane reveals the microbial ecosystem at 0, 2 and 8 weeks Numbered bands were identified with 86.8%

similarity to 100.0% through ribosomal database project (RDP) search (www.rdp.cme.edu/).

Results

Diversity of bacterial species represented in the denaturing gradient gel electrophoresis (DGGE) patterns Fecal samples were analyzed by polymerase chain re- action (PCR)-DGGE to characterize and compare bacterial survival in the large intestines of patients administrating an- ticancer agents. Briefly, the V1-V3 region of the 16S rDNA genes (positions 11 to 536 in the Escherichia coli gene) of bac- teria in the fecal samples was amplified by universal primers Bact-11F (GC) and Bact-536R. PCR reaction mixtures and the amplification program were the same as previously de- scribed (Material and Methods).

Analysis of PCR products by DGGE resulted in a finger- print that represents the diversity of the rDNA nucleotide

sequences due to the different bacterial types. The mobility of these amplicons after DGGE was compared to those ob- tained from the 16S rDNA of the same feces sample at differ- ent time points, as shown in Fig. 1. The bands in the profiles represented most of the dominant microbial populations in the community, and their appearance and disappearance re- flected approximate temporal changes in the microbial com- munity composition. Using a statistical analysis of each lanes using XLstat program, we observed the change of intestinal microbiota ecosystem, after dosing the anticancer agents just after 2 weeks.

To amplify the products, 33 bands were excised from the gels and purified with a QIAEX gel extraction kit (QIAgen).

Some of the bands did not amplify with PCR to prepare

amplicons for sequencing. The sequences were verified with

(5)

Table 2. List of DGGE band profiles

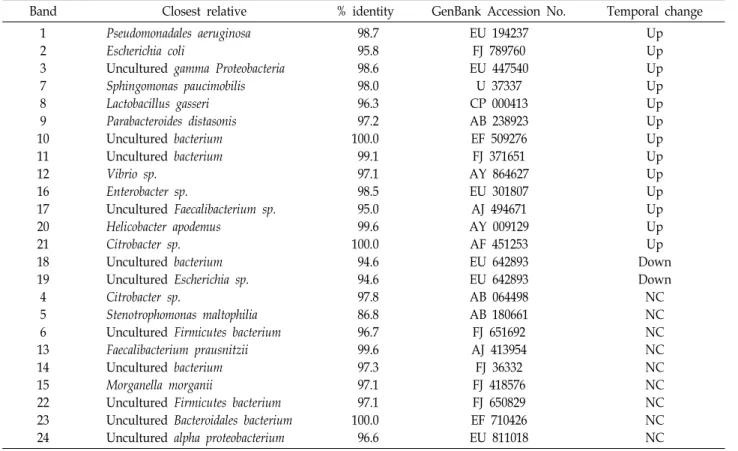
Band Closest relative % identity GenBank Accession No. Temporal change

1 2 3 7 8 9 10 11 12 16 17 20 21 18 19 4 5 6 13 14 15 22 23 24

Pseudomonadales aeruginosa Escherichia coli

Uncultured gamma Proteobacteria Sphingomonas paucimobilis Lactobacillus gasseri Parabacteroides distasonis Uncultured bacterium Uncultured bacterium Vibrio sp.

Enterobacter sp.

Uncultured Faecalibacterium sp.

Helicobacter apodemus Citrobacter sp.

Uncultured bacterium Uncultured Escherichia sp.

Citrobacter sp.

Stenotrophomonas maltophilia Uncultured Firmicutes bacterium Faecalibacterium prausnitzii Uncultured bacterium Morganella morganii

Uncultured Firmicutes bacterium Uncultured Bacteroidales bacterium Uncultured alpha proteobacterium

98.7 95.8 98.6 98.0 96.3 97.2 100.0 99.1 97.1 98.5 95.0 99.6 100.0 94.6 94.6 97.8 86.8 96.7 99.6 97.3 97.1 97.1 100.0 96.6

EU 194237 FJ 789760 EU 447540

U 37337 CP 000413 AB 238923 EF 509276 FJ 371651 AY 864627 EU 301807 AJ 494671 AY 009129 AF 451253 EU 642893 EU 642893 AB 064498 AB 180661 FJ 651692 AJ 413954 FJ 36332 FJ 418576 FJ 650829 EF 710426 EU 811018

Up Up Up Up Up Up Up Up Up Up Up Up Up Down Down NC NC NC NC NC NC NC NC NC

*NC : not changed

Table 3. Identification of DGGE bands using Lactobacillus-specific primers

Closest relative % identity GenBank Accession No. Temporal change

Lactobacillus pantheris Lactobacillus ruminis Uncultured Lactobacillus sp.

Uncultured bacterium Lactobacillus sp.

Uncultured bacterium

90.9 97.9 78.2 85.3 93.1 83.3

AB257867 AY851760 GQ911089 FJ808988 GQ911109 DQ647971

Up Up Up Down Down Down an RDP database, from which we identified 24 nucleotide

sequences (Table 2). The DGGE profiles obtained from the three patients were the change of the 16S rDNA sequences present in the feces during the treatment of chemotherapy.

Most of the predominant bands (for example the bands in- dicating F. prausnitzii, M. morganii, uncultured Firmicutes sp.

and uncultured Bacteroidales sp.) were present in all feces.

Some DGGE bands, however, suggested that the presence of several intestinal microflora was dependent on the individual.

Temporal stability of the DGGE pattern over time after treatment with anticancer agents

Figure 1 showed the DGGE patterns of the patients under-

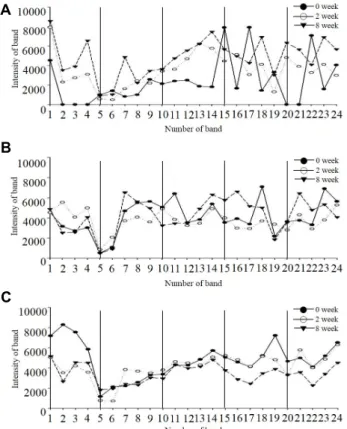
going anticancer therapy for 8 weeks. The band patterns were complicated in all cases. At the week follow-up stool examination, the DGGE profile remained unstable. DGGE bands’ profiles were generated for the samples the temporal changes were graphed in Fig. 2. Most microbiota detected in this experiment was intestinal microflora. Characteriza- tion of the microflora appears in Table 3. Among the bands, bands 6, 13, 14, 15 and band 23 remained stable over 8 weeks in all lanes. These bands had a high sequence homology to uncultured Firmicutes bacterium (band 6), Faecalibacterium prausnitzii (band 13), uncultured bacterium (band 14), Morganella morganii (band 15) and uncultured Bacteroidales bacterium (band 23).

Pseudomonas aeruginosa (band 1) was a dominant band at

(6)

A

B

C

Fig. 2. Temporal stability of the microflora in intestine. Bands of DGGE patterns were digitized by using Image J pro- gram (http://rsbweb.nih.gov/ij). Symbol ‘●’ means in- tensity of band at 0 week during chemotherapy treat- ment in gastric cancer patients. Symbol ‘○’ means in- tensity of band at 2 week during chemotherapy treat- ment in gastric cancer patients. Symbol ‘▼’ means in- tensity of band at 8 week during chemotherapy treat- ment in gastric cancer patients.

the middle of the profile. Escherichia coli (band 2), uncultured gamma Proteobacteria (band 3), uncultured bacteria (band 10), Vibrio sp. (band 12), uncultured Faecalibacterium sp. (band 17), Helicobacter apodemus (band 20) and Citrobacter sp. (band 21) bands appeared as results of chemotherapy treatment in a time-dependent manner. Bands 4, 5, 22 and 24 were related to Citrobacter sp., Stenotrophomonas maltophilia, un- cultured Firmicutes bacterium and uncultured alpha Proteo- bacterium, respectively.

Remarkably, the bands of uncultured bacterium (band 18) and uncultured Escherichia sp. (band 19) significantly de- creased during the treatment with anticancer agents.

However, the bands related to Sphingomonas paucimobilis (band 7), Lactobacillus gasseri (band 8), Parabacteroides dis- tasonis (band 9), uncultured bacterium (band 11) and Enterobacter sp. (band 16) were increased.

Lactobacillus gasseri, Pseudomonas aeruginosa and Escherichia

coli are normal flora found in human intestines. It has been reported that a side effect of chemotherapy is diarrhea, which is related to Faecalibacterium prausnitzii and Morganella morganii. Increases in that microflora with chemotherapy were indeed observed in the stool samples.

Diversity of Lactobacillus and Bifidobacterium in fecal samples using DGGE

Bacteria of the genus Lactobacillus and Bifidobacteria genus are widely used as probiotics because they interact with both host and intestinal microbiota [17], which were an abundant group; it is important to analyze the role they play to balance the gut ecosystem.

The Lactobacillus genus forms a biofilm on the intestinal epithelium [21]. We observed PCR-DGGE profiles of the Lactobacillus sp. found in fecal samples of two patients. The Lacobacillus specific primer set of Lac-159F (GC) and Lac- 677R resulted in amplicons for fecal samples, and DGGE analysis of the PCR-amplified 16S rDNA fragments revealed identical profiles for both samples (data not shown). Some DGGE bands were not specifically identified, indicating Lactobacillus-like species, but obtained from amplicons using Lacobacillus specific primers. These results might be because the species were below the detection limit or absent. Six bands were identified as Lactobacillus pantheris, Lactobacillus ruminis, and uncultured Lactobacillus sp. through the se- quence database (Table 3).

Bifidobacterial species-specific primers were used to am- plify a fragment of the 16S rDNA gene (data not shown).

These amplicons served as template DNA for the V1-V3 pri- mer combination V1F and V3R during a second PCR step.

The high mobility of the PCR products is due to the G+C content of bifidobacterium. DGGE of rDNA gene amplicons revealed that there were four bands identified as Bifidobacte- rium pseudolongum subsp. and Bifidobacterium dentium, Aster- ionellopsis glacialis and uncultured Bifidobacterium sp. (Table 4). Two of the bands were from a uncultured bacterium.

Epidemiological and experimental studies showed that in-

gestion of certain lactic cultures, such as Lactobacillus and

Bifidobacterium, or their fermented dairy products, reduce the

risk of certain types of cancer and tumor growth [18]. It has

been reported that in Japan, the incidence of colon cancer

was lowest when the colonic populations of Bifidobacteria

were highest and diarrhea-inducing Clostridium perfringens

was lowest [9]. Therefore, if the population of Lactobacillus

and Bifidobacterium is enriched in cancer patient’s intestine

(7)

Table 4. Identification of DGGE bands using Bifidobacterim-specific primers

Closest relative % identity GenBank Accession No. Temporal change

Uncultured bacterium Asterionellopsis glacialis

Bifidobacterium pseudocatenulatum Uncultured bacterium

Bifidobacterium dentium Bifidobacterium dentium

87.9 97.6 97.2 90.6 84.5 87.2

DQ 648000 FJ 002234 AB 507148

EF 51093 AB 507095 GQ 179694

Up Up Down Down NC NC

*NC : not changed

with some administration, the efficacy will be increased for ongoing cancer diseases.

Discussion

The present study using molecular profiling of bacterial 16S rDNA genes, we found that dominant species of human fecal microbiota were markedly modulated within 0 to 8 weeks of treatment with anticancer agents. We demonstrated that PCR-DGGE can be used to monitor the successive mi- crobiota populations in the intestinal tracts of gastric cancer patients undergoing chemotherapy. Bands in the DGGE pro- files were identified by analyzing part of the 16S rDNA se- quence and comparing the sequences through the use of RDP databases [23]. The levels of similarity ranged from 86.8% to 100.0%. It was possible that the levels of similarity can change somewhat when the complete sequences are compared, even though finding the same closest relatives and the same levels of similarity between partial and com- plete sequences.

Colonization describes a bacterial population in the gas- trointestinal tract that remains stable in size, with no need for periodic reintroduction of bacteria by oral doses or other means. This implies that colonizing bacteria multiply in a given intestinal niche at a rate that equals or exceeds their rate of washout or elimination from that site. Normal colo- nization of the human intestine is a complex ecosystem [15].

Bifidobacteria and Escherichia coli are predominant bacteria, followed by Streptococcus, Lactobacillus, Bacteroides and Gram- positive bacteria, all in similar quantities. In the patients who participated in the present study, the identities of many of the dominant bands in the DGGE profiles were consistent with some of these patterns of succession.

Anticancer agents, such as cisplatin, oxaliplatin and 5-flur- ouracil, are very commonly used to treat cancer without tak- ing into consideration their impact on gut microbiota. Most

studies of the relationship between normal microbiota and chemicals have been done in patients undergoing decon- tamination procedures for intestinal surgery. The studies have reported a decrease in anaerobes and aerobes and an increase in yeast and E. coIi. One of the most common side effects that arise during chemotherapy is an overgrowth of Clostridium sp.. This bacterium induces diarrhea and pseudo- membranous colitis, conditions associated with Clostridium sp. that have outbreaks with a high rate of mortality in hos- pitalized patients. However, that microflora was not de- tected in our patients’ feces.

Despite several advances in the treatment of gastric can- cer, the therapeutic outcome of the malignancy has posed a significant challenge to modern medicine. In previous studies, ingestion of cultures of lactic acid-producing bac- teria, such as Lactobacillus and Bifidobacterium, already pres- ent in human intestine, inhibited tumor incidence and diar- rhea-induced imbalances of microbiota in the intestinal eco- system [2, 6].

DGGE of PCR-amplified rDNA gene amplicons is a useful technique for monitoring dynamic changes in mixed bacte- rial populations over time. All of the rDNA gene sequences from bacterial species in a mixed culture were first amplified using conserved bacterial primers that bracket a hyper- variable region of the rDNA gene, producing amplicons of the same sizes, but with different sequences that are specific for a given species. DGGE allows separation of these amplicons, producing a ‘molecular fingerprint’ of the bacterial species.

In conclusion, we demonstrated that PCR-DGGE is a

powerful tool for monitoring the effects of chemotherapy ad-

ministration in gastric cancer patients’ gut ecosystems. The

recent development and application of genus-specific pri-

mers for intestinal microbes in combination with DGGE ex-

pand the potential of this technique for detection of specific

populations in some ecosystems.

(8)

Acknowledgement

This work was supported by a 2-year Research Grant of Pusan National University.

References

1. Alvaro, E., Andrieux, C., Rochet, V., Rigottier-Gois, L., Lepercq, P., Sutren, M., Galan, P., Duval, Y., Juste, C. and Dore, J. 2007. Composition and metabolism of the intestinal microbiota in consumers and non-consumers of yogurt. Br.

J. Nutr. 97, 126-133.

2. Barbut, F. and Meynard, J. L. 2002. Managing antibiotic as- sociated diarrhoea. BMJ. 324, 1345-1346.

3. Dar, S. A., Kuenen, J. G. and Muyzer, G. 2005. Nested PCR-denaturing gradient gel electrophoresis approach to determine the diversity of sulfate-reducing bacteria in com- plex microbial communities. Appl. Environ. Microbiol. 71, 2325-2330.

4. Domann, E. 2003. Culture-independent identification of pathogenic bacteria and polymicrobial infections in the geni- tourinary tract of renal transplant recipients. J. Clin.

Microbiol. 41, 5500-5510.

5. Donskey, C. J., Hujer, A. M., Das, S. M., Pultz, N. J., Bonomo, R. A. and Rice, L. B. 2003. Use of denaturing gra- dient gel electrophoresis for analysis of the stool microbiota of hospitalized patients. J. Microbiol. Methods 54, 249-256.

6. Fuentes, S., Egert, M., Jimenez-Valera, M., Ramos-Cormen- zana, A., Ruiz-Bravo, A., Smidt, H. and Monteoliva-Sanc hez, M. 2008. Administration of Lactobacillus casei and

Lactobacillus plantarum affects the diversity of murine in- testinal lactobacilli, but not the overall bacterial community structure. Res. Microbiol. 159, 237-243.

7. Gillan, D. C. 2004. The effect of an acute copper exposure on the diversity of a microbial community in North Sea sediments as revealed by DGGE analysis--the importance of the protocol. Mar. Pollut. Bull. 49, 504-513.

8. Kaufmann, P., Pfefferkorn, A., Teuber, M. and Meile, L.

1997. Identification and quantification of Bifidobacterium species isolated from food with genus-specific 16S rRNA- targeted probes by colony hybridization and PCR. Appl.

Environ. Microbiol. 63, 1268-1273.

9. Kubota, Y. 1990. Fecal intestinal flora in patients with colon adenoma and colon cancer. Nihon. Shokakibyo. Gakkai. Zasshi.

87, 771-779.

10. Li, M., Gong, J., Cottrill, M., Yu, H., de Lange. C., Burton, J. and Topp, E. 2003. Evaluation of QIAamp DNA Stool Mini Kit for ecological studies of gut microbiota. J. Microbiol.

Methods 54, 13-20.

11. Manninen, T. J., Rinkinen, M. L., Beasley, S. S. and Saris, P. E. 2006. Alteration of the canine small-intestinal lactic acid bacterium microbiota by feeding of potential probiotics.

Appl. Environ. Microbiol. 72, 6539-6543.

12. Martin, R., Heilig, H. G., Zoetendal, E. G., Jimenez, E., Fernandez, L., Smidt, H. and Rodriguez, J. M. 2007.

Cultivation-independent assessment of the bacterial diver- sity of breast milk among healthy women. Res. Microbiol.

158, 31-37.

13. Matto, J., Maunuksela, L., Kajander K, Palva, A., Korpela, R., Kassinen, A. and Saarela, M. 2005. Composition and tem- poral stability of gastrointestinal microbiota in irritable bow- el syndrome--a longitudinal study in IBS and control subjects. FEMS Immunol. Med. Microbiol. 43, 213-222.

14. Murray, A. E., Hollibaugh, J. T. and Orrego, C. 1996. Phylo- genetic compositions of bacterioplankton from two California estuaries compared by denaturing gradient gel electro- phoresis of 16S rDNA fragments. Appl. Environ. Microbiol.

62, 2676-2680.

15. Nielsen, S., Nielsen, D. S., Lauritzen, L., Jakobsen, M. and Michaelsen, K. F. 2007. Impact of diet on the intestinal mi- crobiota in 10-month-old infants. J. Pediatr. Gastroenterol Nutr. 44, 613-618.

16. Picard, C., Fioramonti, J., Francois, A., Robinson, T., Neant, F. and Matuchansky, C. 2005. Review article: bifidobacteria as probiotic agents -- physiological effects and clinical benefits. Aliment Pharmacol. Ther. 22, 495-512.

17. Saxelin, M., Tynkkynen, S., Mattila-Sandholm, T. and de Vos, W. M. 2005. Probiotic and other functional microbes:

from markets to mechanisms. Curr. Opin. Biotechnol. 16, 204- 211.

18. Singh, J., Rivenson, A., Tomita, M., Shimamura, S., Ishibashi, N. and Reddy, B. S. 1997. Bifidobacterium longum, a lactic acid-producing intestinal bacterium inhibits colon cancer and modulates the intermediate biomarkers of colon carci- nogenesis. Carcinogenesis 18, 833-841.

19. Smalla, K. 2007. Bacterial diversity of soils assessed by DGGE, T-RFLP and SSCP fingerprints of PCR-amplified 16S rRNA gene fragments: do the different methods provide similar results? J. Microbiol. Methods 69, 470-479.

20. Stebbings, S., Munro, K., Simon, M. A., Tannock, G., Highton, J., Harmsen, H., Welling, G., Seksik, P., Dore, J., Grame, G.

and Tilsala-Timisjarvi, A. 2002 Comparison of the faecal mi- croflora of patients with ankylosing spondylitis and controls using molecular methods of analysis. Rheumatology 41, 1395-1401.

21. Thompson-Chagoyan, O. C., Maldonado, J. and Gil, A. 2007.

Colonization and impact of disease and other factors on in- testinal microbiota. Dig. Dis. Sci. 52, 2069-2077.

22. Vannucci, L., Stepankova, R., Kozakova, H., Fiserova, A., Rossmann, P. and Tlaskalova-Hogenova, H. 2008. Colorectal carcinogenesis in germ-free and conventionally reared rats:

different intestinal environments affect the systemic im- munity. Int. J. Oncol. 32, 609-617.

23. Wang, M., Ahrne, S., Jeppsson, B. and Molin, G. 2005.

Comparison of bacterial diversity along the human in-

testinal tract by direct cloning and sequencing of 16S rRNA

genes. FEMS Microbiol. Ecol. 54, 219-231.

(9)

초록:PCR-DGGE를 통해 분석한 항암치료에 따른 장내 미생물 변화

유선녕

1,2

․안순철

1,2

*

(

1

부산대학교 의학전문대학원 미생물학 및 면역학 교실,

2

부산대학교 면역조절치료소재연구인력양성사업단 BB21)

인체의 장내에 존재하는 장내 미생물은 서로 공생 또는 길항 관계를 유지하며 우리 몸의 면역 방어 기전에 중

요한 요소로 작용한다. 본 연구는 항암제가 위암 환자의 장내 미생물 생태계에 미치는 영향을 조사 하였다. 항암

치료를 받는 환자의 분변에서 genomic DNA를 추출하고, 16S rDNA 유전자에 대한 denaturing gradient gel elec-

trophoresis (DGGE)를 수행하였다. 분석된 균주는 개체간의 차이가 있었으나, 대부분 사람의 장내에 살고 있는

normal flora로 동정되었다. 모든 분변에 존재하는 5 개 밴드의 서열 분석 결과에 의하면 Faecalibacterium prausnit-

zii, Morganella morganii 및 Uncultured bacterium sp.가 나타났고, 항암제 처리 후 Sphingomonas paucimobilis,

Lactobacillus gasseri, Parabacteroides distasonis 및 Enterobacter sp.가 증가하였다. 이 연구에서 probiotic으로 알려진

Bifidobacterium과 Lactobacillus 를 특이적 PCR primer를 이용하여 동정한 결과, 항암제 투여로 인해 Bifidobacterium

과 Lactobacillus의 개체군이 현저하게 줄어들어 diarrhea와 같은 부작용의 원인을 예상하게 하며, 장내 생태계의

주요 박테리아 집단에도 중요한 영향을 미치는 것을 알 수 있었다. 이러한 결과는 항암제 투여와 같이 시간의

흐름에 따른 균총의 변화를 시각적으로 모니터링하기 위하여 PCR-DGGE 분석법이 유용하다는 것을 나타낸다.

수치

Table  1.  List  of  primers Primer Sequence  (5’→3’) Bact-011F Bact-1492R Bact-011F(GC) Bact-0536R Bif-26F Bif-3R Bif-0164F(GC) Bif-0662R Lac-0159F(GC) Lac-0677R GC  clamp AGA  GTT  TGA  TCC  TGG  CTC  AG ACG  CGT  ACC  TTG  TTA  CGA  CTT
Fig.  1.  PCR-DGGE  profiles  representing  the  bacterial  diversity  in  fecal  samples
Table  2.  List  of  DGGE  band  profiles
Fig.  2.  Temporal  stability  of  the  microflora  in  intestine.  Bands  of  DGGE  patterns  were  digitized  by  using  Image  J   pro-gram  (http://rsbweb.nih.gov/ij)
+2

참조

관련 문서

Changes in the composition and structure of Mediterranean rokey-shore communities following a gradient of nutrient enrichment: Descriptive study and test

Results: 44 of 1048 patients with gastric cancer(4.1%) had synchronous and metachronous cancers. The average time interval between gastric cancer and secondary primary cancer

We compared the distribution of Acinetobacter species in 95 clinical isolates which were determined by rpoB gene analysis, 16S rRNA gene analysis, and Vitek 2 system..

(a) Nyquist plot of poly (ethylene glycol) mono methyl ether 2000 gel e lectrolyte, (b) Nyquist plot of ACAC-PEG 2000 gel electrolyte.. Comparison of ionic conductivity for

mRNA expression of osteonectin, Runx2 and BSP(bone sialoprotein) in MC3T3-E1 cells cultured for 24 hours on 4 different titanium surfaces.. The mRNA were analyzed

In order to get the feature of pedestrian, a block-by-block histogram is created using the direction of the gradient based on HOG (Histogram of

- flux of solute mass, that is, the mass of a solute crossing a unit area per unit time in a given direction, is proportional to the gradient of solute concentration

Postnatal development of StarD6 immunoreactivities in the rat brain can be summarized as follows; 1) an inside-out gradient of radial emergence.. in the cerebral cortex,