†Corresponding author: Min-Sun Jeon, Dept. of Food and Nutrition, Chungnam National University, 99 Daehak-ro, Yuseong-gu, Daejeon 305-764,
South Korea, Tel. +82-42-821-6836, Fax. +82-42-821-7888, E-mail. [email protected]
The Effect of Mobile Food Delivery Application Usage Factors on Customer Satisfaction and Intention to Reuse
Ye-Eun Song
1, Sang-Hoon Jeon
2and Min-Sun Jeon
1†1
Dept. of Food and Nutrition, Chungnam National University, Korea
2
Dept. of Medical Nutrition, Graduate School of East-West Medical Science, KyungHee University, Korea
ABSTRACT
The number of delivery app users and their social impact have increased along with the number smartphone users. Accordingly, the present study attempted to suggest a method to improve the service quality of delivery apps for relevant businesses and researchers by determining the influences of delivery app usage factors on customer satisfaction and reuse intention. The present study distributed and collected questionnaires through on- and offline surveys targeting males and females in their 20s in the Daejeon area. The results of the regression analysis showed that the influence of delivery app usage factors on customer satisfaction was 43.8%, and informativeness, payment and safety, usefulness, and convenience were found to influence the increased satisfaction with the delivery apps. The influence of delivery app usage factors on customers’ reuse intention was 37.3%, and among the four usage factors, informativeness and payment and safety were found to be the main factors for increasing the reuse intention.
As providing more accurate information is a means to increase customer satisfaction and reuse intention by improving the service quality of the delivery apps, new menus and prices should be rapidly updated.
Keywords: delivery application, customer satisfaction, usage factor, reuse intention
INTRODUCTION
Smartphones can be considered a representative technology that has greatly changed people’s everyday lives. Smartphones have various functions such as a digital camera, games, an MP3 player, and a movie player in addition to the existing functions of mobile phones including making calls and sending and receiving text messages. Further, Internet access is available anywhere, anytime, and various web services and operating system applications can be used (Kim et al., 2011).
The number of smartphone subscribers in South Korea is steadily increasing every year with 40,836,533 subscribers in January 2015 increasing to 43,919,090 subscribers in January 2016 (Ministry of Science, ICT and Future Planning, 2016).
According to a report by the Korea Information Society De- velopment Institute, the smartphone ownership rates of people in their 40s and 50s, which were less than half of the owner- ship rates of people in their 20s and 30s in 2011, have sharply increased to 89.7% and 72.3%, respectively (Jung, 2015).
Along with the expansion of the smartphone market, the
smartphone application market is showing explosive growth,
and its importance as an independent market beyond its
supporting role has been expanding. “App” is an abbreviation
for “application”, and the term includes all software running
on operating systems (Oh et al., 2010). Users can freely
choose apps that offer the functions they want, download them
onto their smartphones, and use them. As communication with
customers has become easier with the appearance of apps such
as Facebook, Twitter, Instagram, and KakaoTalk, the impor-
tance of marketing based on smartphones in the food service
industry is also increasing. Companies promote their brands
through apps to form a bond with customers, and customers
choose food service companies using information obtained
through apps (Lee & Namkung, 2014). A representative example
of marketing using smartphones in this industry is food deli-
very applications (delivery apps). Delivery apps offer services
allowing users to search for a store, select a menu, and make
a payment (Chung & Nam, 2015). With the appearance of
delivery apps, customers can be easily and conveniently pro- vided with their favorite foods regardless of time and place as long as they can afford it (Korea Internet & Security Agency, 2015).
As the number of delivery app users is increasing along with the number of smartphone users, the impact on the food service industry is large, and although many people use these apps, research on the service quality and customer satisfaction of delivery apps is not sufficient. Accordingly, the present study attempts to suggest a method for relevant businesses and researchers to improve the service quality of delivery apps by determining the influences of service quality factors of deli- very apps on customer satisfaction and reuse intention.
LITERATURE REVIEW
Current State of Delivery Apps
The demand for quick and convenient delivery food and the frequency of dining out are increasing owing to economic development and women’s economic activity (Kim et al., 2011). As the smartphone penetration rate began to increase and apps with various functions appear, delivery apps, which enable food ordering using smartphones, also appeared. Deli- very apps are applications that allow users to find restaurants located around them easily using the smartphone location information (Chatterjee, 2001). The advantages of delivery apps are that users can be provided with information about deliverable food in the area the user desires, and ordering and making payment are convenient once the app is installed on the mobile device (Ko, 2016).
The three major delivery apps in South Korea are “Baedal- ui minjog”, “Yogiyo” and “Baedaltong”. Baedaltong was the first delivery app service in South Korea, launching in April 2010, and maintains relatively low fees, unlike the other deli- very apps, by introducing automatic text and voice conversion technology and using an order-taking system that does not go through a call center and POS terminal. In addition, it has received positive responses from users for its policy of co- prosperity with small businesses rather than using TV co- mmercials (Kim, 2014).
Baedal-ui minjog started its services with the development of an application for iPhones in June 2010, and it took first
place in market share (60%) in October 2014. It has increased its recognition by improving convenience through various payment methods, increased satisfaction and re-purchase in- tention with unique services and marketing, and incorporated a marketing strategy that supports various programs, “My store CF”, which produces an advertisement for free (Jung, 2015). It has received positive responses from its users and business owners by providing various services “Let's learn together”, a recent service that teaches business owners who use Baedal-ui minjog how to use computer programs for free (Lee, 2015).
Yogiyo increased its recognition by making the biggest investment in advertising among the three representative deli- very app companies. Yogiyo was founded in South Korea in 2012 by “Delivery Hero”, the largest delivery food ordering service company in Europe. Based in Germany, it was esta- blished by Niklas Östberg from Sweden in 2011. It has branches not only in South Korea but also in many other countries around the world like China, the United Kingdom, Australia, and Mexico. Yogiyo uses a self-developed automatic order transmission system in which the restaurant receives an order once a user places it and makes payment through the smartphone app. The order information is then transmitted to the terminal in the restaurant, and to the owner of the restau- rant and the delivery person’s mobile phones (Kim, 2014).
Separate from the rapid growth of delivery apps, however, issues of high fees have been continuously raised by delivery businesses and users. According to a survey by the Korea Women’s Federation for Consumers, consumers are worried about lower service quality or higher food prices due to the reduction in revenue caused by high fees, and for that reason, some users just check the phone number in the delivery app and call the restaurant directly. As such, high fees have been continuously pointed out as an issue, and as competitors emerge, the major delivery apps have lowered their fees to 2.5 ∼12.5%
(Korea Internet & Security Agency, 2015).
Usage Factors of Delivery Apps
The methods of obtaining information about restaurants and
menus are diverse when a customer wants to order food, and
the criteria for choosing a method also vary depending on the
customers. According to a report by Cha (2015), while the
ratio of those searching for information about delivery food using the Internet or delivery apps is relatively high for people in their 20s, the ratio of Internet and delivery app use decreases with age, while the use ratio of flyers and local information booklets increases. In particular, delivery apps have the advantage of obtaining information wherever the user is without restrictions of time and place as long as the Internet is connected. Further, many users in their 20s are proficient in using the Internet and smartphones (Kim, 2014). In addition, being able to transmit promotional information including sales events, new menu tasting events, and coupons to customers immediately is considered an advantage (Kim et al., 2011).
Baedal-ui minjog offers different sales every Thursday, Friday, and Sunday, and Yogiyo has provided events offering various benefits such as photo review events through which points are rewarded (Choi, 2015). The reliability of information has been pointed out as a shortcoming, however, and considering that 34% of respondents in a study on the reasons for not using delivery apps said they do not use delivery apps because they
“do not trust” them (Cha, 2015), it can be seen that reliability has a large influence on the use of delivery apps. To solve this issue, Yogiyo introduced a function called “Clean Review”
in which only customers who have ordered can write a review, thus increasing the reliability of business information (Yogiyo, 2016).
While Baedal-ui minjog, which is one of the three major domestic delivery apps, increased customer approachability with various payment methods such as credit cards, payment through the mobile phone, OK cashback, company points, and coupons, the company introduced an integrated point system in which points can be saved regardless of menus and use of external points (Baemin, 2016). According to a survey by the Korea Consumer Agency on the safety of delivery apps, how- ever, more than 75% of users of smartphone apps, including delivery apps, are worried about personal information leakage without their consent (Chung & Nam, 2015). In fact, since the personal information leakage of Baedaltong customers through hacking in December 2014, the importance of protec- ting personal information has been emphasized (Lee, 2015).
Delivery apps provide information about delivery food vendors in the area near the consumer using the location in- formation system or the area the consumer desires, and the
advantages of the delivery apps are their usefulness and con- venience-in that they offer a wider range of choices than do fliers-and that ordering is simple (Ko, 2016). According to a survey (Cha, 2015) related to the perception of delivery food and delivery apps, the reasons for using delivery apps are, in the order of the magnitude of influence on the use of delivery apps, possibility to go from searching to paying at once, benefit of discounts including coupons, ease of acquiring information, and convenience of use. Recently, the delivery app market has been significantly growing in China as well, and the reasons for the growth are that various menus can be ordered from-not only large chain stores but also small restaurants-and that users are able to enjoy discount benefits (Choi, 2015). Another study stated that the biggest reason for the popularity of food services apps is the map search function that finds restaurants closest to the customer (Kim et al., 2011). Therefore, the present study considered informativeness, payment and safety, and usability as the usage factors of delivery apps and attemp- ted to determine their influences on customer satisfaction and reuse intention.
Customer Satisfaction
Customer satisfaction, a marketing concept that invariably receives attention, directly affects the creation of business pro- fits as well as consumer behaviors (Cho et al., 2006; Lee, 2000; Kim & Oh, 2002). According to a National Customer Satisfaction Index (NCSI) report, the most influential factor on the demand curve of products or services is not quality, which represents engineering standards, but customer satisfac- tion, which is a subjective evaluation by customers. In addition, customer satisfaction requires actual consumption experience by the customer, and because the customer will purchase the product or service again if the customer is satisfied, customer satisfaction greatly influences demand (Korea Productivity Center, 2011). To increase customer satisfaction, corporations can either improve the objective quality of their service or in- crease the level of perceived quality by improving consumers’
perception of the service quality through promotions (Song, 2000).
Customer satisfaction is defined either based on consump- tion experience or by focusing on the evaluation process.
Howard and Sheth (1969), who defined customer satisfaction
based on consumption experience, stated that customer sa- tisfaction is a cognitive status in which the customer feels compensated for the price, while Oliver (1980) defined satis- faction as the psychological status achieved when a consumer’s expectation is different from the consumer’s previous emo- tions related to the consumption experience. In addition, Kim et al. (2010) argued that product and services that satisfy customers contain characteristics that satisfy customers’ desires.
Johnson and Fornell (1991) defined customer satisfaction as a comprehensive evaluation of services provided, and another previous study (Dutton et al., 1994) stated that when a company has higher customer satisfaction than its competitors, the effects of both competitive advantage and corporate brand image improve because of the word of mouth effect. Hellier et al. (2003) defined customer satisfaction as the degree of overall enjoyment or satisfaction customers feel from the results of service performance, that is, how well the service satisfies the expectations and needs of customers.
Looking at other previous studies that presented different points of views on customer satisfaction, Fornell (1992) stated that high customer satisfaction improves customer loyalty, reduces price sensitivity, prevents existing customers from defecting, reduces the cost of marketing failure, brings in new customers through cost reduction, and improves corporate reputation. Ko et al. (2008) stated that service quality influen- ces customer value, and that customer satisfaction increases as the customer feels the value of the provided service is higher. In another study, analysis of the influences of customer value, customer satisfaction, and behavior intention showed that customer value positively influences customer satisfaction and behavior intention, and customer satisfaction also influ- ences behavior intention (Hyun & Han, 2009). Accordingly, the present study sets the following research hypothesis and tests it.
H1: The usage factors of delivery apps will influence customer satisfaction.
Reuse Intention
Reuse intention means that the customer uses a product or service more than twice and has an intention to inform other consumers of the use experience through communication with
friends and acquaintances, testimonials, or a social network service (SNS) (Choi & Choi, 2011). According to a study by Jun and Chung (2006), customers experience satisfaction or dissatisfaction with a product or service they purchased based on their expectations before the purchase, which determines the repurchase intention. Kim and Oh (2002) stated that the intention to repurchase a service indicates the possibility of using the service provider repeatedly in the future, and created an index representing customer loyalty.
Reuse intention is an important part of explaining customer loyalty, and customer loyalty is more comprehensive than the concept of customer satisfaction. It is not a concept that can be understood based on a single aspect of behavior or attitude, but should consider both behavior and attitude (Choi, 2014).
In particular, because it is difficult to evaluate a service customers have not used in the food service industry, the ten- dency to use a known service is high, and as the competition among businesses becomes fiercer, retaining existing customers became more important than attracting new customers. Busi- nesses that can retain a certain number of customers thanks to high customer loyalty can secure a stable source of revenue (Korea Productivity Center, 2011). For this reason, businesses are trying to enhance customer loyalty through repurchase and reuse in order to prevent customer defection and increase the retention ratio by maintaining high customer loyalty.
The crucial factors that influence customers’ reuse intention are customer satisfaction and dissatisfaction. Customers con- sider the utility they can obtain from products or services when they purchase them, and customers satisfied with their purchased products or services have fewer complaints and repurchase them or tend to recommend them to others (Korea Productivity Center, 2011). As such, if a customer purchases a product or service from a certain business, it can be con- sidered from the business’s position that the business will secure a large profit because the business can expect continued revenue without a large investment in the future. In particular, if a customer becomes a regular customer because of increased repurchase intention, it is possible to create long-term demand (Park, 2011). Ji (2014) found that usage factors such as a beauty shop reservation system and the quality of added ser- vices influence customer satisfaction and reuse intention.
According to the previous studies reviewed thus far, it can
be seen that the loyalty of customers who are satisfied with the product or service of a business increases, which leads to reuse. Accordingly, the present study sets the following re- search hypothesis based on previous studies to determine the influences of delivery app usage factors on customers’ reuse intention.
H2: The usage factors of delivery apps will influence customers’ reuse intention.
RESEARCH METHODS
Subjects and Survey Period
The present study utilized a convenient sampling method for data collection because it is exploratory research. On- and off-line questionnaires were distributed to people in their 20s in the Daejeon area for one month from May 14 to June 15, 2015. According to Riva et. al. (2003), web-based data collec- tion does not statistically diminish the validity of the test and the consistency of responses, and there are not large differences in response sets between online and offline participants. For the online questionnaire, the survey contents were composed using OzSurvey, and it was possible for participants to par- ticipate in the survey by clicking on a URL distributed through e-mail or smartphones. The off-line survey was carried out by directly distributing questionnaires to the participants and collecting them as soon as they completed their responses.
A total of 414 people participated in the online survey, and after excluding 202 insincere or incomplete responses, a total of 211 (51.2%) questionnaires were used in the analysis. In the case of the offline survey, a total of 355 questionnaires were distributed and all of them were collected. After exclu- ding insincere or incomplete responses, 191 (53.8%) offline questionnaires were used in the analysis. Therefore, a total of 402 questionnaires, 211 (52.5%) online and 191 (47.5%) offline, were used in the statistical analysis.
Composition of the Questionnaire
The questionnaire used in the present study was based on previous studies (Son, 2013; Kim, 2010; Gil, 2011) and modi- fied to fit the need of the present study. The questionnaire items comprised nine usage pattern items, 17 purchase attri-
bute items, 22 usage factor items, three satisfaction items, four reuse intention items, and seven general items; among those, items on usage pattern, purchase attributes, usage factors, satisfaction, and reuse were measured using a five-point Likert scale. A five-point Likert scale was chosen because having lesser number of scale points makes it easier to carry out the survey. According to a previous study (Choudhury & Bhatta- charjee, 2014), the values of average coefficient of variation for 5 to 7-point do not differ significantly from each other, and an increment of reliability in the number of scale points is not significant in studying the consumer behavior.
Statistical Analysis
The present study conducted statistical analysis to analyze the influence of the service quality of delivery apps on cus- tomer satisfaction and reuse intention. Frequency analysis was performed to determine the general characteristics of the respondents. Factor analysis was conducted to test validity of measurement instrument for each construct, and the internal reliabilities was estimated through Cronbach’s α. Also, a stan- dard multiple regression analysis was conducted to determine the influence of delivery app usage factors on customer sa- tisfaction and reuse intention.
RESESULTS
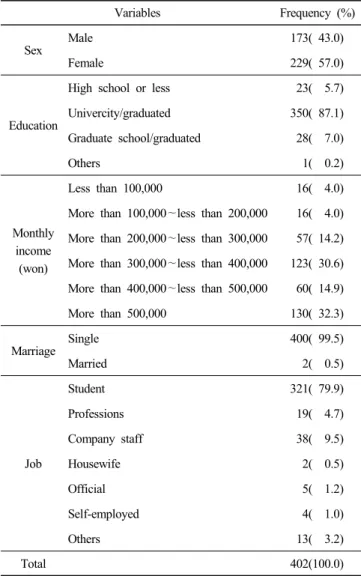
Demographic Characteristics of the Respondents The general characteristics of the survey participants are shown in The survey participants were 43.0% (173) male and 57.0% (229) female. Their education level in the order of highest to lowest frequency was university graduates (or in university) 87.1% (350), in or graduated from graduate school 7.0% (28), and high school graduates 5.7% (23). Their income distribution in the order of highest to lowest frequency was, all in KRW, 500 thousand or more 32.3% (130), from 300 to less than 400 thousand 30.6% (123), and from 400 thousand to less than 500 thousand 14.9% (60).
Tests of Reliability and Validity of the Measurement Items
An exploratory factor analysis was conducted to test the
reliability and validity of each item used in the research ana-
lysis; the results are shown in Table 2. For each factor, only
Table 1. Demographic information
Variables Frequency (%)
Sex
Male 173( 43.0)
Female 229( 57.0)
Education
High school or less 23( 5.7)
Univercity/graduated 350( 87.1)
Graduate school/graduated 28( 7.0)
Others 1( 0.2)
Monthly income
(won)
Less than 100,000 16( 4.0)
More than 100,000∼less than 200,000 16( 4.0) More than 200,000∼less than 300,000 57( 14.2) More than 300,000∼less than 400,000 123( 30.6) More than 400,000∼less than 500,000 60( 14.9)
More than 500,000 130( 32.3)
Marriage
Single 400( 99.5)
Married 2( 0.5)
Job
Student 321( 79.9)
Professions 19( 4.7)
Company staff 38( 9.5)
Housewife 2( 0.5)
Official 5( 1.2)
Self-employed 4( 1.0)
Others 13( 3.2)
Total 402(100.0)
items with a factor loading equal to or greater than 0.5 were selected. Lastly, there were four usage factors: informative- ness, payment and safety, usefulness, and convenience. Six questions for informativeness, six questions for payment and safety, four questions for usefulness, two questions for con- venience, three questions for customer satisfaction, and four questions for reuse intention were extracted. Although usability was initially examined as one usage factor, the factor analysis extracted it as the separate factors of usefulness and conve- nience. In addition, since the overall reliability was high, with all Cronbach’s alpha values for the measurement items greater than 0.70 as suggested by Nunnally (1978), the measurement scale used in the present study can be determined to have validity and reliability.
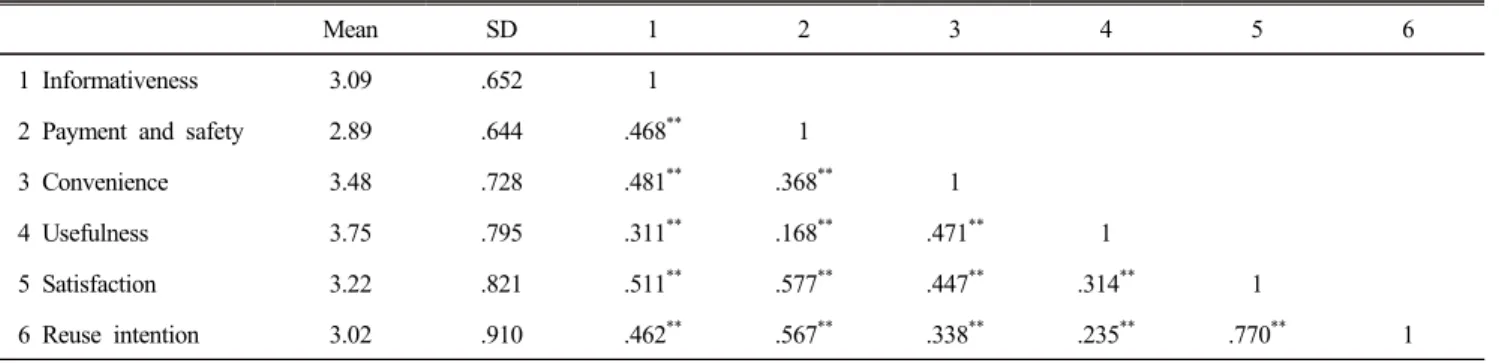
Correlation between dependent variable, customer satisfaction
and reuse intention and independent variables, informativeness, payment and Safety, usefulness, convenience had been shown in Table 3. Customer satisfaction and reuse intention about food delivery app is correlated with each independent variable (p<0.01). Furthermore, according the correlation analysis, the maximum correlation between the independent variables were .481, and multicollinearity had been proven to be absent among independent variables. The correlation between independent variables should be ≤0.9 as an assumption of absence of mul- ticollinearity (Pallant, 2013).
Hypothesis Test
1) The Influence of Delivery App Usage Factors on Customer Satisfaction
Table 4 below shows the results of the multiple regression analysis conducted to determine the influence of informative- ness, payment and safety, usefulness, and convenience, which are the delivery app usage factors, on customer satisfaction.
The influence of delivery app usage factors on customer satisfaction was 43.8% (R
2=0.438, modified R
2=0.433), and informativeness (t=4.621, p<0.001), payment and safety (t=
9.258, p<0.001), usefulness (t=3.003, p<0.01), and conveni- ence (t=2.440, p<0.01) were all found to influence satisfaction with delivery apps. Therefore, hypothesis 1 is proven because all four delivery app usage factors as analyzed have the effect of increasing customer satisfaction.
2) The Influence of Delivery App Usage Factors on Customers’ Reuse Intention
Multiple regression analysis was conducted to determine the
influence of informativeness, payment and safety, usefulness,
and convenience, which are the delivery app usage factors, on
customers’ reuse intention; the results show that a positive
evaluation of the usage factors influences reuse intention for
delivery apps (Table 5). The influence of delivery app usage
factors on reuse intention for delivery apps was 37.3% (R
2=
0.373, modified (R
2=0.366), and among the four usage factors,
informativeness (t=4.204, p<0.001) and payment and safety
(t=9.381, p<0.001) were found to be important factors for
increasing reuse intention. Therefore, hypothesis2, which stated
that delivery app usage factors will influence reuse intention,
Table 2. Test of validity and reliability of measurement items
Factor Factor
loading Eigen value
Variance explained (%)
Cronbach’s alpha
Usage factor
Information
Delivery apps provide accurate information. 0.750
3.461 33.449 0.857
Delivery apps provide reliable information. 0.778
Delivery apps quickly update new information. 0.616 Delivery apps provide useful and relevant information. 0.734
Delivery apps provide detailed information. 0.767
Delivery apps show information in an appropriate configuration. 0.633
Payment and safety
Payment is convenient when a delivery app is used. 0.549
2.886 46.137 0.776
It is relatively inexpensive to use a delivery app. 0.736
It feels safe to use a delivery app. 0.653
Various discuont benefit are offered when a delivery app is used (such as mileage deposit, coupon provision, discount). 0.704 The personal information entred is safe when using a delivery app. 0.654 The promised service is always provided when using a delivery app. 0.612
Usefulness
It is easy to order using a delivery app. 0.525
2.536 55.030 0.791
The configuration of delivery apps makes it convenient to find a
restaurant. 0.677
Various kinds of restaurants can be accessed when a delivery app is
used. 0.804
Various menus can ve accessed when a delivery app is used. 0.815
Convenience
Delivery apps can be used when needed. 0.818
2.110 61.069 0.790
Delivery apps are easy to connect from the required place. 0.851 Kaiser-Meyer-Olkin(KMO)=0.848, Bartlett test of spehricity=3018.68, Sig=0.000
Satisfaction
I am overall satisfied with the delivery app I am currently using. 0.915
2.359 78.628 0.860
I am satisfied with the food or service ordered through the delivry app. 0.863 I will continue to use the delivery app I am currently using. 0.881
Kaiser-Meyer-Olkin(KMO)=0.719, Bartlett test of sphericity=585.689, Sig=0.000
Reuse intention
I intend to order food again throuh the delivery app. 0.886
3.044 76.094 0.895
I will recommend the use of a delivery app to others. 0.867 I will use the delivery app more frequently. 0.883 I will preferentially consider the use of the delivery app I am using
over other delivery apps. 0.853
Kaiser-Meyer-Olkin(KMO)=0.835, Bartlett test of spehricity=935.483, Sig=0.000
was partially proven.
Responses to Questions on Improvements to be Made The top response (39 participants) to the questions on areas
for improvement of delivery app services was to improve the
excessive service and advertisement fees the delivery app
companies charge business owners. The response was based
on the concern that consumers could suffer damages such as
Table 3. Pearson's correlation coefficients of variables
Mean SD 1 2 3 4 5 6
1 Informativeness 3.09 .652 1
2 Payment and safety 2.89 .644 .468
**1
3 Convenience 3.48 .728 .481
**.368
**1
4 Usefulness 3.75 .795 .311
**.168
**.471
**1
5 Satisfaction 3.22 .821 .511
**.577
**.447
**.314
**1
6 Reuse intention 3.02 .910 .462
**.567
**.338
**.235
**.770
**1
**
Significant at p<0.01 (two-way).
Table 4. Influence of delivery app usage factors on custo- mer satisfaction
Independent variables SE β
tTolerance
Constant 0.204 —0.442
Informativeness 0.059 0.215 4.621
***0.657 Payment and safety 0.056 0.405 9.258
***0.753 Usefulness 0.054 0.143 3.003
**0.630 Convenience 0.045 0.106 2.440
*0.764 R=0.662, R
2=0.438, Modified R
2=0.433, F-value=76.694, p=0.000,
Durbin-Watson=2.111 Dependent variable: Customer satisfaction.
*
p-value<0.05,
** p-value<0.01, *** p-value<0.001.Table 5. Influence of delivery app usage factors on custo- mers’ reuse intention
Independent variables SE β
tTolerance
(Constant) 0.241 —.0.665
Informativeness 0.070 0.209 4.204
***0.650 Payment and safety 0.066 0.438 9.381
***0.737
Usefulness 0.064 0.037 0.733 0.636
Convenience 0.053 0.71 1.546 0.773
R=0.610, R
2=0.373, Modified R
2=0.366, F-value=57.930, p=0.000, Durbin-Watson=1.970
Dependent variable: Customer satisfaction.
*** p-value<0.001.