¶ Corresponding Author: Min-Sun Jeon, Dept. of Food and Nutrition, Chungnam National University, 99 Daehak-ro, Yuseong-gu, Daejeon 305-764, South Korea, Tel. +82-42-821-6836, Fax. +82-42-821-7888, E-mail: [email protected]
Culinary Science & Hospitality Research. 2016;22(6):1-13.
https://cshr.jams.or.kr/ ISSN 2466‐0752 (Print) ISSN 2466‐1023 (Online)
The Effects of Restaurant and LOHAS Images on Customer Satisfaction and Loyalty: Focusing on the Incremental Information Content of LOHAS Image
Dong-Jin Kim1, Young-Ja Kim1 and Min-Sun Jeon2
1Dept. of Food Service Industry, Yeungnam University, Korea
2¶Dept. of Food and Nutrition, Chungnam National University, Korea
ABSTRACT: Since protecting the environment became a major issue in modern society, an increasing number of individuals have engaged in lifestyles of health and sustainability (LOHAS). The purpose of this study is to investigate the effects of restaurant and LOHAS images on customer satisfaction and loyalty. Particularly, this study analyzes the incremental information content of LOHAS image in the rela- tionship between restaurant image and customer satisfaction/loyalty. A self-administered questionnaire was distributed to customers of casual-dining restaurants in three major cities (i.e., Seoul, Daegu, and Busan) in South Korea. The empirical findings suggest significant incremental information content of LOHAS image beyond general restaurant image in explaining customer satisfaction and loyalty.
Keywords: restaurant image, lifestyle of health and sustainability (LOHAS), customer satisfaction, customer loyalty, hierarchical regression analysis
INTRODUCTION
An image emphasizing a sense of sustainability and health has become a strategic issue for the hos- pitality industry. In the US, the resources used by ca- sual-dining restaurants for developing and imple- menting sustainable practices showed a steep in- crease from 23 % in 2008 to 43% in 2009[1]. In addi- tion, a 2011 restaurant operator recycling survey found that 65% of restaurant operators answered they have recycling programs in place, and 51% of consumers would be likely to pay a little more at a restaurant that recycles[2].
In South Korea, as the trend of well-being food ex- pands, consumers have expressed an increased inter- est in eco-friendly restaurants. For examples, Benni- gan’s Korea opened an eco-friendly restaurant “Bab
O Ne Kitchen” in October 2010[3], and Cheongmirae, an organic buffet restaurant, experienced a 30% in- crease in profits between 2009 and 2010[4]. Also, some casual-dining restaurants such as Marché, Scar- lett, and Omuto Tomato announced that they plan- ned to employ locally grown vegetables, rice, and beef for their menus and increase the proportion of local food ingredients gradually[5].
However, although environmental inroads have been made in the restaurant industry, it is not easy to improve a valuation or create a “greener” oper- ation in terms of consumer satisfaction and loyalty.
Therefore, adopting the LOHAS concept has become a new marketing fashion to meet consumers’ de- mands. LOHAS is a relatively new concept focused on the environment, health, personal development, and sustainable living and recognized by a relatively
upscale and well-educated population segment[6].
Korean restaurant companies currently invest their limited resources in developing LOHAS practices.
Unfortunately, however, the value of LOHAS image has rarely been recognized as a crucial asset that evokes customers’ positive reactions.
In the competitive restaurant environment, restau- rant image is a determining factor against com- petition. It is generally agreed that restaurant image is positively associated with customer satisfaction and loyalty. However, despite the increasing im- portance of LOHAS, little research has been con- ducted concerning the relationship between LOHAS image and consumers’ reactions such as satisfaction level and loyalty. Therefore, the purpose of this study is to investigate the effects of restaurant and LOHAS images on customer satisfaction and loyalty. Particu- larly, this study analyzes the incremental information content of LOHAS image in the relationship between restaurant image and customer satisfaction/loyalty.
LITERATURE REVIEW
Restaurant Image
The term, corporate image has defined in a num- ber of different ways and the concept has been changed over decades. Bayton[7] defined the corpo- rate image as a corporation’s personality, and Margu- lies[8] described that it is the perception of the com- pany by public. From the 1980s, researchers began to explain the corporate image as the expectation, attitudes, and feelings which people describe and re- member, and they believed that it could be mana- ged by companies[9-11]. Brown and Dacin[12] em- phasized the importance of corporate social respon- sibility for its image. More recently, Cacho- Elizondo and Loussaïef[13] found that a corporate image was certainly affected by the perceived sustainability de- velopment actions. Store image has also been de- fined in different points of view. Store image can be refer to complex perceptions in a store’s character- istic attributes that consumers feel the store different from others[14]. Berman and Evans[15] posited that store image consists of functional and emotional at- tributes formed in a consumers’ perceptual structure.
In addition, Assael[16] defined that store image is a consumer’s total perception of the company’s attrib-
utes from diverse sources such as geographical loca- tion, service, prices, and atmosphere. Moreover, other researchers reported that store image facili- tates the prior knowledge of consumers about serv- ice performance[17].
In the restaurant industry, customer service ge- nerally includes the food, physical provision, the at- mosphere, and service received at a restaurant[18].
Therefore, many studies have used food, physical en- vironment, and services as key components to elicit the restaurant image, and providing high quality of food and service has been accepted as a primary fac- tor of a good restaurant image[19-21]. Jang and Namkung[19] used three dimensions of product, at- mospherics, and service to evaluate restaurant servi- ce quality. Ryu, Han, and Kim[20] also indicated food quality, service quality, interior design and décor, res- taurant location, and wait time as key drivers to build a restaurant image. In addition, Ryu et al[21] defined a restaurant image as the sum of the emotional per- ceptions, ideas, or symbolic attitudes of restaurant customers. That is, a consumer's perception of a res- taurant's image is formed through customer's cumu- lative experiences.
LOHAS Image
Since protecting the environment became a major issue in our society, an increasing number of in- dividuals have engaged in lifestyles of health and sustainability (LOHAS). This segment pursuing LOHAS consumes a broad range of products and services that purport to be environmentally and socially re- sponsible and spends approximately $300 billion each year in the US accounting for nearly 30% of the consumer market[22]. LOHAS consumers are environ- mentally conscious, highly aware of environmental problems, and interested in the level of responsibility of corporations[23,24].
Some researchers indicated that only a small por- tion of environmentally conscious customers actually purchases eco-friendly products or services[13,25].
However, most studies found that consumers’ eco- friendly purchasing decision was driven from general environmental concerns[23,24,26-28]. In these stu- dies, the environmentally conscious consumers were more willing to purchase a product or service from companies that involve any environmental responsi-
bility activities. In addition, many hospitality firms’
ecological performances enhanced their images [29, 30].
To keep pace with the environmental issues, res- taurant businesses try to build more favorable ima- ges employing eco-friendly activities[23]. The restau- rant service, like other service sectors, has a cha-
racteristic of intangibility, and it is difficult to tell cus- tomers what they will be getting in advance. Accor- dingly, restaurants may use LOHAS image as an in- dicator for their customers to predict its service.
Thus, this study viewed a LOHAS concept as a posi- tive attribute of restaurant image evaluated by con- sumers.
Influence of Restaurant and LOHAS Images on Customer Satisfaction
Differentiated restaurant image and maintaining the image is a competitive strategy of restaurant ope- rators because the perceived image can influence on customer satisfaction[21]. Thus, previous studies showed that restaurant image significantly affects on customer satisfaction[20,31,32]. A restaurant image had a subsequent influence on customer satisfaction in the service industry[31,33]. Ryu et al[20] revealed that overall quick-casual restaurant image was a de- cisive factor of customer perceived value and cus- tomer satisfaction.
In today’s intensely competitive market, consu- mers have become more sophisticated and they are more interested in healthy and sustainable environ- ment than ever before. As a result, casual dining res- taurants can no longer largely dependent upon good taste and service for their success[34]. Thus, restau- rant customer satisfaction might be influenced by an emotional and evaluative process about green practi- ces such as employing LOHAS concept in a res- taurant. Seo and Joo[35] reported that LOHAS image had a positive influence on customer satisfaction and involvement of hotel restaurants. Joo, Kwon, and Lee[36] also showed that LOHAS image of hotel res- taurants had a positive impacts on the perceived service quality and satisfaction. In particular, Kim, Kim, and Byun[37] found that incremental infor- mation content of LOHAS image was significant in the relationship between restaurant image and cus- tomer satisfaction. Based on these previous studies,
this study approached customer satisfaction in an emotional response, triggered by evaluation process about LOHAS performances in a casual-dining res- taurant.
Influence of Restaurant and LOHAS Images on Customer Loyalty
Customers often have their biases toward a com- pany based on its image in the marketplace, and nu- merous empirical studies have investigated the influ- ence of a company image on customers’ loyalty [20,31,38]. Martineau[39] and Oliver[40] found that people’s behaviors were more likely to be influenced by an image than by the objective reality or actual experience. In another study, store image was a sig- nificant predictor of store loyalty as much as other functional attributes such as waiting time and store location were[32].
In particular, Yim and Yim[41] showed that an im- pact of corporate image on customer loyalty was stronger in the service industry than manufacturing industry because the image was a major determinant when customers were not able to predict what they will purchase prior to experience. Han et al[23] inves- tigated the impact of images of green hotels on cus- tomers’ behavior, and customers were willing to stay at the green hotel, to recommend it, and to pay more. Dalton et al[42] also examined tourist attitudes to renewable energy supply in hotel accommodation and found that environmentally conscious tourists were willing to stay in an eco-friendly hotel and to pay extra for the renewable energy supply. In addi- tion, Castro et al[33] found that a destination's image influenced tourists’ future behavioral intention to revisit.
The literature has also discussed the impact of an image on customer loyalty in the restaurant industry.
Ryu et al[20] found that overall quick-casual restau- rant image was a decisive factor of customer per- ceived value and behavioral intention implying that restaurant image not only has an determinant effect on overall service evaluation, but also creates a halo effect to enhance evaluation[43,44]. Given this, cus- tomer loyalty can be considered not just as actual customer behaviors, but also a customer’s favorable attitude toward the restaurant’s LOHAS image.
Based on the supports from previous studies, this
study proposed the following hypotheses:
Hypothesis 1: Restaurant image has a positive in- fluence on customer satisfaction.
Hypothesis 2: LOHAS image has a positive influ- ence on customer satisfaction.
Hypothesis 3: When LOHAS image is added to the relationship between restaurant image and customer satisfaction as a second pre- dictor, the change in R2 is significant.
Hypothesis 4: Restaurant image has a positive in- fluence on customer loyalty.
Hypothesis 5: LOHAS image has a positive influ- ence on customer loyalty.
Hypothesis 6: When LOHAS image is added to the relationship between restaurant image and customer loyalty as a second predictor, the change in R2 is significant.
METHODS
Instrumentation and Data Collection
After reviewing previous studies, this study utilized a questionnaire comprising 15 measurement items for restaurant image, 12 items for LOHAS image, 4 items for customer satisfaction, and 4 items for lo- yalty[6,35,37,40,45,46]. All question items used in this study were measured on a 5-point Likert-type scale (1=strongly disagree and 5=strongly agree).
A pilot study was conducted with graduate stu- dents who were experienced at least one casual-din- ing restaurant within the past 6 months in order to ensure that the selected items had acceptable va- lidity. A total of 400 questionnaires were distributed to customers of casual-dining restaurants in three major cities (i.e., Seoul, Daegu, and Busan) in South Korea for a two week period. After removing in- complete and unusable responses, a total of 359 usa- ble questionnaires were coded for data analysis, re- sulting in the response rate of 89.75%.
Data Analysis
In order to accomplish the purpose of the study, descriptive statistics analysis, exploratory factor anal- ysis, reliability test, and hierarchical regression analy- sis were performed. Specifically, in the hierarchical regression, restaurant images were entered in the
first step. Then, LOHAS images were entered in the second step. The sequential entry of independents variables allowed researchers to test hypotheses about how much variance in the customer satis- faction and loyalty can be attributed to LOHAS ima- ges over earlier entered restaurant images. All of these procedures were performed using IBM SPSS software.
RESULTS
Sample Profile
Demographic characteristics of the respondents are shown in Table 1. Approximately 52.1% of re- spondents were female and 47.9% were male. The majority of the respondents (65.1%) were between 30 and 49 years old, and 45.7% were single. Approxi- mately 86.1% had at least a college degree or were college students, which showed that the majority had a relatively high education level. Also, 81.5% of respondents described that their household income level is between $22,000 and $53,000, and 10.6% in- dicated that their household income is more than
$53,000. Approximately 38.4% were office workers, and 15.9% were professionals.
Exploratory Factor Analysis
Exploratory factor analysis (EFA) was performed to test the factor structure in the image variables. Using a principle axis factoring method with varimax rota- tion, only items with factor loadings of .4 or greater were retained for analyses, and those factors with ei- gen values greater than 1.0 were extracted. The test results suggested that the deletion of 4 items would positively improve the overall reliability of latent variables. The final results of the EFA extracted three restaurant image factors and two LOHAS image factors. Unidimensionality refers to consistency of the measurement items, in that unidimensional sur- vey questions measure the same concept. For the unidimensionality tests of customer satisfaction and loyalty, principal axis factoring with varimax rotation was employed respectively following the study by Kim and Lee[47]. For both constructs, a single factor was identified. The results indicated that customer satisfaction and loyalty were consistent with the in- tended measures and explained more than 69% of
Variable Level n %
Gender
Female 187 52.1
Male 172 47.9
Age
20~29 99 27.6
30~39 129 35.9
40~49 105 29.2
50 or older 26 7.3
Marital status
Married 195 54.3
Single 164 45.7
Education level
High school graduate 50 13.9
College student/bachelor’s degree 281 78.3
Graduate student/graduate degree 28 7.8
Annual income ($)
Less than 22,000 28 7.9
22,000~37,000 197 54.8
37,001~53,000 96 26.7
More than 53,000 38 10.6
Occupation
Salary worker 138 38.4
Professional 57 15.9
Public service 48 13.4
Self-employed 23 6.4
Service management 24 6.7
Housewife 22 6.1
Students 47 13.1
Frequency of visit (per month)
1 219 61.0
2 103 28.7
3 32 8.9
4 5 1.4
Companion
Family 174 48.5
Friends 105 29.2
Couple 48 13.4
Colleague 32 8.9
Table 1. Demographic information of the respondents (n=359)
the variance in the data. Additionally, reliability tests were implemented to assess the internal consistency of the measurement items. Nunnally[48] offered a
rule of thumb of 0.6, and because the Cronbach’s al- pha values were above 0.6, the scales for the factors were deemed to exhibit adequate reliability for fur-
Factor Item Factor loading
Mean (SD)
Variance explai- ned %
Eigen value
Cronbach’s alpha
Factor 1:
Food taste and quality
Freshness of ingredients .827 3.37 (.67)
8.232 1.893 .693
Food taste .822 3.36 (.71)
Food temperature .510 3.54 (.75)
Factor 2:
Facility and atmosphere
Parking space .759 3.49 (.83)
9.521 2.190 .711
Space design .733 3.45 (.74)
Layout .642 3.35 (.78)
Modern facility .637 3.46 (.71)
Factor 3:
Employee service
Courtesy .871 3.90 (.73)
14.986 3.447 .869
Kindness .823 3.86 (.73)
Decent appearance .798 3.82 (.70)
Knowledge about menus .732 3.74 (.73)
Customer treatment .725 3.50 (.82)
Factor 4:
Environment and sustainability
Use of sustainable farming ingredients .863 2.77 (.79)
22.333 5.137 .911 Use of eco-friendly supplies .856 2.71 (.78)
Sustainable ingredients .830 2.83 (.76)
Purchase of sustainable products .777 2.84 (.74) Promotion of eco-friendly products .767 2.73 (.79)
Use of recycling products .605 2.85 (.74)
Active practices for environmental protection .585 2.96 (.80) Use of eco-friendly materials .551 3.04 (.84) Factor 5:
Recycling and LOHAS value
Energy saving facilities .760 3.01 (.73)
9.468 2.178 .800
Sharing of LOHAS value .717 3.00 (.75)
Social responsibility .593 2.92 (.74)
Kaiser-Meyer-Olkin(KMO)=.890, Bartlett’s test of sphericity=4,150.044 (p=.000), Total variance explained=64.54%
Customer satisfaction
Relatively good .866 3.31 (.72)
69.513 2.781 .849
Fulfill expectations .858 3.16 (.66)
Satisfied with overall image .833 3.33 (.69)
Worth the money .775 2.84 (.79)
Kaiser-Meyer-Olkin(KMO)=.815, Bartlett’s test of sphericity=619.487 (p=.000)
Customer loyalty
Positive word of mouth .887 3.27 (.76)
76.572 3.063 .898
Willingness to recommend .883 3.14 (.77)
Revisit intention .870 3.23 (.74)
Preferential selection .859 3.16 (.77)
Kaiser-Meyer-Olkin(KMO)=.848, Bartlett’s test of sphericity=848.597 (p=.000) Table 2. Results of factor analyses
Independent variables
Unstandardized coefficients
Standardized
coefficients t p
B SE β
Restaurant image
(Constant) .602 .209 - 2.908 .004
Food taste and quality .468 .053 .440 8.895 .000***
Facility and atmosphere .193 .051 .183 3.791 .000***
Employee service .077 .049 .078 1.558 .120
R²=.330, Modified R²=.325, F-value=58.344***, Durbin-Watson=1.998
LOHAS image
(Constant) 1.747 .144 - 12.097 .000
Environment and sustainability .299 .063 .308 4.709 .000***
Recycling and LOHAS value .190 .062 .200 3.052 .002**
R²=.221, Modified R²=.216, F-value=50.417***, Durbin-Watson=1.873 Dependent variable: customer satisfaction.
** p<.01, *** p<.001.
Table 3. The result of multiple regression analyses for Hypotheses 1 and 2 ther analyses.
Hypotheses Testings
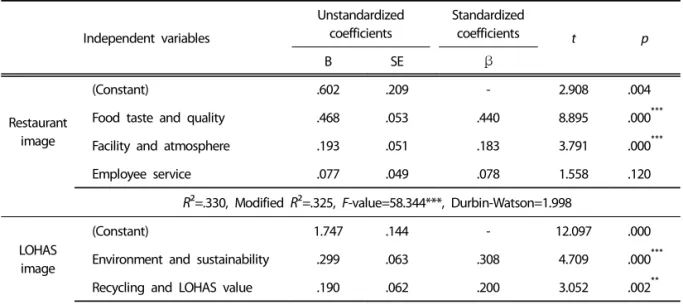
Table 3 shows the impact of restaurant image and LOHAS image on the customer satisfaction. The im- pact of restaurant image on customer satisfaction was firstly investigated. R2 was found to be .330 (modified R2=.325), implying that 32.5% of customer satisfaction can be attributed to the restaurant ima- ge. Food taste and quality (t=8.895, p=.000) and fa- cility and atmosphere (t=3.719, p=.000) were found to be significant whereas employee service (t=1.558, p=.120) was not significant. Thus, hypothesis 1 was partially supported. These results may indicate that in the current competitive restaurant industry, em- ployee service is not a competitive advantage any more to differentiate a restaurant. The impact of LOHAS image on customer satisfaction was also in- vestigated. R2 was found to be .221 (modified R2
=.216), implying that the LOHAS image explained 21.6% of customer satisfaction. environment and sus- tainability (t=4.709, p=.000) and recycling and LOHAS value (t=3.052, p=.002) showed positive influence on customer satisfaction. Thus, hypothesis 2 was su- pported.
The results of hierarchical regression analysis show-
ed the impact of adding LOHAS image to the rela- tionship between restaurant image and customer satisfaction (Table 4). When LOHAS image was added in the model 2, R2 was found to be .421 (modified R2=.413), explaining 41.3% of customer satisfaction.
Adding LOHAS image to the model 1 significantly in- creased R2 by 9.1% (ΔR²=.091) indicating statistical improvement in the model explaining customer sa- tisfaction, which is consistent with a previous study by Kim, Kim, and Byun[37]. The ΔR² is an indicator of the relevance of particular variables entered in la- ter steps, relative to those entered in earlier steps.
Therefore, hypothesis 3 was supported. In the model 2, four out of five factors were found to be significant in explaining customer satisfaction. Food taste and quality (β=.379, p<.001), facility and atmosphere (β
=.107, p<.05), recycling and environment and sus- tainable image (β=.177, p<.01), recycling and LOHAS value (β=.171, p<.01) were found to be significant.
On the other hand, employee service was found not to be significant.
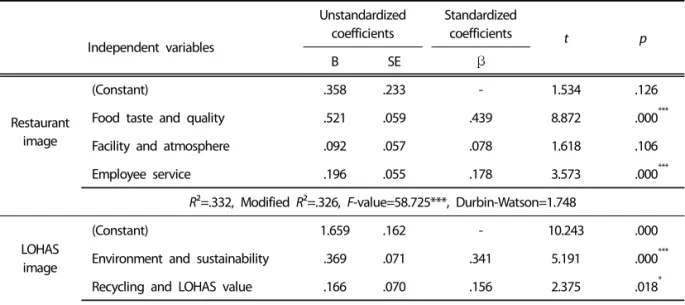
Table 5 shows the impact restaurant image and LOHAS image on customer loyalty. It was found that restaurant image explained 32.6% of the variance in the customer loyalty (R2=.332, modified R2=.326).
Food taste and quality (t=8.872, p<.000) and employ- ee service (t=3.573, p<.000) positively affected cus-
Independent variables Model 1 Model 2
SE β t p SE β t p
(Constant) .209 - 2.879 .004 .207 - .557 .578
Food taste and quality .053 .440 8.895 .000*** .050 .379 8.088 .000***
Facility and atmosphere .051 .183 3.791 .000*** .049 .107 2.318 .021*
Employee service .049 .078 1.558 .120 .046 .081 1.735 .084
Environment and sustainability .057 .177 3.042 .003**
Recycling and LOHAS value .054 .171 3.018 .003**
Statistics
R² (Modified R²) .330 (.325) .421 (.413)
F-value 58.344*** 51.349***
ΔR² - .091
F-value for ΔR² - 27.694***
Durbin-Watson - 2.044
Dependent variable: Customer satisfaction.
* p<.05, ** p<.01, *** p<.001.
Table 4. The result of hierarchical regression analysis for Hypothesis 3
Independent variables
Unstandardized coefficients
Standardized
coefficients t p
B SE β
Restaurant image
(Constant) .358 .233 - 1.534 .126
Food taste and quality .521 .059 .439 8.872 .000***
Facility and atmosphere .092 .057 .078 1.618 .106
Employee service .196 .055 .178 3.573 .000***
R²=.332, Modified R²=.326, F-value=58.725***, Durbin-Watson=1.748
LOHAS image
(Constant) 1.659 .162 - 10.243 .000
Environment and sustainability .369 .071 .341 5.191 .000***
Recycling and LOHAS value .166 .070 .156 2.375 .018*
R²=.215, Modified R²=.210, F-value=48.690***, Durbin-Watson=1.679 Dependent variable: Customer loyalty.
* p<.05, *** p<.001.
Table 5. The result of multiple regression analyses for Hypotheses 4 and 5
tomer loyalty, but facility and atmosphere (t=1.618, p=.106) did not positively affect customer loyalty, partially supporting hypothesis 4. These results in- dicated that restaurant image had a positive influ- ence on customer loyalty, which is consistent with
previous studies showing the positive relationship between restaurant image and customer loyalty in restaurants[20,40]. The impact of LOHAS image on customer loyalty was also investigated. R2 was found to be .215 (modified R2=.210), implying that 21.0% of
Independent variables Model 1 Model 2
SE β t p SE β t p
(Constant) .233 - 1.534 .126 .229 - –.772 .441
Food taste and quality .059 .439 8.872 .000*** .055 .375 8.038 .000***
Facility and atmosphere .057 .078 1.618 .106 .054 -.003 –.064 .949
Employee service .055 .178 3.573 .000*** .051 .181 3.924 .000***
Environment and sustainability .063 .230 3.962 .000***
Recycling and LOHAS value .060 .127 2.258 .025*
Statistics
R² (Modified R²) .332 (.326) .428 (.420)
F-value 58.725*** 52.762***
ΔR² - .096
F-value for ΔR² - 29.617***
Durbin-Watson - 1.776
Dependent variable: Customer loyalty.
* p<.05, *** p<.001.
Table 6. The result of hierarchical regression analysis for Hypothesis 6
customer loyalty can be attributed to the LOHAS image. Environment and sustainability (t=5.191, p=
.000) and recycling and LOHAS value (t=2.375, p=
.018) showed positive on the customer loyalty. Thus, hypothesis 5 was supported.
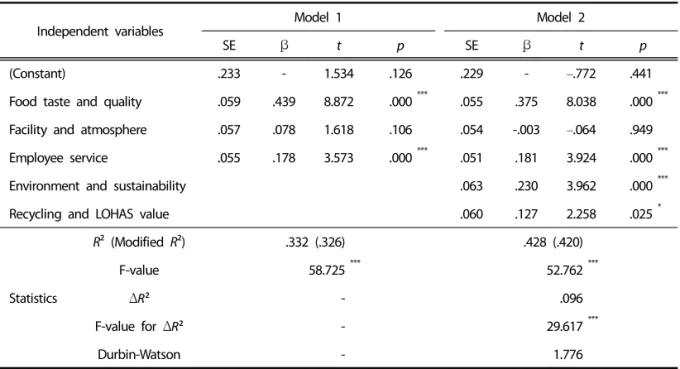
The model 2 in Table 6 shows that adding LOHAS image in the relationship between restaurant image and customer loyalty significantly increased R2 by 9.6% (ΔR²=.096) pointing out significant incremental information content of LOHAS image (R2=.428, modi- fied R2=.420). Thus, hypothesis 6 was supported. The results reported that Food taste and quality (β=.375, p<.000), employee service (β=.181, p<.000), environ- ment and sustainable image (β=.230, p<.000), and re- cycling and LOHAS value (β=.127, p<.05) significantly affected customer loyalty, whereas facility and at- mosphere did not.
DISCUSSION AND CONCLUSIONS
Discussion of Findings
This study aimed to examine the influence of res- taurant image and LOHAS image on customer satis- faction and loyalty in the casual-dining restaurant segment. Particularly, it tested if LOHAS image added
information content to that provided by restaurant image in explaining customer satisfaction and lo- yalty.
Firstly, the multiple regression results supported the hypotheses 1 and 2, showing that restaurant ima- ge as well as LOHAS image positively influenced cus- tomer satisfaction. Furthermore, adding LOHAS im- age to restaurant image explained more of the var- iance in customer satisfaction, supporting Hypothe- sis 3. These findings suggest that both restaurant im- age and LOHAS image directly affect customer satisfaction. The results may imply that building strong LOHAS image is an effective way to increase customer satisfaction in the restaurant industry.
Secondly, both restaurant image and LOHAS ima- ge significantly affected customer loyalty, supporting hypotheses 4 and 5. Also, when the LOHAS image factors were added to the relationship between res- taurant image and customer loyalty, increased in- formation content R2 was significant, supporting Hypothesis 6. The findings suggest that although the contribution of LOHAS image in explaining customer loyalty is slight its incremental information content is meaningful in explaining restaurant firms’ custo- mer loyalty.
The incremental information content of LOHAS image was greater in explaining customer loyalty (Δ R²=.096) than in explaining customer satisfaction (Δ R²==.091). In the study conducted by Chow, Lau, Lo, Sha, and Yun[49], a direct relationship between ser- vice quality and repeat patronage was reported. Seo and Joo[35] examined the impacts of LOHAS image on customer loyalty perceived by hotel restaurant customers in South Korea and evidenced positive re- lationship between LOHAS image and customer loyalty. In the US, Gupta and Pirsch[50] investigated the influence of restaurant company’s social respon- sibility and concluded that a company’s ability to of- fer up-to-date products in a environmentally con- scious manner was important in determining con- sumers’ restaurant image and their loyalty levels.
Therefore, the customers in the present study may recognize the LOHAS image as a type of the restau- rant’s green performances, resulting in the higher in- cremental information content in explaining custo- mer loyalty than in customer satisfaction.
In South Korea, “the body and soil are one” is one of the traditional food values prevailing through the ages, and this has led to the local food and sustain- ability movement for over a decade. Also, increasing processed food products and environmental pollu- tion have recently caused several food safety acci- dents such as detection of foreign substances in can- ned tuna and snacks (March 2008), dioxin in mozzar- ella cheese (April 2008), and endocrine disrupting chemicals in powdered milk (August 2008). Conse- quently, the concerns about food safety accidents are increasing, and eco-friendly activities such as re- cycling, separate waste collection, reducing use of a disposable product directly influence consumer’s purchasing attitude[35,36]. Therefore, employing green image such as a LOHAS concept can be a com- petitive element to differentiate a restaurant firm from its competitors.
In conclusion, the findings of this study did not show that LOHAS image is the most important factor for satisfied or loyal customers. However, they sug- gest that adding LOHAS image to the restaurant ima- ge could be a competitive business strategy for casu- al-dining restaurants which enables their image upgrade. It is widely accepted that high quality food is a crucial element for customer satisfaction and lo-
yalty in a restaurant[21,51,52]. Hence, ironically, maintaining and improving the high food quality could not be a competitive advantage any more.
Rather, enhancing a restaurant image could be more effective to acquire competitive advantages.
There are several ways to build LOHAS image of res- taurants; developing menus considering health and sustainability, remodeling space design on an eco-fri- endly basis, installing an energy saving system, and using eco-friendly food supplies. Through these per- formances, restaurants can enhance eco-friendly im- age and provide customers the feeling engaged in environmental protection, which drives customer satisfaction and loyalty.
This study has merits to contribute to the existing literature by differentiating it from the previous stud- ies to some extents. In previous studies, a store ima- ge[20,32,53,54] and an environmentally friendly ima- ge[13,23,35,55] associated with customer satisfac- tion[37] and loyalty have been investigated sepa- rately. However, this study suggested a different ap- proach from previous studies by adding LOHAS ima- ge items to restaurant image in explaining customer satisfaction and loyalty and investigating the incre- mental information content of the LOHAS image.
Limitations and Future Research
Despite the unique contributions of this study, there are limitations that should be mentioned. First, this study examined the satisfaction and loyalty level of general casual-dining restaurant customers even though customers from different background may respond differently to the survey questions. Thus, further study should consider the background differ- ences of restaurant customers such as age, gender, income level, education level, and frequency of visit.
Secondly, this study did not include items that de- termine if consumers are exactly aware of the LOHAS concept. For future study, it would be useful to iden- tify the relationship between the awareness level of the LOHAS concept and related variables such as customer behaviors.
REFERENCES
[1] National Restaurant Association (2010). Facts at a Glance: Top Ten Facts 2010. Retrieved March 27,
2010, from http://www.restaurant.org/research/
facts/
[2] National Restaurant Association (2012). Recycling for All the Right Returns. Retrieved January 21, 2012, from http://www.restaurant.org/pdfs/sus- tainability/recycling_full_survey_results.pdf [3] Kang DW (October 11, 2010). Korean Bennigan's
Launched an Eco-fusion Restaurant 'Bab O Ne Kit- chen'. Money Week.
[4] Kang KK (October 26, 2010). A promising item of starting a business: Specialized casual-dining res- taurants[Electronic Version]. eToday from http://
www.etoday.co.kr/news/section/newsview.php?
TM=news&SM=0701&idxno=370434.
[5] Yu HH (May 28, 2010). Marché introduces eco- friendly food supplies. Financial News.
[6] The Natural Marketing Institute (2010). The LOHAS Consumer Trends Database. Retrieved Sep. 29, 2010, from http://www.nmisolutions.com/lohasd.
html
[7] Bayton JA (1959). Researching the corporate ima- ge. Public Relations 4:3-8.
[8] Margulies WP (1977). Make the most of your cor- porate identity. Harvard Business Review 55(4):
66-74.
[9] Dowling GR (1986). Managing your corporate ima- ges. Industrial Marketing Management 15:109-115.
[10] Grőnroos C (1984). A service quality model and its marketing implications. European Journal of Marketing 18(4):36-44.
[11] Pharoh N (1982). Corporate image research in the brewing industry or from red revolution to country goodness in ten years. Journal of the Market Research Society 24(3):240-256.
[12] Brown TJ, Dacin PA (1997). The company and the product: Corporate associations and con- sumer product responses. Journal of Marketing 61(1):68-84.
[13] Cacho-Elizondo S, Loussaïef L (2010). The influ- ence of sustainable development on retail store image. International Business Research 3(3):100- 110.
[14] Zimmer MR, Golden LL (1988). Impressions of re- tail store: A content analysis of consumer ima- ges. Journal of Retailing 64(3):235-236.
[15] Berman B, Evans JR (1995). Retail Management:
A Strategic Approach (11th ed.). Upper Saddle
River, NJ: Pearson Prentice Hall.
[16] Assael H (1998). Consumer Behavior and Marke- ting action (6th ed.). Cincinnati, OH: South-Wes- tern College Pub.
[17] Rodríguez del Bosque IA, Martín HS, Collado J (2006). The role of expectations in the consumer satisfaction formation process: Empirical evi- dence in the travel agency sector. Tourism Ma- nagement 27(3):410-419.
[18] John N, Pine R (2002). Customer behavior in the food service industry: A review. International Journal of Hospitality Management 21(2):119-134.
[19] Jang S, Namkung Y (2009). Perceived quality, emotions, and behavioral intentions: application of an extended mehrabian-russell model to restaurants. Journal of Business Research 62(4):
451-460.
[20] Ryu K, Han H, Kim TH (2008). The relationships among overall quick-casual restaurant image, perceived value, customer satisfaction, and be- havioral intentions. International Journal of Hos- pitality Management 27(3):459-469.
[21] Ryu K, Lee HR, Kim WG (2012). The influence of the quality of the physical environment, food, and service on restaurant image, customer per- ceived value, customer satisfaction, and beha- vioral intentions. International Journal of Contem- porary Hospitality Management 24(2):200-223.
[22] Cohen MJ (2007). Consumer credit, household fi- nancial management, and sustainable consump- tion. International Journal of Consumer Studies 31(1):57-65.
[23] Han H, Hsu LT, Lee JS (2009). Empirical inves- tigation of the roles of attitudes toward green behaviors, overall image, gender, and age in ho- tel customers' eco-friendly decision-making pro- cess. International Journal of Hospitality Manage- ment 28:519-528.
[24] Laroche M, Bergeron J, Barbaro-Forleo G (2001).
Targeting consumers who are willing to pay more for environmentally friendly products. Jo- urnal of Consumer Marketing 18(6):503-520.
[25] Roberts JA (1996). Green consumers in the 1990s: profile and implications for advertising.
Journal of Business Research 36:217-231.
[26] Manaktola K, Jauhari V (2007a). Exploring con- sumer attitude and behavior towards green prac-
tices in the lodging industry in India. Interna- tional Journal of Contemporary Hospitality Ma- nagement 19(5):364-377.
[27] Kim D, Kim Y (2012). A study on customer per- ception on a food service company`s corporate social responsibility activities. The Korean Journal of Culinary Research 18(1):259-271.
[28] Kim Y, Kim D (2012). Consumers' intention to se- lect eco-friendly restaurants by adopting ex- tended theory of reasoned action. Foodservice Industry Journal 8(2):45-62.
[29] Manaktola K, Jauhari V (2007b). Exploring con- sumer attitude and behavior towards green practices in the lodging industry in India. Inter- national Journal of Contemporary Hospitality Ma- nagement 19(5):364-377.
[30] Yim W, Penny K (2007). The use of environ- mental management as a facilities management tool in the Macao hotel sector. Facilities 25:
286-295.
[31] Andreassen TW, Lindestad B (1998). Customer loyalty and complex services: the impact of cor- porate image on quality, customer satisfaction and loyalty for customers with varying degrees of service expertise. International Journal of Ser- vice Industry Management 9(1):7-23.
[32] Prendergast G, Man HW (2002). The influence of store image on store loyalty in Hong prepo- sitions. Journal of Marketing 46:92-101.
[33] Castro CB, Armario M, Ruiz M (2007). The influ- ence of market heterogeneity on the relation- ship between a destination's image and tourists' future behavior. Tourism Management 28(1):175- 187.
[34] Liu YH, Jang S (2009). Perceptions of Chinese restaurants in the U.S.: what affects customer satisfaction and behavioral intentions? Interna- tional Journal of Hospitality Management 28(3):
338-348.
[35] Seo DG, Joo HS (2008). Impacts of LOHAS image and involvement to customer satisfaction and loyalty perceived by hotel restaurant customers.
Tourism Research 23(1):399-420.
[36] Joo HS, Kwon YJ, Lee SH (2008). Influential rela- tions of hotel restaurant LOHAS image of the perceived service quality and value, customer satisfaction, and loyalty. Korean Journal of Hotel
Administration 17(6):1-18.
[37] Kim Y, Kim D, Byun G (2009). The effects of fam- ily restaurant and LOHAS images on customer satisfaction. Journal of Hospitality and Tourism Studies 11(1):91-106.
[38] Cai LA, Wu B, Bai B (2003). Destination image and loyalty. Cognizant Communication Corpora- tion 7:153-162.
[39] Martineau P (1958). The personality of the retail store. Harvard Business Review 36:47-55.
[40] Oliver RL (1997). Satisfaction: A Behavioral Pers- pective on the Consumer. New York: McGraw- Hill.
[41] Yim JY, Yim JY (2002). An investigation into de- terminants of customer satisfaction and loyalty:
The moderating effect of customers’knowledge level and industry types. Korean Journal of Mar- keting 4(2):1-25.
[42] Dalton GJ, Lockington DA, Baldock TE (2008). A survey of tourist attitudes to renewable energy supply in Australian hotel accommodation. Re- newable Energy 33(10):2174-2185.
[43] Brian DT, Nowak LI (2000). Toward effective use of cause-related marketing alliances. The Journal of Product and Brand Management 9(70):474-484.
[44] Yoon K, Suh SH (2003). The influence of corpo- rate advertising and social responsibility activ- ities on corporate image and brand attitudes.
Advertising Research 61:47-72.
[45] Collins-Dodd C, Lindley T (2003). Store brands and retail differentiation: the influence of store image and store brand attitude on store own brand perceptions. Journal of Retailing and Con- sumer Services 10(6):345-352.
[46] Lee SG (2005). Relationship between restaurant store image and purchase motivation. Hotel and Tourism Research 7(3):137-155.
[47] Kim D, Lee S (2014). The effect of the service- scape on the customers’ cognitive, affective, and conative attitudes in franchise coffee shops. The Korean Journal of Culinary Research 20(2):232- 245.
[48] Nunnally JC (1978). Psychometric Theory (2nd ed.). New York: McGraw-Hill.
[49] Chow IH, Lau VP, Lo TY, Sha Z, Yun H (2007).
Service quality in restaurant operations in China:
Decision-and experiential-oriented perspectives.
International Journal of Hospitality Management 26(3):698-710.
[50] Gupta S, Pirsch J (2008). The influence of a re- tailer's corporate social responsibility program on re-conceptualizing store image. Journal of Retailing and Consumer Services 15:516-526.
[51] Namkung Y, Jang S (2007). Does food quality really matter in restaurant? Its impact on cus- tomer satisfaction and behavioral intentions.
Journal of Hospitality & Tourism Research 31(3):
387-410.
[52] Ryu K, Han H (2010). Influence of the quality of food, service, and physical environment on cus- tomer satisfaction and behavioral Intention in quick-casual restaurants: Moderating role of per- ceived price. Journal of Hospitality & Tourism Re-
search 34(3):310-329.
[53] Hwang BI (2004). The mediating role of corpo- rate image on service customer loyalty. Adverti- sing Research 62:133-160.
[54] Mattila AS (2001). Emotional bonding and res- taurant loyalty. The Cornell Hotel and Restaurant Administration Quarterly 42(6):73-79.
[55] Kalafatis SP, Pollard M, East R, Tsogas MH (1999).
Green marketing and Ajzen's theory of planned behavior: a cross-market examination. Journal of Consumer Marketing 16(5):441-460.
Received: 19 September, 2016 Revised: 22 September, 2016 Accepted: 28 September, 2016