경유자동차에서 배출되는 NO
2
/NOX
비율 특성김선문⋅김정화⋅정성운⋅성기재⋅김정수⋅김인구†
국립환경과학원 교통환경연구소
Experimental Study on the NO 2 /NO X Ratio from Exhaust of Diesel Vehicles by Chassis Dynamometer
SUNMOON KIM, JOUNGHWA KIM, SUNGWOON JUNG, KIJAE SUNG, JEONGSOO KIM, INGU KIM
† Transportation Pollution Research Center, National Institute of Environmental Research, 42 Hwangyoung-ro, Seo-gu, Incheon 22689, Korea†
Corresponding author :
[email protected]Received
12 April, 2017Revised
13 April, 2017Accepted
30 April, 2017Abstract >> Nitrogen dioxide (NO
2) is an important urban pollutant in Korea.
Expecially, diesel vehicles are responsible for the most traffic rated nitrogen ox- ide (NO
X) emission, including nitric oxide (NO) and nitrogen dioxide (NO
2).
Though nitrogen oxide (NO
X) emission from vehicle was applied a strict enforce- ment of emission standard, the specific NO
2fraction in NO
X(NO
2/NO
X) from vari- ous types of diesel vehicles was not understood. In order to investigate the frac- tion of NO
2/NO
X, the vehicle emission study was carried out at the facility of Transport Pollution Research Center (TPRC), National Institute of Environmental Research (NIER), Korea. Three different types of diesel vehicles(VAN, SUV, pas- senger) were tested on the NIER driving mode. The result of NO
2/NO
Xratio was over 0.1 for all test vehicles and the highest NO
2emission was observed at the van vehicle. The observation was showed that the emission trend of NO
2/NO
Xfor passenger and SUV vehicles were inversely proportional. Also, as the emission standard has been strengthen, the emission rate of NO
2has been decrease.
Key words : Nitrogen oxide(질소산화물), NO2/NOX ratio, NIER driving mode (NIER 시험모드)
1. 서 론
질소산화물 (NO
X)은 공기 중의 질소(N
2)와 달리 연 소과정 등을 통하여 생성되는 화합물이며, 대기 중 반응을 통하여 미세먼지를 생성하는 전구물질이고 , 일부 광화학 반응을 통해 유해물질을 생성한다
1). 국
립환경과학원의 대기정책지원시스템 (Clean Air Policy
Support, CAPSS)에서 산출한 2013년 국가 대기오염
물질 배출량에서 배출원 별 배출량 기여율에서 이동
오염원의 NO
X는 30.8%, 335,721톤으로 가장 높은
배출 기여율을 보였다
2). 이와 같은 이동오염원 중에
서 NO
X의 주요 배출원은 경유를 연료로 사용하는
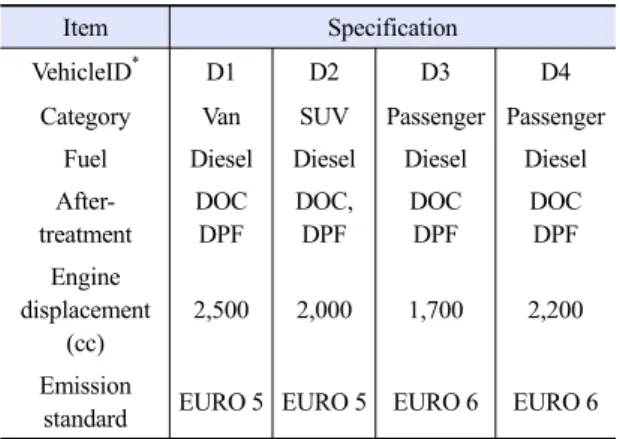
Item Specification
VehicleID* D1 D2 D3 D4
Category Van SUV Passenger Passenger Fuel Diesel Diesel Diesel Diesel After-
treatment
DOC DPF
DOC, DPF
DOC DPF
DOC DPF Engine
displacement (cc)
2,500 2,000 1,700 2,200
Emission
standard EURO 5 EURO 5 EURO 6 EURO 6
* Vehicle IDs beginning with D are for Diesel
Table 1. Specification of test vehicles
Item Specification
Components NO, NO2, N2O, NH3
Principle Quantum Cascade Laser Sample line temperature 115℃
Sampling speed 10 Hz
Flow rate 8 ± 1 L/min
Table 2. Specification of MEXA-1400QL
자동차의 비중이 가장 크다. 일반적으로 자동차에서 배출되는 NO
X는 대부분이 일산화질소(NO)와 이산 화질소 (NO
2)이다. NO
X중의 인체 및 대기오염 등 환 경적인 측면에서의 영향은 NO보다 NO
2가 더욱 큰 피해를 주는 것으로 알려져 있다
3). NO
2는 대기 중 휘발성 유기화합물(VOCs)과 함께 반응하여 오존 (O
3)을 생성하는 전구물질의 역할을 하며 장기간 노 출될 경우 아동 및 노약자들의 급성 호흡질환 발생 률을 증가시킬 수 있다
4). 이처럼 NO
2의 인체 및 대 기 환경적 영향을 고려한다면 자동차에서 배출되는 NO
X뿐만 아니라 NO
X가 포함하고 있는 NO, NO
2의 각 구성성분에 대한 실질적인 연구가 필요하다.
이에 본 연구에서는 경유자동차에서 배출되는 NO
X의 배출량을 NO와 NO
2로 구분 측정하여 환경 측면에서 NO
2의 경향을 파악하고자 한다.
2. 실험 장치 및 실험 방법
2.1 실험 방법
2.1.1 차량 선정
본 연구는 경유자동차를 용도에 따른 차종별로 구 분하였으며 국내 자동차 배출가스 인증 시험방법으 로 배출가스를 측정하였다. 시험에 사용된 차량의 제 원을 Table 1에 나타내었다. 차량선정은 국내에서 판 매되고 있는 경유 차량의 통계자료를 바탕으로, 각 차종(VAN, SUV, Passenger)에서의 점유율이 높은 대표 차량을 선정하였다. 선정된 자동차 오염물질 배 출 수준이 EURO 5 이상의 배출허용기준규제가 적 용 된 차량으로 선정하였기 때문에, 모든 차량에는 후처리장치인 디젤 산화 촉매장치 (diesel oxidation catalyst, DOC)와 입자상물질 저감필터(diesel parti- culate filter, DPF)가 장착되어 있다.
2.1.2 NO
X측정 장비
대부분의 NO
X측정기는 NO, NO
2등 산화질소계 열 배출물의 합으로 각 성분의 구분 없이 측정되어 진다. 이에 본 연구에서는 NO
2의 배출량을 측정하기
위해 별도의 장비(MEXA-1400QL)를 사용하였다.
Table 2에는 NO
X측정에 사용된 MEXA-1400QL에 대한 제원을 나타냈다. MEXA-1400QL은 적외선 레 이저 분광법을 이용하여 배기가스 중의 질소 화합물 (NO, NO
2, N
2O, NH
3)을 실시간으로 연속 측정할 수 있는 가스분석기다 . 그리고 양자 캐스케이드 레이저 (Quantum Cascade laser, QCL)와 정밀 조정된 초장 광로 셀을 조합한 것으로 고감도로 넓은 범위의 배 기가스를 측정하기에 적합하다
5,6). 본 연구에서의 시 료 채취는 자동차 배기관에 직접 연결하였으며 샘플 라인을 115℃로 히팅시켰으며, 가스 유입 선택성을 높이기 위해 입자상 물질의 유입을 막아주는 필터를 수시로 교체해주었다 .
2.1.3 측정 시스템
실험은 실제 도로 주행시 발생되는 구름저항과 공
기저항 등 부하상태를 모사할 수 있는 차대동력계를
사용하였다 . 시험 차량은 고유의 저항값들을 가지고
Mode Durations (sec)
Distance (km)
Avg speed (km/h)
Max speed (km/h)
NIER01 873 1.1 4.7 33.4
NIER05 861 4.1 17.3 68.1
NIER09 926 8.8 34.1 70.9
NIER12 840 15.3 65.4 83.3
NIER14 917 24.8 97.3 104.5
Table 3. Information of NIER modes
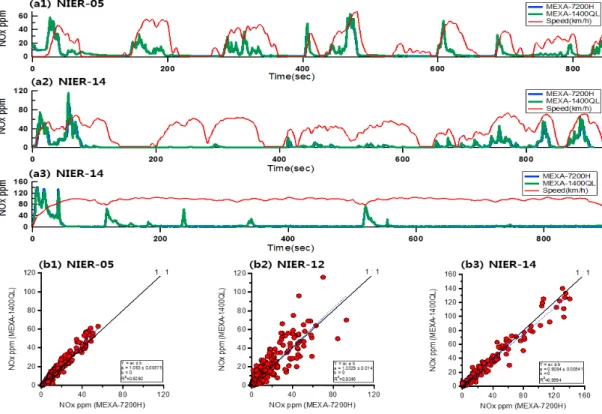
Fig. 1. (a) comparison between measured NO
X concentration by MEXA-7200H and MEXA-1400QL on vehicle speed (b) correlation NOX concentration between MEXA-7200H and MEXA-1400QL by NIER mode of D4있기 때문에 이를 차대동력계에서 구현하기 위해서 코스트다운 (coastdown) 테스트를 실시하였다.
측정모드는 국립환경과학원은 국내 도로주행 패 턴을 모사한 총 15단계로 구성된 NIER 모드로, 평균 속도를 기준으로 저속, 중속, 고속에 해당되는 NIER- 01 (4.7 km/h), NIER-05 (17.3 km/h), NIER-09 (34.1 km/h), NIER-12 (65.4 km/h), NIER-14 (97.3 km/h) 모드를 사용하였다 . 자세한 NIER 모드에 대한 설명은
Table 3에 정리하였다.
실험이 진행되면서 환경조건의 영향을 최소화하 기 위해 실험실 내의 온도 및 습도는 20~27℃, 40~50%로 유지하였다. 또한, DPF 재생에 의한 장비 오염을 막기 위해 실험이 진행되기 전에 차량진단기 를 사용하여 DPF의 로딩 수준을 점검하였다.
3. 결과 및 고찰
3.1 상관성 비교
MEXA-1400QL에서 측정된 NO와 NO
2의 정확성
을 확인하고자 NO
X분석에 많이 사용되고 있는 화
학발광(Chemiluminescence Detector)법을 이용한 분
석기를 사용하였다 . 비교실험은 정용량시료채취 시
스템인 CVS (Constant Volume Sampler) 터널에서
동시에 샘플링하였으며 , 측정간격 시간은 1초로 하
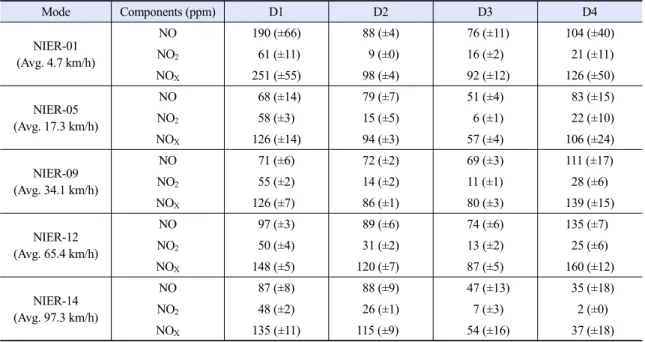
Mode Components (ppm) D1 D2 D3 D4
NIER-01 (Avg. 4.7 km/h)
NO 190 (±66) 88 (±4) 76 (±11) 104 (±40)
NO2 61 (±11) 9 (±0) 16 (±2) 21 (±11)
NOX 251 (±55) 98 (±4) 92 (±12) 126 (±50)
NIER-05 (Avg. 17.3 km/h)
NO 68 (±14) 79 (±7) 51 (±4) 83 (±15)
NO2 58 (±3) 15 (±5) 6 (±1) 22 (±10)
NOX 126 (±14) 94 (±3) 57 (±4) 106 (±24)
NIER-09 (Avg. 34.1 km/h)
NO 71 (±6) 72 (±2) 69 (±3) 111 (±17)
NO2 55 (±2) 14 (±2) 11 (±1) 28 (±6)
NOX 126 (±7) 86 (±1) 80 (±3) 139 (±15)
NIER-12 (Avg. 65.4 km/h)
NO 97 (±3) 89 (±6) 74 (±6) 135 (±7)
NO2 50 (±4) 31 (±2) 13 (±2) 25 (±6)
NOX 148 (±5) 120 (±7) 87 (±5) 160 (±12)
NIER-14 (Avg. 97.3 km/h)
NO 87 (±8) 88 (±9) 47 (±13) 35 (±18)
NO2 48 (±2) 26 (±1) 7 (±3) 2 (±0)
NOX 135 (±11) 115 (±9) 54 (±16) 37 (±18)
Table 4. Concentration of NO
X from vehicle`s emission from the different driving cycles60 50 40 30 20 10 0 NO/NO2X [NO +N O2 ] (%
)
100 80
60 40
20 0
Average Speed (km/hr)
EURO 5 EURO 6
Fig. 2. Comparison between EURO 5 and EURO 6 by driving
test cycles였다. 결과 분석에는 각 장비마다 샘플라인의 길이 등 응답시간을 고려하였다 . Fig. 1에는 실험차량 D4 의 상관성 그래프를 나타냈다. Fig 1(a1)~(a3)은 두 분석기의 NO
X농도를 차량 속도에 따라 나타낸 것 으로 가속 및 감속 구간에서 배출되는 NO
X경향은 두개의 장비 모두 일치하는 경향의 결과를 보였다 . Fig. 1(b1)~(b3)에는 D4의 NO
X결과를 가지고 두 분 석 장비의 상관성 그래프를 나타냈다. 결정계수(Coe- fficient of determination, r
2)는 0.83~0.96으로 비교적 높은 상관성을 보였다.
3.2 NO2/NOX 비교
본 연구에서는 외부공기와 희석이 되지 않은 순수 자동차에서 배출된 NO
X를 측정하고자 배기관에서 직접 시료를 샘플링하였다 . 따라서 NO
2/NO
X결과는 배기가스 배출량은 ppm 단위로 비교하였다.
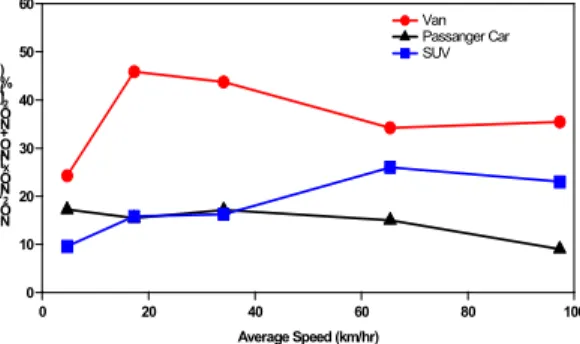
Fig. 2에는 각 NIER 모드를 평균차속으로 구분하 여 NO
2/NO
X결과를 나타냈다. 전체적으로 모든 차 량에서 약 0.1 이상의 NO
2/NO
X비율로 측정되었다.
Table 4에서 보는 바와 같이 승합차(Van)의 NO
2/
NO
X비율은 0.2~0.5로서 SUV와 승용차의 0.1~0.3, 0.1~0.3보다 다소 높은 NO
2배출을 보였다. 승용차는 저속구간에서 고속구간의 주행모드로 진행될수록 NO
2의 배출비율이 낮아졌다 . 그러나 SUV는 저속에 서 고속모드로 속도가 빨라짐에 따라서 NO
2의 배출 이 많아짐을 확인할 수 있었다.
Fig. 3은 EURO 5와 EURO 6의 배출가스 규제기 준별로 나타낸 것으로 저속구간을 제외한 나머지 구 간에서 EURO 5의 차량이 약 1~3.3배 높은 NO
2/NO
X배출비율을 보였다 . 이는 NO
X규제강화에 따른 결과
로 추정된다.
60 50 40 30 20 10 0 NO2 /NOX [NO +N O2 ] (%
)
100 80
60 40
20 0
Average Speed (km/hr) Van Passanger Car SUV
Fig. 3. Result of NOX concentration by driving test cycles
4. 결론
경유자동차에서 NO, NO
2를 차종별 및 규제별로 측정하여 고찰한 결과를 통해 다음과 같은 결론을 얻을 수 있었다.
1) 비분산적외선법과, 화학발광(Chemiluminescen- ce-Detector)법을 이용한 NO
X분석결과를 비교 하면 r
2는 0.83~0.96으로 높은 상관성을 확인하 였다.
2) NO
2/NO
X결과는 실험 차량 모두 0.1 이상의 값 을 보였다.
3) 배출가스 규제기준이 NO
X가 56% 강화됨에 따 라 NO
2의 배출 비율이 감소함을 알 수 있었다.
Reference
1. C. He, J. Li, Z. Ma, J. Tan, and L. Zhao, “High NO2/NOX
emissions downstream of the catalytic diesel particulate fil- ter: An influencing factor study”, Journal of Environmental Sciences, Vol. 35, 2015, pp. 55-61.
2. Y. J. Choi, W. Kmi, and K. J. Ko, “Analysis of the Reason for the Slow Reduction of Nitrogen Dioxide(NO2) Concentra- tion and Countermeasures in Seoul”, The Seoul Institute, 2011, pp. 1-199.
3. L. Cédric, M. Goriaux, P. Tassel, P. Perret, M. André, and Y.
Liu, “Impact of Aftertreatment Device and Driving Conditions on Black Carbon, Ultrafine Particle and NOX
Emissions for Euro 5 Diesel and Gasoline Vehicles”, Transportation Research Procedia, Vol. 14, 2016, pp.
3079-3088.
4. D. S. Kim, J. Jeong, and J. Ahn, “Characteristics in Atmospheric Chemistry between NO, NO2 and O3 at an Urban Site during MAPS (Megacity Air Pollution Study)-Seoul, Korea”, Journal of Korean Society for Atmospheric Environment, Vol. 32, 2016, pp. 422-434.
5. R. Suarez-Bertoa, P. Mendoza-Villafuerte, P. Bonnel, V.
Lilova, L. Hill, A. Perujo, and C. Astorga, “On-road meas- urement of NH3 and N2O emissions from a Euro V heavy-duty vehicle”, Atmospheric Environment, Vol. 139, 2016, pp. 167-175.
6. R. Suarez-Bertoa, A. A. Zardini, V. Lilova, D. Meyer, S.
Nakatani, F. Hibel, J. Ewers, M. Clairotte, L. Hill, and C.
Astorga, “Intercomparison of real-time tailpipe ammonia measurements from vehicles tested over the new world-harmonized light-duty vehicle test cycle (WLTC)”, Environmental Science and Pollution Research, Vol. 22, 2015, pp. 7450-7460.