DOI:http://dx.doi.org/10.5389/KSAE.2014.56.1.051
Assessment of the Effects of Urbanization on the Watershed Streamflow 유량에 미치는 도시화 영향 평가
Jung, Younghun*․Moon, Jongpil**․Lee, Seung Oh***․Park, Youn Shik****,†
정영훈․문종필․이승오․박윤식
ABSTRACT
도시화는 불투수면적의 증가로 인해 수문학적 변화를 초래하며 또한 지하수량의 감소와 지표유출의 증가와 같은 현상이 발생한다.
따라서 본 연구의 목적은 일유량을 기본으로 한 토지이용 변화 현상에 대한 영향을 정량적이고 공간적으로 다른 토지이용도를 이용하 여 산정하는 것이다. 이에 따라 본 연구에서는 ARCSWAT의 SWAT2005 버전을 이용하여 갑천 유역을 일유량으로 모의 하였다. 모형 의 검보정 후, 1997년부터 2001년 일유량으로 모의된 결과를 통계학적으로 분석하였고, 모의된 유량은 Mann-Whiteny method로 테스 트 하였다. 도시 면적이 28 % 차이가 있는 경우 SWAT의 유량 모의 결과는 5 % 유의수준에서 도시화의 영향이 모의된 유량에 크게 영향을 주는 것으로 나타났다. 그러나 도시화의 공간적 변화는 5 % 유의수준에서 유량의 변화에 미치는 영향이 거의 없는 것으로 나 타났다.
Keywords: ARCSWAT, Flood, Impervious area, Mann-Whitey method, Urbanization
I. INTRODUCTION*
As nature is affected by human activities, the hydrologic cycle cannot avoid the new circumstance. Climate change, groundwater use, and land cover change are typical factors affecting change of hydrologic response. Urban area, in particular, has such hydrologic characteristics as the decrease of infiltration rate and the reduced amount of evaporation.
As impervious areas like buildings, roads, compacted soil, and underground structures block the infiltration of rainfall, more surface runoff or overland flow results. There are a variety of sources influencing hydrologic response in urban area, but it is not an easy matter to show the effect of urbanization quantitatively. The changes of population and
* Dept. of Regional Infrastructure Engineering, Kangwon National University
** National Academy of Agricultural Science
*** Dept. of Civil Engineering, Hongik University
**** Department of Agricultural and Biological Engineering, Purdue University
† Corresponding author Tel.: +1-765-494-1162 Fax: +1-765-496-1115
E-mail: [email protected] 2013년 11월 8일 투고 2013년 12월 20일 심사완료 2013년 12월 24일 게재확정
land use are available to estimate degree of urbanization, and land use change data, in particular, is one of the most useful factors to analyze the hydrologic characteristics with geographic information system (GIS).
The changes of hydrologic and environmental responses to land use have been studied for preventing its negative aspects (Kim et al. 2002, 2005; Huang et al. 2009; Angassa et al. 2012). In particular, the urbanization gives a significant contribution to hydrologic and environmental variability in a watershed (Yoon and Lee 2004; Junior et al. 2010). Also, assessment of the land use on such variability has been mostly assessed based on the temporal change in land use.
However, the influence of spatial configuration of land use on hydrologic response has been relatively less studied. In this regard, it is necessary to consider the spatial influence of land use change on hydrologic and environmental responses due to variability in the conveyance capacity of a watershed (Olivera and Defee 2007).
In this study, after investigating the characteristics of urbanization with land use change and estimating the runoff in an urbanizing watershed by using the Soil and Water Assessment Tool (SWAT), a distributed rainfall-runoff model, the spatial distribution of urbanization affecting the runoff
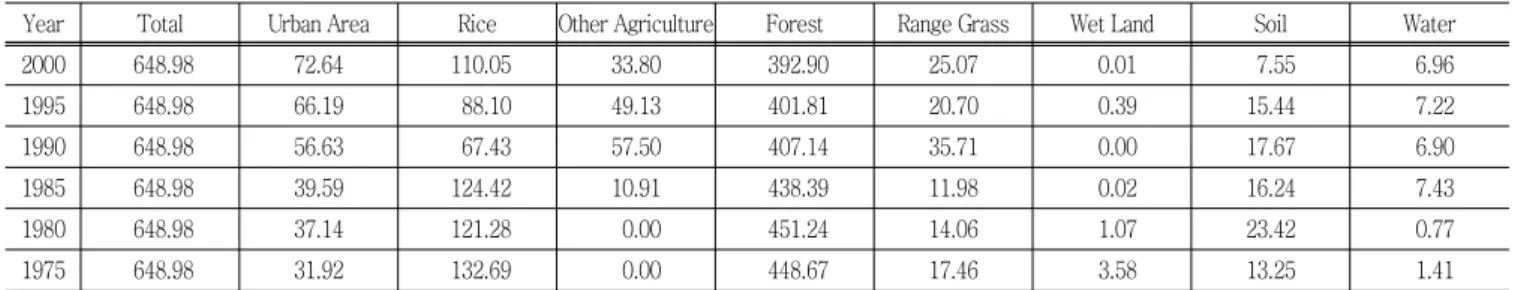
Table 1 The change of land use with time in Gapcheon watershed [km2]
Year Total Urban Area Rice Other Agriculture Forest Range Grass Wet Land Soil Water
2000 648.98 72.64 110.05 33.80 392.90 25.07 0.01 7.55 6.96
1995 648.98 66.19 88.10 49.13 401.81 20.70 0.39 15.44 7.22
1990 648.98 56.63 67.43 57.50 407.14 35.71 0.00 17.67 6.90
1985 648.98 39.59 124.42 10.91 438.39 11.98 0.02 16.24 7.43
1980 648.98 37.14 121.28 0.00 451.24 14.06 1.07 23.42 0.77
1975 648.98 31.92 132.69 0.00 448.67 17.46 3.58 13.25 1.41
will be analyzed. Among many rainfall-runoff models, the SWAT (Arnold et al. 1995) is a river basin, or watershed, scale model (Neitch et al., 2005). ARCSWAT is an extension of SWAT2005 that can run in the ARCGIS tool. In addition, all hydrologic data such as temperature, precipitation, and runoff and geographic data like land use and elevation will be stored in geographic information system for convenience.
It is necessary to calibrate the runoff simulated by the distributed rainfall-runoff model for the change of land use.
The calibrated model will be used to analyze the effect of the increased urban area on runoff between 1997 and 2001.
Also, by using a semi-distributed model, it is possible to analyze the change of the hydrologic response affected by the place where the urban development happens in a watershed.
We can prepare a strategy in city planning to minimize the damages from floods and droughts or to maximize the benefit of flood control with various scenarios because GIS tools help to apply a variety of circumstances to the distributed model easily. Accordingly, the objective of this study is to analyze how the spatial and quantitative changes of land use influence hydrologic response. To reach this objective, a set of two scenarios will be applied in this study.
The relationship between mean daily streamflow and land use will be investigated by analyzing statistically the results of simulation with various scenarios. In particular, we will be able to understand the degree of flood risk by analyzing mean daily streamflow simulated in wet seasons. Finally, after analyzing and normalizing the spatial-temporal effect of urbanization on hydrologic factors, a strategy to minimize the change in hydrologic response by urbanization will be examined. This last thing was not done, so should not be mentioned here.
II. METHODOLOGY
1. Description of Study Watershed
Gapcheon watershed in which about 1,500,000 people live is located in the middle of South Korea. The watershed contains Deajeon, the 5th biggest city in South Korea, which has rapidly developed during the past two decades.
Deajeon is an alternative city to block population explosion of Seoul. The urbanization of Gapcheon watershed has been raised as a serious issue with the increase of population.
Table 1 shows the change of land use with time provided by Korean Water Management Information System (WAMIS).
The study watershed, which is a sub-basin of the 649 km2 Gapcheon watershed drains approximately 597 km2 of land (Fig. 1). Because the study area occupies 92 percent of Gapcheon watershed and the stream gauge is available at Heodeok, we will consider the study area as Gapcheon watershed. In Gapcheon watershed the average elevation is
Fig. 1 Study watershed
(a) 1990 (b) 2000
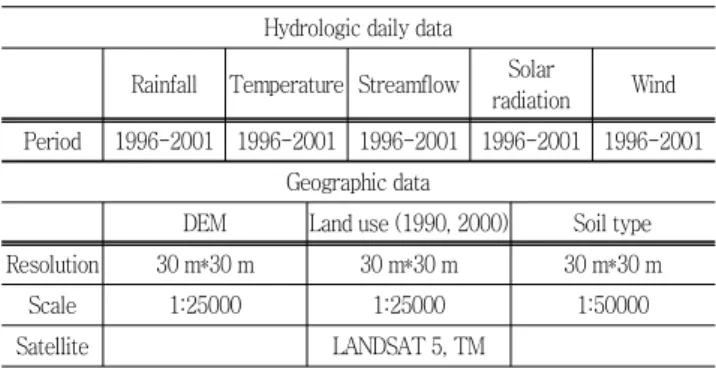
Fig. 2 land use maps in 1990 and 2000 for scenario 1 Table 2 Information for input dataset
Hydrologic daily data
Rainfall Temperature Streamflow Solar
radiation Wind Period 1996-2001 1996-2001 1996-2001 1996-2001 1996-2001
Geographic data
DEM Land use (1990, 2000) Soil type
Resolution 30 m*30 m 30 m*30 m 30 m*30 m
Scale 1:25000 1:25000 1:50000
Satellite LANDSAT 5, TM
Source from WAMIS
about 175.65 meters, the average watershed slope is about 28 percent, and the average watershed width is about 10.77 kilometers. The average annual rainfall and temperature of the Gapcheon wastershed are about 1,354 mm and 12.3 ℃, respectively.
2. Description of Dataset
SWAT can simulate streamflow, sediment transport and water quality. For simulation of streamflow, weather data such as rainfall, wind, humidity, solar radiation, and tem- perature and maps to spatially plot land use and soil type are required. Streamflow data is needed for calibration and validation. There are six rainfall gage stations, but the only
station that provides rainfall data and temperature data between 1971 and 2000 is Deajeon station, which is located near the mouth of the watershed. SWAT provides three methods to calculate the amount of potential evapotranspiration.
Data of wind, humidity, solar radiation besides temperature should be added to use Penman-Monteith method.
Heodeok gauge station is the only available for historic water level data. In order to investigate the effect of land use change between 1990 and 2000, land use map for each year is used. It is difficult to simulate streamflow with data of one year because SWAT is long-term model and the soil moisture data in Gapcheon watershed is not provided. If soil moisture data is absent, it can be a weakness because initial soil moisture in SWAT would be zero as default.
However, the use of span-up period for simulation of streamflow can give a contribution to reduction of the error by absence of soil moisture data. Digital Elevation Model (DEM) of Gapcheon watershed is resolved with the grid size of 30 meters (Fig. 1). WAMIS provides 30-meter resolution land use maps of the watershed developed from Landsat 5 Thematic Mapper (TM) data (Figs. 2, 3).
3. Description of Scenarios
The effect of urbanization on streamflow are assessed for
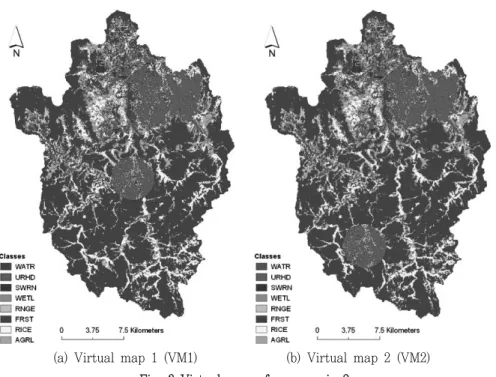
(a) Virtual map 1 (VM1) (b) Virtual map 2 (VM2) Fig. 3 Virtual maps for scenario 2
Table 2 Description of Scenarios
Scenario Purpose Land use map
Scenario 1Assessment of the effects of urban size on
streamflow 1990 versus 2000
Scenario 2Assessment of the effects of urban locations on
streamflow (upper and downstream) VM1 versus VM2
spatially and quantitatively different scenarios. two scenarios are summarized in Table 2 and Figs. 2, 3.
A. The quantitative changes of land use influencing hydrologic response (Scenario 1)
Urban area in the year 2000 increased by about 28 percent over the urban area in the year 1990. Therefore it is necessary to identify the difference of streamflow between 1990 and 2000 due to the change of land use. However, not only land use affects the streamflow because hydrologic response is strongly dependent on climate variability. Thus, to compare streamflows of 1990 and 2000 is not efficient for analyzing the impact of land-use change. So, one scenario will be constructed to resolve this problem. After completing the calibration and validation for 2000 land use maps, it is to exchange only the weather data. In other words, weather data of 2000 and land use map of 1990 were applied to model calibrated by weather data and land use map of 2000 (Fig.
2). This scenario will show how the size of urbanization in study watershed affects the daily streamflow.
B. The spatial changes of land use influencing hydrologic response (Scenario 2)
The spatial land use change can be propagated to hydro- logic and environmental responses due to variability in the conveyance capacity of a watershed (Olivera and Defee 2007).
It is generally expected that urbanization in downstream, watershed has more impact on hydrologic response than in upstream watershed. However, it is doubtful whether daily simulation can catch the change of peak flow according to spatially different land use. The other scenario will be constructed to illustrate the expectation and the doubt by simulating daily streamflow. In this regard, input data in simulation of this scenario consist of 1997-2001 weather data and two maps modifying the land use map of 2000.
The existing non-urban areas located at upper and central watersheds were replaced with the urban area clipped from use maps of 2000 respectively (Fig. 3).
4. Description of ARCSWAT
ARCSWAT is an extension available in geographic in- formation system of SWAT2005 which is a continuous-time,
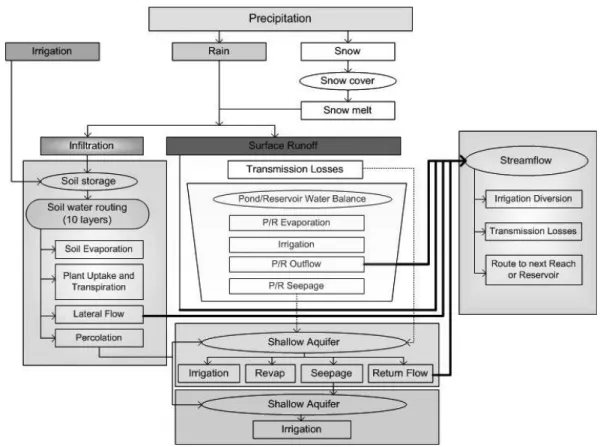
Fig. 4 Schematic of pathways available for water movement in SWAT (Neitsch et al. 2005) long-term, and semi-distributed model to simulate surface
and subsurface runoff, sediment transport and water quality in the watershed system. SWAT enables a watershed to be partitioned into sub-basins that have different hydrologic data, or Hydrologic Response Units (HRUs) consisting of distinctive combinations of land cover, soils, and management for each sub-basin. By HRU delineation, the computation time can be reduced because the similar soil and land use areas are considered as lumped units (Neitsch et al., 2002).
Water movement simulated by SWAT in the HRU is shown in Fig. 4.
The basic concept of SWAT for hydrologic cycle comes from the water balance equation 1:
(1)
: The final soil water content (mm H2O), : The initial soil water content on day i (mm H2O), : The amount of precipitation on day i (mm H2O), : The
amount of surface runoff on day i (mm H2O), : The amount of evapotranspiration on day i (mm H2O), : The amount of return flow on day i (mm H2O), : The amount of water entering the vadose zone from the soil profile on day i (mm H2O).
NRCS curve number procedure and the Green and Ampt infiltration method are used for estimating surface runoff in SWAT. Also, SWAT provides the Penman-Monteith method, the Priestley-Taylor method, and the Hargreaves method to estimate potential evapotranspiration. In this study, NRCS curve number and Penman-Monteith method are used to estimate surface runoff and potential evapotranspiration, respectively. The kinematic storage model based on mass continuity equation used to estimate subsurface flow. For groundwater flow, SWAT simulates a shallow aquifer which supplies return flow to stream within the watershed system and a deep aquifer affecting streams outside the watershed (Arnold et al., 1993). In order to run SWAT, many input data are required. Data treated in this paper are rainfall, daily streamflow, temperature, radiation, wind speed, elevation,
(a) Calibration
(b) Validation
Fig. 5 The results of calibration and validation for SWAT simulation land use, and soil type dataset consist of documentary data
and map. ARCSWAT enables all data to interact in geographic information system.
5. Description of statistical test
The non-parametric test used in this study is the Mann- Whitney test to compare the medians of results from 2 scenarios. The step of Mann-Whitney test is following as:
1) Assumption: Independently and identically distributed 2) Null hypothesis, : Medians are equal
3) Test statistics:
: the sum of the rank of the smaller group of data
of the rank:
,
where and
4) Decision rule: reject if
III. RESULTS AND DISCUSSION 1. Model Calibration and Validation
SWAT 2005 provides the auto-calibration method with Shuffled Complex Evolution (SCE-UA), an optimization technique. For calibration, weather data from 1996 to 2000 and 2000 land use data were used. Span-up period for recharging the soil moisture of SWAT model was from 1996 to 1999 due to a focus on the effect of land use on 2000 daily streamflow. As a result, the Pearson correlation coefficient (ρ) and Nash-Sutcliffe efficiency (NSE) between simulated and observed data of 2000 are 0.914 and 0.795, respectively (Fig. 5.a). The parameters were calibrated to match the observed data very well. Validation with the optimized parameters was performed for 2001. The Pearson
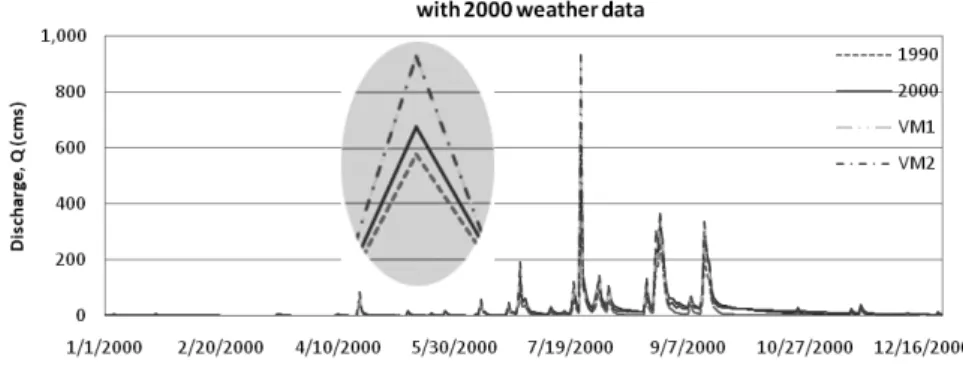
Fig. 6 Simulated daily streamflow for quantitative different land use maps correlation coefficient and NSE for validation period are
0.740 and 0.621, respectively (Fig. 5.b). In validation period, the difference between the observations and the simulations is relative large in the dry season. One of the reasons for this difference might be due to low streamflow during dry season in calibration period. In other words, the model parameters related to low flow was calibrated for lower streamflow during dry season in calibration period that validation period.
2. The analysis of the simulations for spatially and quantitatively different scenarios
The results from two different scenarios show that the maximum daily streamflow are 579 m3/s for the year 1990, 677 m3/s for the year 2000, 928m3/s for VM1 and 931 m3/s for VM2 (Table 3 and Fig. 6). Based on these results, spatially different land use on the study watershed (scenario 1) did not strongly influence daily streamflow (VM1 Vs VM2 in Fig.
6). Streamflow is affected by travel time to reach the river from precipitation in the watershed. In particular, prediciton of flood is dependent on the model time step because the peak flow can take place within only a few hours after precipitation event begins. In addition, the change of land use leads to more direct runoff. Unfortunately, SWAT model
Table 3 Results of the estimated streamflow for four different land use maps
Hydrologic index Land use map
1990 2000 VM1 VM2
Maximum daily streamflow (m3/s) 579 677 928 931 Yearly streamflow (million m3) 340 621 653 654
used in this study does not provide hourly simulation. As a result, we illustrated that the simulation for daily streamflow can not catch the effect of spatially different land use.
However, the size of the urbanized area (scenario 2) gives a significant contribution to simulation of daily streamflow (Fig. 6). As the urban area increases, higher magnitude of daily stream flow is simulated. This phenomenon is clearly shown in peak flow. Therefore, we demonstrated that the quantitative change of land use on daily streamflow affects daily streamflow through the simulation by using SWAT model.
The results from scenarios were examined by Mann- Whitney method, a statistical test. The null hypothesis that medians of streamflows simulated by scenarios VM1 and VM2 considering spatiality of urbanization are equal is accepted with 5 % significance level (Table 4). Based on the statistical test, it is illustrated again that the simulated daily streamflow for spatially different land use maps is almost unchanged. On the contrary, there is significant difference between streamflows simulated by 1990 and 2000 which have different quantity of urbanization. Z statistics of Mann-Whitney test is -8.32, which indicates null hypothesis to be rejected (Table 5). Therefore, daily streamflow in
Table 4 Results of Mann-Whitney test for streamflow simulated by VM1 and VM2
Groups n Rank sum Mean rank U
WM1 366 134218 366.72 66899
VM2 366 134060 366.28 67057
Median difference 0.002
95.0 % CI -0.338 to 0.348 (normal approximation)
Mann-Whitney's statistic 66899
Z statistic 0.03 (accept)
Table 5 Results of Mann-Whitney test for streamflow simulated by 1990 and 2000 land use maps
Groups n Rank sum Mean rank U
1990 366 110348 301.5 90769
2000 366 157930 431.5 43187
Median difference -1
95.0 % CI -2 to -1 (normal approximation)
Mann-Whitney's statistic 90769
Z statistic -8.32 (reject)
Gapcheon watershed is largely dependent on the size of urbanization.
IV. CONCLUSIONS
In this study, we attempted to evaluate the effect of land use change on daily streamflow in Gapcheon watershed by using the calibrated and validated SWAT model. In addition, the calibrated SWAT model was used to estimate streamflow for two scenarios considering spatial and quantitative change in land use. The results from SWAT simulations using the scenarios were statistically analyzed by the non-parametric test.
Spatial change of land use in the Gapcheon watershed has no significant influence to daily streamflow, whereas quan- titative change of land use plays a critical role. Based on statistical test, we illustrated that the medians between streamflows simulated for 1990 and 2000 land use maps are significantly different, but the simulated streamflow for spatially different land use maps was almost unchanged. Also, it was illustrated that simulation for daily streamflow could not catch the effect of spatially different land use in Gapcheon watershed because time step of one day is too long to estimate peak flow which occurs within only a few hours.
Moreover, topographic characteristics that the Gapcheon watershed is a mountainous terrain support the short travel time. In future, it is required to construct the strategies to control flood according urbanization. Also, physical rainfall- runoff model with shorter time interval is required to forecast more accurate peak flow.
This research was supported by the GAIA Project (No:
2012000540017) and the GAIA project (No: 20120005 40001) in Korea.
REFERENCES
1. Angassa, A., B. Sheleme, G. Oba, A. C. Treydte, A.
Linstädter, and J. Sauerborn, 2012. Savanna land use and its effect on soil characteristics in southern Ethiopia.
Journal of Arid Environments 81: 67-76.
2. Arnold, J. G., J. R. Williams, and N. B. Sammons, 1990.
SWRRB: A basin scale simulation model for soil and water resources management. Texas A&M Univ. Press.
College station, TX.
3. Arnold, J. G., P. M. Allen, and G. Bernhardt, 1993. A comprehensive surface-groundwater flow model. Journal of Hydrology 142: 47-69.
4. Arnold, J. G., J. R. Williams, R. Srinivasan, and K. W.
King, 1995. SWAT: Soil water assessment tool: User Manual, Texas A&M Univ., Texas Agricultural Experiment Station, Blackland Research Center, Temple, TX.
5. Harbor, J., 1994. A practical method for estimating the impact of land use change on surface runoff, groundwater recharge and wetland hydrology. Journal of the American Planning Association 60: 91–104.
6. Huang, J. C., T. Y. Lee, S. J. Kao, S. C. Hsu, H. J. Lin, and T. R. Peng, 2012. Land use effect and hydrological control on nitrate yield in subtropical mountainous watersheds. Hydrology and Earth System Sciences, 16(3): 699-714.
7. Junior, O. C., R. Guimaraes, L. Freitas, D. Gomes- Loebmann, R. A. Gomes, E. Martins, and D. R. Montgomery, 2010. Urbanization impacts upon catchment hydrology and gully development using mutli-temporal digital elevation data analysis. Earth Surface Processes and Landforms 35(5): 611-617.
8. Kim, H. K., M. S. Kang, E. J. Lee, and S. W Park, 2011.
Climate and Land use Changes Impacts on Hydrology in a Rural Small Watershed. Journal of the Korean Society of Agricultural Engineers 53(6): 75-84.
9. Kim, Y., B. A. Engel, K. J. Lim, V. Larson, and B. Duncan, 2002. Runoff impacts of land-use change in Indian river lagoon watershed. Journal of Hydrologic Engineering 7(3): 245-251.
10. Kim S. J, H. J. Kwon, G. A. Park, and M. S. Lee, 2005.
Assessment of land-use impact on streamflow via a grid-based modeling approach including paddy fields.
Hydrological Processes 19(19): 3801-3817.
11. Neitsch, S. L., J. G. Arnold, J. R. Kiniry, R. Srinivasan, and J. R. Williams, 2002. Soil and Water Assessment Tool: User Manual, Version 2000. Grassland, Soil and Water Research Laboratory, Temple, TX.
12. Neitsch, S. L., J. G. Arnold, J. R. Kiniry, and J. R. Williams, 2005 Soil and Water Assessment Tool; Theoretical Documentation. Texas Agricultural Experiment Station, Blackland Research Center, Temple, TX.
13. Olivera, F., and B. B. DeFee, 2007. Urbanization and Its Effect on Runoff in the Whiteoak Bayou Watershed, Texas. Journal of the American Water Resources Association (JAWRA) 43(1): 170-182.
14. USDA (U.S. Department of Agriculture), 1986. Urban hydrology for small watersheds. Technical Release 55, Soil Conservation Service, Washington, D.C.
15. WAMIS: http://www.wamis.go.kr/MS/main.aspx.
16. Yoon, S. H. and J. H. Lee, 2004. Runoff Characteristics by Urbanization in the Mushim Stream Watershed using HEC-BMS, Journal of the Korean Society of Agricultural Engineers 46(3): 43-54.