Introduction
Pollutant sources affecting water quality can be divided into point sources and nonpoint sources (NPS). Pollutants from point sources enter the surface water from easily identifiable, distinct locations through a direct route (Im, 2004). These pollutants are very easy to control. nonpoint source pollution originates from various diffuse sources and is often called diffuse pollution. The diffuse sources include a variety of land use practices, such as farming, grazing, construction, mining, and land fill. nonpoint source pollution is runoff pollution caused by rainfall runoff moving over and through the soil. As the runoff moves, it picks up both natural and human-made pollutants and deposits them in nearby lakes and rivers (Yoo and Kang, 2004).
In the early stage of Korea's policy-making on environment concerning water quality, NPS pollution received lesser attention than the point source pollution.
Korea's water quality was considerably improved, but controlling point source pollution alone did not solve all
the water quality problems In the early 2000's, Korean policy makers realized and agreed that the majority of the remaining water quality problems resulted from NPS. So, Korea has changed the emphasis of its environmental policies from management of point sources to that of nonpoint sources (Kim et al., 2005).
Recently, agriculturally derived NPS pollutants that are discharged mainly during the rainy season have been given priority attention. Since these pollutants are very difficult to analyze quantitatively, several studies on water quality problems from agricultural activities have been carried out all over the country (Kim et al., 2003).
Monitoring of water quality and hydrology is essential to determine effluent characteristics and to identify the best management practices to reduce the water pollutant loads from agricultural activities.
Thus, This study was conducted to determine the effluent characteristics in a small agricultural watershed and to estimate the runoff of NPS pollutants through the use of a NPS pollution model called SWAT (Soil and Water Assessment Tool).
SWAT is a physically-based, continuous model (Arnold et al., 1994). It operates on a daily time step and is
Received : 17 January 2007 Accepted : 5 February 2007*Corresponding author: Phone : +82312900221, E-mail : [email protected]
Estimation of Nonpoint Source Pollutant Loads for Rural Watershed by AvSWAT
Jin-Ho Kim
1,
*Jong-Sik Lee
1, Won-Il Kim
1, Goo-Bok Jung
1, Kuk-Heon Han
1, Jong-Su Ryu
1, Suk-Cheol Kim
2, Sun-Gang Yun
2, Jeong-Taek Lee
1, and Soon-Kuk Kwun
31
Division of Environment & Ecology, National Institute of Agricultural Science & Technology, RDA, Suwon 441-707, Korea
2
Division of Research Management, Rural Development Administration, Suwon 441-707, Korea
3
Department of Landscape Architecture & Rural System Engineering, Seoul National University, Seoul, 151-742, Korea
This study was conducted to evaluate the characteristics of nonpoint source pollutants discharge from a small rural watershed. A typical rural area in Gongju City, Korea, was selected as the research site. Water quality and quantity in streams and rainfall samples were analyzed periodically from May to October 2005.
Pollutant loads were estimated from a nonpoint source pollution model (AvSWAT, Arcview Soil and Water Assessment Tool). During the rainy season, from June 26 to 30 September 2005 and the dry season, before 26 June and after 30 September 2005, biological oxygen demands and chemical oxygen demands accounted for 91.3% and 93.7% of annual load, respectively, while total-N and total-P were 97.1% and 91.1% of annual load, respectively. The observed stream flow was 66.5 m
3sec
-1, while simulation stream flow was 66.2 m
3sec
-1. That can be assumed that simulation can be used to estimate the stream flow without practical measurement. However, the runoff trend following the occurrence of a storm event was not recorded properly.
Key words : AvSWAT, Nonpoint source, Rural watershed
designed to predict the impacts of management practices on hydrology, sediment, and water quality in an ungauged watershed. Major model components include weather generation, hydrology, sediment, crop growth, nutrients and pesticides (Neitsch et al., 2001). The watershed is subdivided into hydrologic response units, which have unique soil and land use characteristics. A more detailed description of the model can be found in Neitsch et al. (2001).
The water balance of each hydrologic response unit is represented by four storage volumes: snow, soil profile (0 to 2 m in depth), shallow aquifer (2~20 m in depth), and deep aquifer (greater than 20 m in depth). SWAT uses the US Soil Conservation Service's Curve Number method to compute surface runoff from daily rainfall amount. A modified rational method and SCS TR-55 - hydrologic analysis model interfaced to the US Soil Conservation Service - methods are used to compute the peak runoff rate. Three methods, the Penman-Monteith, Hargreaves- Samani, and Priestley-Tailor methods are also used for estimating evapo-transpiration within SWAT (Arnold et al., 1994).
For nitrogen simulation, SWAT considers nitrate loss in surface runoff, nitrate leaching, organic nitrogen transported by sediment, denitrification by microbial processes, mineralization, addition of nitrogen by rainfall, uptake of nitrogen by crops, and immobilization. SWAT also simulates soluble phosphorus lost in runoff, P transported by sediment, P mineralization and P immobilization (Arnold et al., 1994). So, the SWAT model was used for estimating nonpoint source pollution loads of the experimental watershed. And the objective of this study was to know the possibility of the AvSWAT application for rural watershed in Korea.
Materials and Methods
Procedures An extensive database was constructed for the area being studied, including meteorological, hydrological, and GIS (Geographic Information System) data from May. to Oct. in 2005. These data were used by AvSWAT (ArcView Soil and Water Assessment Tool) to estimate NPS pollutant loads.
Study area The research site is located in the middle of the south Korean Peninsula (Fig. 1). There was a typical rural area without any industrial facilities. But there was a small livestock area at the site and all
wastewater has been taken away.
Model Development SWAT requires land use data such as reach data, meteorological data, and information on the pollutants of concern in the watershed and the stream reaches.
Digital Elevation Model (DEM) The DEM (spatial resolution: 5m × 5m) of the research site was prepared from 1:5000 NGIS (National Geographic Information System) digital maps (NGII, 2005).
The Agreeburn preprocessing technique was used to generate an accurate stream network in the plain regions and watershed boundaries. The stream-centered line was extracted from the NGIS digital maps.
In a small rural watershed, the distortion of flow of the stream network was at the topography. Hence, the DEM had to be corrected by using the preprocessing technique to achieve a more accurate spatial resolution.
Land use map For this study, a land use map (1:25,000 scale) drawn by the Korean National Institute of Agricultural Science & Technology (NIAST) was reclassified into eight land uses (paddy, upland, orchard, grassland, forest, residential, stream, and the other). Table 1 and Table 2 shows the land use and the human and livestock populations at the research area.
Soil map The 1:5,000 scale soil map drawn by NIAST was reclassified by soil type (RDA, 1992)
Meteorological and hydrological data Temperature, rainfall, wind direction, wind speed, and solar radiation were collected from AWS (Automatic Weather System).
Water samples were collected at the 12 sites every 2
Fig. 1. Study area of this study.weeks, and biological oxygen demand (BOD), total N (T- N), total P (T-P) and suspended solids (SS) were analyzed by the Korean Standard Methods for Water Quality (MOE, 2002). The water level data were collected at three water flow sites every 5 minutes, and water flows were calculated with a stage-discharge equation derived from flow data calculated from water speed and depth at the sampling times.
Results and Discussion
Rainfall and discharge Table 3 shows the rainfall and daily runoff at the research site from May to October in 2005. The total amount of rainfall was 1389.6 mm, while the average and the range of rainfall were 20.8 mm and 0.2 to 146.6 mm, respectively, on rainy days. Two rainfall events are exceeded 100 mm in precipitation during the research period. The amount of runoff was estimated from a rating curve drawn from runoff data collected every 2 weeks and during rainy days. The amount of runoff amount and rate at site C, the final outlet, were characteristic of mountain streams. The coefficient of correlation between flow and depth was showed very high 0.9735.
Analysis of water quality Table 4 shows the characteristics of water quality during the dry season and the rainy seasons. The concentrations of T-N and T-P during the rainy season were higher than those during the
dry season. Thus, agricultural activities were the main source of pollutant loads.
Table 5 shows the characteristics of runoff pollutant loads during the dry season (5 May to 25 June and 1 to 31 October) and the rainy season (26 June to 30 September). In watershed C during the rainy season, BOD accounted for 91% of total demand, COD for 94%, and T-N and T-P for 97% and 91% of the annual load, respectively. This means that the pollutant loads originated from nonpoint sources (Kim et al., 2003).
Model application results The AvSWAT Model using GIS data, hydrologic and meteorological data, and water quality data was simulated to estimate the runoff of NPS pollutants. From 1st January 2004 to 31st December 2004, the project was setup. And from 25th May 2005 to 31st July 2005, all data were calibrated. Simulation for
Paddy
--- ha ---
46.4(9.0) 21.8(4.3") 22.5(4.4) 3921(76.3) 12.4(2.4) 18.5(3.6)
"
Proportion of landuse area to total area
Other Residential
Forest Orchard
Upland
Table 1. Land use areas of the research site.
Poultry Deer
Pig Beef cattle
Human
186 19 4827 19 166
Table 2. Population in the research site.
Sub-watershed
Sub-watershed A Sub-watershed B Sub-watershed C
1.89 1.45 5.14
1,666 1,280 5,741
883 880 1,118
1,390 1,390 1,390
64 63 80 Runoff ratio Rainfall
Runoff Area
km2 103m3 mm mm %
Table 3. Rainfall and runoff in the sub-watersheds.
T-P T-N
BOD Statistics
"
from 5 May to 25 June and 1 Oct. to 31 Oct.
‡from 26 June to 30 Sept.(1-hour interval) Standard deviation
0.93 1.99 0.31 0.52
3.16 8.73 0.01 1.81
2.75 4.01 0.27 1.34
3.20 9.26 1.84 1.46
0.058 0.106 0.006 0.031
0.236 2.952 0.018 0.287 avg.
max min SD
avg.
max min SD
Table 4. Descriptive statistics of water quality properties.
--- mg L-1--- Dry season"(n=9)
Rainy season‡(n=250)
verification using AvSWAT was from 25th May to 31st December 2005.
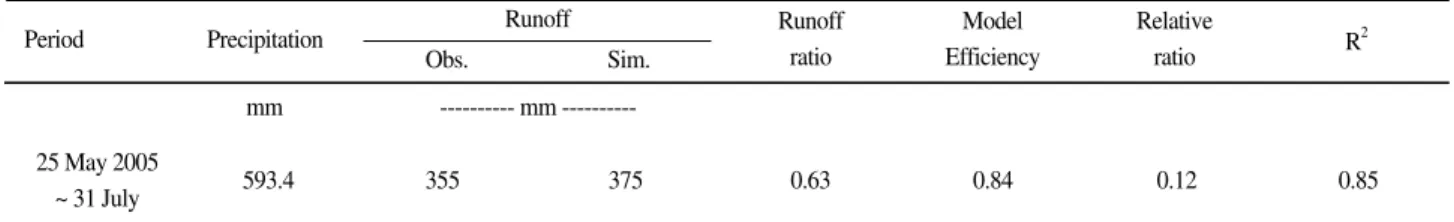
Model calibration Table 6 shows the simulated results during the calibration periods. During the calibration periods, the runoff rate was 63%, and the model efficiency was 0.84 while the decisive coefficient between observed and simulated data was 0.95.
Model verification Table 7 shows the simulated data using the parameters that were used for calibration from 25th May to 31st December 2005. The rainfall was 1,435 mm during the periods, and the simulated runoff was 1,023 mm. Thus, simulated runoff ratio was 71%.
The relative error between observed and simulated runoff was 6%, and the model efficiency was 0.76.
Verification result showed that the decisive coefficient was 0.83. But there were differences between the runoff tendency and the observed data from November to December. Because the calibration period was set from May to July, it was impossible to reflect the influence of the snowmelt was not at all reflected.
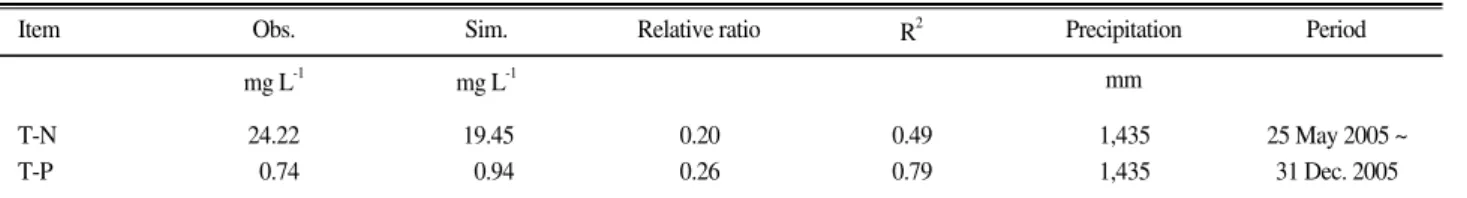
Table 8 shows the simulated and observed T-N and T-P data at the site. The simulated T-N was 19.45 kg L
-1; it is lower than the observed T-N of 24.22 kg L
-1. The determinated coefficient was 0.49. It was comparatively low. On the other hand, simulated T-P was higher than the observed by about 26%. The decisive coefficient was 0.79, which was much higher than that of the T-N value.
In the case of T-P, the simulated peak runoff occurred at the peak flow time.
Sub-watershed
"
Dry season : 5. May. 2005 - 25. June 2005 and 1-31 Oct. 2005
‡Rainy season : 26. June. 2005 - 30 Sept. 2005 Sub-watershed A
Sub-watershed B Sub-watershed C
Sub-watershed A Sub-watershed B Sub-watershed C
Sub-watershed A Sub-watershed B Sub-watershed C
325.2 271.9 642.9
3,008.3 1,881.2 6,776.3
3,333.6 2,153.0 7,419.2
592.4 695.4 362.8
3,008.3 1,881.2 6,776.3
5,153.4 3,801.6 12,533.9
17.21 18.82 40.32
166.04 101.72 415.32
183.24 120.54 455.64
3,925.0 1,259.2 7,521.0
88,692.3 47,863.8 178,795.8
92,617.3 49,123.0 186,316.8
SS T-P
T-N BOD
Table 5. Pollutant loads of each sub-watershed.
--- kg ---
Dry season"
Rainy season‡
Total
Period
25 May 2005 ~
31 Dec. 2005 1,435 967 1,023 0.71 0.76 0.06 0.83
Precipitation
Obs.
Runoff Sim.
Runoff ratio
Model Efficiency
Relative
ratio R2
mm --- mm --- Table 7. Verified results of stream flow.
Period
25 May 2005
~ 31 July 593.4 355 375 0.63 0.84 0.12 0.85
Precipitation
Obs.
Runoff Sim.
Runoff ratio
Model Efficiency
Relative
ratio R2
mm --- mm --- Table 6. Simulated results of stream flow.
Conclusion
Watershed models can be used in predicting nonpoint source pollution for watersheds, and evaluating the impact of different land use practices and sources. Many models are available to estimate the nonpoint source pollutants. But they have different strengths and limitation. So, the selection of the model should depend on the objective of the study, the available resources and data. In this study, SWAT was selected to simulate nonpoint source pollution at a rural small watershed in Korea. Most of the parameters are automatically generated from GIS data. But some of data is needed to get from the farmers and the researchers. After simulating SWAT at the site, the quantity and trend of runoff was showed the good results but the trend of runoff following the single storm event was not showed properly.
Especially, there were some problems to show the trend of runoff of low water level at a period of water shortage.
References
Arnold, J., A. Williams, R. Shinivasan, B. King, and A. Giggs.
1994. SWAT, Soil and water assessment tool. Temple, TX 76502.
ARS, USDA.
Engman, E.T. 1986. Roughness coefficients for routing surface runoff. J. Irri. & Drain. Eng., 112(1):39-53.
Im, S. J. 2004. Towards an engineering tool for assessing nonpoint source pollutant loads for a watershed, International symposium on management strategies for agricultural and rural nonpoint source pollution. NIAST
Kim, J. H., J. S. Lee, J. S. Ryu, K. D. Lee, G. B. Jung, W. I. Kim, J.
T. Lee, and S. K. Kwun. 2005. Characteristics of nonpoint source pollutants discharge in a small agricultural watershed during farming season. Korean Journal of Environmental Agriculture.
24(2):77-82.
Kim, S. M., M. S. Kang, and S. W. Park. 2003. Estimation of pollutant loadings from agricultural small watershed using the unit loading factor and water quality monitoring. Journal of the Korean Society of Agricultural Engineers. 45(3):94-102.
Kwon, Y. H., S. I. Han, and J. B. Lee. 2002. Pollution loadings in DaeChungho watershed. Journal of Korean Society of Water and Wastewater. 16(5):581-595.
Neitsch, S. L., J. G. Arnold, J. R. Kiniry, and J. R. Williams. 2001.
Soil and water assessment tool the theoretical documentation (version 2000). U.S. Agricultural Research Service.
NGII. 2005. NGIS numerical digital maps.
NIAST. 2004. International symposium on management strategies for agricultural and rural nonpoint source pollution.
MOE. 2002. The Korean standard methods for water quality.
RDA. 1992. The Korea soil database, RDA Report No. 13. Suwon.
Korea: Rural Development Administration.
Yoo, K. H. and M. S. Kang. 2004. Agricultural nonpoint source(NPS) pollution and best management practices in the United States, International symposium on management strategies for agricultural and rural nonpoint source pollution. NIAST.
Item
T-N T-P
24.22 0.74
19.45 0.94
0.20 0.26
0.49 0.79
1,435 1,435
25 May 2005 ~ 31 Dec. 2005
Period Precipitation
R2 Relative ratio
Sim.
Obs.
mg L-1 mg L-1 mm
Table 8. Verified results of water quality.
유역관리모형은 유역내 비점원 오염부하를 예측하고, 서로 다른 오염원과 토지이용형태에 따른 영향을 판단하 는데 사용 되어진다. 많은 모형들이 비점원오염의 예측이 가능하지만, 각기 서로 다른 한계를 갖고 있다. 모델 의 선택의 연구목적과 축적된 가용자료에 부합해야 한다. 최근 한국에서는 SWAT모형이 농촌유역의 비점원오 염 유출을 예측하기 위해서, 많이 이용되고 있다. 대부분의 자료들이 GIS를 이용하여 자동적으로 생성되지만, 일부 자료들은 농민들과 연구자들을 통해 직접 수집해야 한다. AvSWAT모형에 의해 시뮬레이션된 유량과 관 측유출은 매우 좋은 결과를 나타내었다. 그러나 유출은 경향은 주로 강우와 물부족기간에 의해 그 경향을 따라 간다. AvSWAT 모형을 농촌유역에 적용하여 유출을 평가한 결과 모델치는 1023.3 mm이고, 관측치는 967.4 mm인 것으로 나타났다. 또한 수질의 경우 모델치와 관측치의 결정계수는 인이 질소보다 더 높은 값(0.79)을 보여주고 있었다.
AvSWAT를 이용한 농촌유역 비점원 오염물질 부하량 예측
김진호1,*·이종식1·김원일1·정구복1·한국헌1·류종수1·김석철2·윤순강2·이정택1·권순국3
1농업과학기술원 환경생태과, 2농촌진흥청 연구관리과, 3서울대학교 조경·지역시스템공학부