토양수분모형을 이용한 미래 주요 밭작물 소비수량 및 관개용수량 전망
Projection of Consumptive Use and Irrigation Water for Major Upland Crops using Soil Moisture Model under Climate Change
남원호*・ 홍은미**,†・ 장민원***・ 최진용****
Nam, Won Ho ・ Hong, Eun Mi ・ Jang, Min Won ・ Choi, Jin Yong
Abstract
The impacts of climate change on upland crops is great significance for water resource planning, estimating crop water demand and irrigation scheduling.
The objective of this study is to predict upland crop evapotranspiration, effective rainfall and net irrigation requirement for upland under climate change, and changes in the temporal trends in South Korea. The changes in consumptive use and net irrigation requirement in the six upland crops, such as Soybeans, Maize, Potatoes, Red Peppers, Chinese Cabbage (spring and fall) were determined based on the soil moisture model using historical meteorological data and climate change data from the representative concentration pathway (RCP) scenarios. The results of this study showed that the average annual upland crop evapotranspiration and net irrigation requirement during the growing period for upland crops would increase persistently in the future, and were projected to increase more in RCP 8.5 than those in RCP 4.5 scenario, while effective rainfall decreased. This study is significant, as it provides baseline information on future plan of water resources management for upland crops related to climate variability and change.
Keywords:climate change; consumptive use; irrigation requirement; RCP scenarios; soil moisture; upland crops
* School of Natural Resources, University of Nebraska-Lincoln, Lincoln, NE, USA
** Research Institute for Agriculture & Life Sciences, Seoul National University, Seoul, Republic of Korea
*** Department of Agricultural Engineering and Institute of Agri- culture & Life Science, Gyeongsang National University, Jinju, Republic of Korea
****Department of Rural Systems Engineering and Research Institute for Agriculture & Life Sciences, Seoul National University, Seoul, Republic of Korea
† Corresponding author
Tel.: +82-2-880-4589 FAX: +82-2-873-2087 E-mail: [email protected]
Received: August 8, 2014 Revised: September 22, 2014 Accepted: September 22, 2014
Ⅰ. 서 론
기후변화는 지구온난화에 의한 기온의 상승, 극한 강수의 규모, 빈도 및 패턴의 변화를 초래하고, 수문순환, 유출량 등 수자원의 변화 및 농업 환경, 작물 생육, 생산량 변화에 직접 적인 영향을 준다 (Jung et al., 2009; Nam and Choi, 2014).
또한 기후변화에 따른 극한 강우사상의 증가와 증발산량의 증가로 인하여 토양수분 및 유출량의 잦은 변화가 예상 된다 (Hong et al., 2009). 기온의 상승은 작물의 증발산량을 증가 시켜 생산량의 증가 요인이 되기도 하지만, 한편으로는 생육
기간의 단축, 작물 호흡량의 증가 등으로 생산량 감소 요인이 되기도 한다 (Chung, 2010). 최근에는 기후변화에 따른 홍수, 가뭄, 이상 기후 등의 재해 위험 증가로 인하여 농업용수 부족 현상이 빈번하게 발생하고 있어 농업용수의 안정적 공급과 관리의 어려움을 겪고 있다 (Nam et al., 2014a; 2014b).
기상이변, 기후변화, 수질오염 등의 영향으로 사용가능한 수자원의 양은 점차 감소하고 있는 상황에서 전체 용수 사용 량의 48 %를 농업용수로 사용하고 있는 우리나라의 경우 농 업용수의 체계적인 관리와 이용은 농업생산 및 수자원 관리 측면에서 필수적 요소이다 (Eom et al., 2010). 미래 기후변화 에 따른 농업 수자원의 전망에 관한 연구는 미래 논벼의 증발 산량 산정에 관한 연구 (Hong et al., 2009; Chung, 2010) 및 농업용수 수요량 추정에 대한 연구 (Chung, 2009; 2012; Yun et al., 2011), 논벼의 생산량 변화에 관한 연구 (Nkomozepi and Chung, 2014) 등 주로 논벼를 대상으로 진행되었다. 밭 작물의 경우 논벼와 비교하여 작물의 종류가 다양하고 토양 내 물 소비기구가 복잡하여 (Kim et al., 1999; Suh and Lee, 2002), 미래 기후변화에 따른 토양별, 작물별, 생육시기별 용 수수요량 추정이 부재한 상황이다.
밭작물은 작물의 생육 시기와 기후 환경, 수자원 환경에 민 감하고 토양수분을 흡수함으로써 생육하기 때문에 농업과 식생의 주요한 수문인자인 토양수분의 변화는 작물 생산 및 가뭄의 지표가 된다 (Choi and Chung, 1995). 기상학적 가뭄
이 지속되면 토양수분의 결핍으로 인한 식생의 수분 스트레 스가 증가되기 때문에 농업적 가뭄평가를 위한 토양수분의 변화 기작을 활용한 모형들이 개발되었다 (Ma et al., 2013).
우리나라의 경우 국제식량농업기구 (Food and Agriculture Organization of the United Nations, FAO)에서 제안한 물수 지 모형 (water balance of the root zone)을 기반으로 Penman- Monteith 방법 및 작물계수를 활용하여 작물증발산량을 산정 하고, 밭 토양내의 수분을 추적하는 방식으로 유효우량 및 관 개수량을 산정함으로써 밭용수 수요량을 추정하는 방법이 개 발되었다 (Kim et al., 1999; Lee and Suh, 2001). 과거 밭관개 필요수량 산정에 관한 연구는 다양한 밭작물의 생육시기별 물 요구량 구명 및 관개기준 설정을 위한 관개량 산정에 관한 연구 (Kim et al., 1989; 1990; Chung et al., 1993; Choi and Chung, 1996; Eom et al., 2012a; Yun et al., 2009) 및 소규모 댐의 관개지역의 밭관개 필요수량 산정에 대한 연구 (Kim et al., 2005; Lee et al., 2006)가 진행되었다. 또한, 농업적 가뭄 평가를 위하여 토양수분모형을 적용한 연구로는 Bae et al.
(1999)은 우리나라 밭 지역의 가뭄을 분석하기 위하여 토양 수분 물수지 모형과 가뭄의 특성치를 분석할 수 있는 가뭄분 석모형을 결합하여 농업 가뭄을 평가하였으며, Kim et al.
(2006)과 Nam et al. (2008; 2012a; 2012b)은 토양수분 모형 과 Runs 이론을 이용하여 밭 지역 가뭄의 정량적인 평가를 수 행하였다.
본 연구에서는 미래 기후변화에 의한 밭작물 소비수량 및 관개용수량을 추정하기 위하여 밭 토양수분 물수지 모형을 구성하여, 우리나라 대표 밭작물 중 식량작물인 콩, 옥수수, 감자와 채소작물인 고추, 봄배추, 가을배추를 대상으로 적용 하였다. 과거 기상자료 및 미래 대표농도경로 시나리오와 작 물 기초자료를 수집하여 과거 및 미래 작물증발산량을 산정 하였으며, 토양수분 물수지 모형에 적용하여 밭작물의 토양 수분 변화를 모의하고 기후변화에 따른 작물별/생육시기별 소비수량 및 관개용수량을 추정하였다.
Ⅱ. 재료 및 방법
1. 토양수분 물수지 모형을 이용한 밭용수량 산정 가. 기준작물증발산량 산정
본 연구에는 FAO Penman-Monteith 공식 (FAO PM)을 이 용하여 기준작물증발산량을 산정하였다. Allen et al. (1998) 에 의해서 제안된 FAO PM 증발산량 공식 (식 (1))은 기준작물 의 증발산량을 산정하여 기준작물증발산량 (reference evapo- transpiration)으로 정의하였으며, 최근에는 다른 증발산 산정
식을 평가하는 표준으로 사용하도록 권고되고 있다 (Irmak et al., 2003).
(1)
는 기준작물증발산량 (), 는 증기압 곡선의 기울기 ℃, 은 지구 (작물)표면에서 순수하게 축적 되는 에너지 (순일사량) , 는 토양 열 유속 밀 도 , 는 건습계 상수 ℃, 는 평균기온 (℃), 는 2m 높이에서 풍속 , 는 포화증기압 (),
는 실제증기압 ()이다.
작물증발산량 (crop evapotranspiration)은 기준작물증발 산량에 작물의 작물계수 (crop coefficient)를 고려하여 식 (2) 와 같이 산정한다. Jensen et al. (1971)는 작물계수의 경우 표 면 토양의 습윤 상태에 따라 영향을 받기 때문에 토양수분함 량에 따른 계수를 식 (3)과 같이 제안하였다.
× (2)
×
ln ln
(3)
는 작물증발산량 (), 는 작물계수, 는 피 복에 따른 작물별 작물계수, 는 토양수분함량에 따른 계수,
는 강우 또는 관개 후에 지표면에서의 토양증발량을 보정 하는 계수이며, 는 유효수분백분율 (%)이다. 는 토양의 유효수분량을 고려한 계수로서 토양수분이 포장용수량 상태 면 는 1이 되며 위조점 상태일 경우 0이 된다 (Jensen et al., 1971). 본 연구에서는 는 제외하였다.
나. 유효우량 산정
강우량 중에서 작물의 생육에 이용되는 수량인 유효우량 (effective rainfall)은 밭용수에서 공급량을 결정짓는 주요한 인자이며, 시기별, 토양 특성에 따라 상이하다 (Suh and Lee, 2002). 본 연구에서는 토양의 유효수분함량을 고려한 일별 토 양수분추적법을 이용하여 유효우량을 산정하였다.
(1) 토양유효수분함량
유효수분량 또는 토양유효수분함량 (available water capa- city of the soil)은 토양의 수분 중에서 작물이 이용가능한 수
분으로 정의한다. 토양 내 유효수분의 상한계는 포장용수량 (field capacity), 하한계는 위조점 (wilting point)을 적용하여, 포장용수량과 위조점의 차이로부터 토양 내 유효수분함량을 산정한다.
(2) 토양수분소비형
작물은 토양의 유효수분함량이 50 % 이하로 감소하면 작 물의 생육과 생산량의 급격한 감소를 초래하며, 관개시기는 생장유효수분을 기준으로 결정한다 (Choi and Chung, 1995).
포장용수량에서 위조점까지의 토양수분함량을 전유효수분 량 (total available soil water)으로 정의하며, 유효수분의 토 양내 한계인 유효토층은 작물의 뿌리 깊이를 적용하여 식 (4) 와 같이 산정한다 (Allen et al., 1998).
max ×
min ×
×
(4)
max는 유효수분의 상한계 (mm), min는 유효수분의 하 한계 (mm), 는 근군역에서의 전유효수분량 (mm),
는 포장용수량시 수분함수량 (m3 m-3), 는 위조점시 수분 함수량 (m3 m-3), 는 작물의 뿌리깊이 (mm)이다.
유효토층 내의 수분감소량은 표층에서 하층으로 내려갈수 록 감소하기 때문에 FAO에서는 작물별로 뿌리깊이에 따른 토양수분감소율 (soil water depletion fraction for no stress) 을 제시하여 용이토양수분량 (readily available soil water)을 정의하였다 (식 (5)).
× (5)
는 근군역에서의 용이토양수분량 (mm), 는 토양 수분감소율이다. 토양수분감소율은 증발산량 5 mm/day를 기준으로 일별 작물증발산량에 따라 식 (6)과 같이 보정계수 를 활용한다.
× (6)
은 작물별 뿌리깊이에 따른 토양수분감소율 계수 (coefficient of soil water depletion fraction)이다. 작물별 뿌 리깊이에 따라 제시된 보정계수를 고려한 용이토양수분량을 토양의 수분한계로 선정하였다.
(3) 잠재유효우량
유효우량은 강우량 중에서 토양으로 침투되는 우량을 의 미하며, 지표배수량은 토양 속으로 침투한 우량을 제외하고 지표와 토양층을 통해 경지를 벗어나는 유출량을 의미한다.
본 연구에서는 토양수분형을 고려하지 않은 유효우량을 잠재 유효우량이라 정의하였다. 잠재유효우량 및 지표유출량을 산정하기 위하여 미국자연자원보호청 (Natural Resources Conservation Service, NRCS) CN (Curve Number) 방법을 이용하였으며, 지표유출량을 계산하는 방법은 식 (7)과 같다.
일 강우량 5 mm를 최대 무효우량으로 선정하였다.
≥
(7)
는 지표유출량 (mm)이며, 는 총강우량 (mm), 는 최 대잠재보유수량 (mm)으로 토지피복도와 수문학적 토양군에 따라 결정되는 상수이며, 는 유출곡선지수이다.
(4) 지하배수량
지하배수량은 유효토층 하부에서 토양수분 중 중력수가 아래로 이동되는 양을 의미하며, 강우시 토양수분함량이 포 장용수량을 초과할 경우 포장용수량 이상의 토양수분은 모두 지하배수 되는 것으로 간주하였다.
다. 밭 토양수분 물수지
밭작물의 필요수량은 증발산량과 유효우량을 고려하고, 침투량은 밭의 유효수분이 포장용수량 범위 내에서 산정되므 로 고려하지 않는다 (Suh and Lee, 2002). 밭용수 수요량을 산 정하기 위한 물수지 모형은 토양내의 토양수분함량을 추정할 수 있는 토양수분 물수지 모형을 활용하였으며, 식 (8)과 같이 표현할 수 있다.
(8)
는 토양 내에서의 토양수분 변화량 (root zone depletion or soil water content in the root zone) (mm), 는 강수량 (mm), 은 지표유출량 (mm), 은 관개량 (mm), 는 모관력에 의한 수분상승량 (mm), 는 작물증발산량 (mm),
는 유효토층 하부에서의 지하배수량 (mm)이다. 식 (8)에 서 모세관력에 의한 수분상승량을 무시하고, 강수량, 지표유 출량, 지하배수량을 유효우량으로 표현하면, 식 (9)와 같다.
Table 1 Crop coefficient according to growth period
Crops G1 G2 G3 G4 G5 References
Cereals
Soybeans M Jun.~L Jun. E Jul.~L Jul. E Aug~L Aug. E Sep.~L Sep. E Oct.~L Oct. Han, 2012
0.4 1.15 1.15 1.15 0.5 Allen et al., 1998
Maize L Apr.~M May L May~M Jun. L Jun.~E Jul. M Jul.~L Jul. E Aug.~M Aug.
Eom et al., 2013
0.68 1.09 1.68 1.33 1.03
Potatoes E Apr.~M Apr. L Apr.~E May M May~L May E Jun.~M Jun. -
Eom et al., 2012b
0.50 0.77 1.11 0.95 -
Vegetables
Red Peppers M May~L May E Jun.~L Jun. E Jul.~L Jul. E Aug.~L Aug. E Sep.~M Sep. Eom and Park,
0.53 0.96 1.06 1.06 0.82 2012
Chinese Cabbage (spring)
E May~M May L May~E Jun. M Jun.~L Jun. E Jul. -
Eom et al., 2010
0.81 1.11 1.11 1.22 -
Chinese Cabbage (fall)
E Sep.~M Sep. L Sep.~E Oct. M Oct.~L Oct. E Nov. -
Jung et al., 2011
0.62 0.94 1.25 1.16 -
※ 1) E: early, 2) M: mid, 3) L: late
※ Growth period: G1=growth period-1, G2=growth period-2, G3=growth period-3, G4=growth period-4, G5=growth period-5
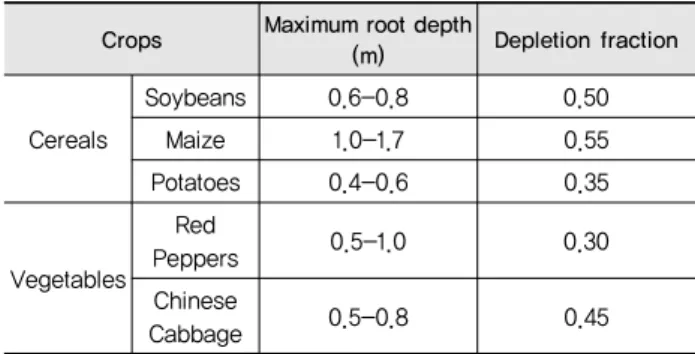
Table 2 Ranges of maximum effective rooting depth and soil water depletion fraction for no stress (Allen et al., 1998)
Crops Maximum root depth
(m) Depletion fraction
Cereals
Soybeans 0.6-0.8 0.50
Maize 1.0-1.7 0.55
Potatoes 0.4-0.6 0.35
Vegetables Red
Peppers 0.5-1.0 0.30
Chinese
Cabbage 0.5-0.8 0.45
(9)
는 일의 토양수분함량 (mm), 는 일의 토양수 분함량 (mm), 는 일의 유효우량 (mm), 는 일의 소 비수량 (mm)이다. 밭작물의 소비수량은 작물증발산량 () 으로 산정한다.
밭작물의 유효우량 및 관개수량은 강우량과 필요수량 및 토양수분함량의 관계로부터 산정할 수 있으며, 토양내 유효 수분의 상한계 및 하한계인 max, min에 의해 식 (10), (11) 과 같이 제한된다. 토양수분량이 생장저해수분 이하로 감소 할 경우 토양수분 부족함량의 생육기간 내 누계 값 (accumul- ated)을 순관개용수량 (net irrigation requirement)으로 정의 하였으며, 식 (12)를 이용해서 산정한다.
max
≤max
(10)
min≤
min≻
min
(11)
∙ (12)
는 일의 잠재유효우량 (mm), 는 순관개용수량 ()이다.
2. 대상 밭작물 및 토양 특성
본 연구에서는 대상 밭작물로 식량작물인 콩, 옥수수, 감자 와 채소작물인 고추, 봄배추, 가을배추를 선정하였으며, 작물 의 생육기간을 G-1 단계 (생육초기), G-2 단계 (신장기), G-3 단계 (생육중기), G-4 단계 (생육후기), G-5 단계 (생육말기) 로 구분하였다. 대상 작물의 생육기간 및 작물계수는 Table 1 과 같다. Table 2는 밭작물의 최대뿌리깊이 및 토양수분 감소 율을 나타낸 것이며 (Allen et al., 1998), 토양별 포장용수량 과 위조점은 Table 3에 도시한 바와 같이 농촌진흥청 국립농 업과학원 (National Academy of Agricultural Science)에서 전국의 125개 밭 토양통을 대상으로 조사한 자료를 활용하였 다 (Han, 2012).
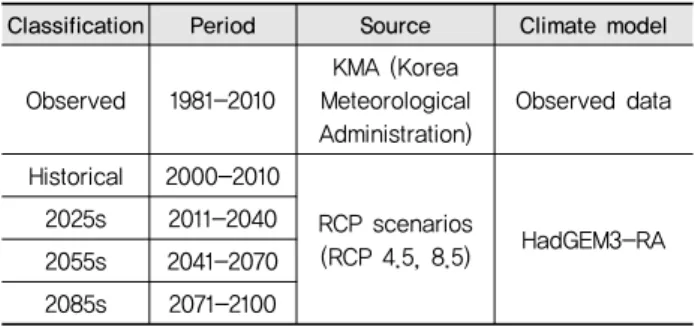
Table 4 Classification of climate change data
Classification Period Source Climate model
Observed 1981-2010
KMA (Korea Meteorological Administration)
Observed data
Historical 2000-2010
RCP scenarios
(RCP 4.5, 8.5) HadGEM3-RA 2025s 2011-2040
2055s 2041-2070 2085s 2071-2100 Table 3 Available water capacity according to soil texture (Han, 2012)
Soil texture
Sandy loam (SL)
Loam (L)
Silt loam (SiL)
Clay loam (CL)
Silt clay loam (SiCL)
FC1) 22.3 29.4 35.1 33.0 37.8
WP2) 6.3 8.7 10.4 12.8 15.7
AWC3) 16.0 20.7 24.7 20.2 22.1
※ 1) FC: field capacity, 2) WP: wilting point, 3) AWC: available water capacity of the soil
※ Units: percentage of a soil volume (v/v, %)
3. 미래 기후변화 시나리오
기상청 (Korea Meteorological Administration, KMA)에 서는 전지구 및 지역기후모델을 이용하여 대표경로농도 (Re- presentative Concentration Pathways, RCP)기반의 기후변화 시나리오를 생산, 제공하고 있다. 현재 기상청에서 제공하고 있는 지역기후모델의 해상도는 한반도 (12.5 km), 남한 상세 (1 km)의 두 가지 종류의 기후변화 시나리오를 제공하고 있다.
남한 상세 기후변화 시나리오는 지역기후모델 (HadGEM3- RA)을 통해 생산된 한반도 기후변화 시나리오를 바탕으로 통계학적 상세화 과정 (Kim et al., 2012)을 통해 생산되며, PRIDE 모델 (PRISM based Downscaling Estimation Model) 에 적용하여 1 km 해상도의 관측격자 자료를 생산한다 (Kim et al., 2013). 본 연구에서는 남한 상세 시나리오의 기온, 강수 량과 한반도 시나리오의 상대습도, 평균풍속, 일사량 자료를 사용하였다. Table 4와 같이 기후변화 시나리오의 분석기간 을 과거 기준기간 (observed, 1981~2010년) 및 미래의 경우 단기 (2025s, 2011~2030년), 중기 (2055s, 2031~2070년), 장 기 (2085s, 2071~2100년)로 분류하였다.
Ⅲ. 적용 및 고찰
1. 토양수분 물수지 모형의 적합성 검증
기상청에서 제공하는 일 자료 기반의 통계학적 상세화 과 정을 통해 생성된 기후 정보를 과거 관측 기후자료와 비교하 여 토양수분 물수지 모형 기작의 재현성 여부를 판단하였다.
과거기간의 RCP 시나리오자료 (historical)를 사용한 분석결 과 (작물증발산량, 유효우량, 관개용수량)가 동일 기간의 관 측자료 (observed)를 사용한 결과와 비교하여 상이한 패턴을 갖는다면 과거기간을 기준으로 제공되는 미래전망기간의 상 대적인 증감 결과를 신뢰할 수 없으며, 제공된 정보를 활용한 의사결정 역시 제한적일 수 있다 (Cho, 2013). 따라서 전라북
도 전주 기상관측소를 대상으로 고추 작물의 분석결과를 바 탕으로 사용된 기후변화 시나리오자료의 밭용수량 산정을 위 한 적합성 여부를 평가하였다. 적합성 판단에 사용된 과거기 간의 관측자료 및 시나리오자료는 2000년부터 2010년까지 11년간의 기상자료를 사용하였다.
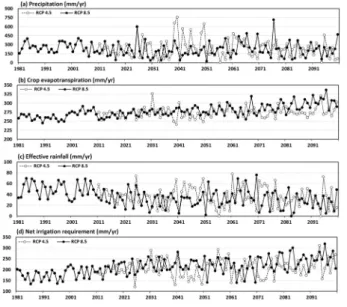
고추의 생육기간 내 강수량 및 FAO PM 증발산량 공식 및 작물계수를 활용한 작물증발산량, 토양수분 물수지 모형을 이용한 유효우량, 관개용수량 결과를 연 누적하여 분석한 결 과는 Fig. 1과 같다. 동일기간에 대한 관측 기후정보와 모형에 의한 기후정보를 활용한 경우 고추작물의 증발산량의 변화를 살펴보면 분석기간 내 연평균 작물증발산량은 관측과 시나리 오의 경우 각각 494 mm와 474 mm로 1.04 %의 차이를 보였 으며, 1:1 산점도 그래프 (scatter plot)에서는 기울기가 0.73, R2은 0.7969 값을 나타냈다. 유효우량의 경우 각각 138 mm 와 136 mm로 1.01 %의 차이를 보였으며, 기울기가 1.02, R2 은 0.9927 값을 나타냈다. 관개용수량의 경우 각각 245 mm 와 228 mm로 1.07 %의 차이를 보였으며, 기울기가 0.91, R2 은 0.9905 값을 나타냈다. 따라서 미래 시나리오자료는 FAO PM 증발산량 공식 및 토양수분 물수지 모형을 이용한 밭용수 량 분석에 적합한 것으로 판단하였으며, 본 연구에서 도출된 미래기간의 작물증발산량, 유효우량, 관개용수량의 변화 결 과를 신뢰할 수 있을 것으로 판단된다.
2. 작물별 소비수량, 유효우량 및 관개용수량의 변화 미래기후변화 시나리오에 따른 전주 기상관측소를 대상으 로 6개 밭작물의 생육기간 내 강우량 및 작물증발산량, 유효 우량, 관개용수량의 변화는 Fig. 2~Fig. 7, Table 5, Table 6과 같다. 콩의 경우 기준년도의 평균 작물증발산량은 449 mm이 었으며, 미래기간의 2025s, 2055s, 2085s의 예측 값은 RCP 4.5에서 475 mm (5.7 % 증가), 470 mm (4.7 % 증가), 486 mm (8.3 % 증가), RCP 8.5에서는 469 mm (4.4 % 증가), 502 mm (11.9 % 증가), 520 mm (15.7 % 증가)이었다. 작물증발산량 은 RCP 4.5 보다 RCP 8.5에서 증가률이 더 크고 미래 후기로
Fig. 1 Comparison of scatter plots of simulated 11-year average annual precipitation, crop evapotranspiration, effective rainfall, and net irrigation requirement using observed weather data and RCPs historical data (crop: Red Peppers, meteorological station: Jeonju, growing period: Mid May~Mid Sep.)
Fig. 2 Comparison of simulated annual precipitation, crop evapotrans- piration, effective rainfall, and net irrigation requirement using observed weather data and RCPs climate change data (crop:
Soybeans, meteorological station: Jeonju, growing period:
Mid Jun.~Late Oct.)
Fig. 3 Comparison of simulated annual precipitation, crop evapotrans- piration, effective rainfall, and net irrigation requirement using observed weather data and RCPs climate change data (crop:
Maize, meteorological station: Jeonju, growing period: Late Apr.~Mid Aug.)
Fig. 4 Comparison of simulated annual precipitation, crop evapotrans- piration, effective rainfall, and net irrigation requirement using observed weather data and RCPs climate change data (crop:
Potatoes, meteorological station: Jeonju, growing period: Early Apr.~Mid Jun.)
Fig. 5 Comparison of simulated annual precipitation, crop evapotrans- piration, effective rainfall, and net irrigation requirement using observed weather data and RCPs climate change data (crop:
Red Peppers, meteorological station: Jeonju, growing period:
Mid May~Mid Sep.)
Fig. 6 Comparison of simulated annual precipitation, crop evapotrans- piration, effective rainfall, and net irrigation requirement using observed weather data and RCPs climate change data (crop:
Chinese Cabbage (spring), meteorological station: Jeonju, gro- wing period: Early May~Early Jul.)
Fig. 7 Comparison of simulated annual precipitation, crop evapotrans- piration, effective rainfall, and net irrigation requirement using observed weather data and RCPs climate change data (crop:
Chinese Cabbage (fall), meteorological station: Jeonju, growing period: Early Sep.~Early Nov.)
갈수록 증가할 것으로 예측되었으며, 이 결과는 미래 논벼의 증발산량 예측 값과 유사한 경향을 보여주고 있다 (Chung, 2009; Hong et al., 2009; Yun et al., 2011). 하지만 유효우량 의 경우 기준년도는 평균 133 mm이었으며, 미래기간의 2025s,
2055s, 2085s의 예측 값은 RCP 4.5에서 84 mm (36.6 % 감 소), 86 mm (35.5 % 감소), 81 mm (39.2 % 감소), RCP 8.5에 서는 86 mm (35.8 % 감소), 83 mm (37.4 % 감소), 87 mm (34.8 % 감소)이었다. 이 결과는 작물증발산량은 증가하였지
Table 5 Results of precipitation, crop evapotranspiration, effective rainfall, and net irrigation requirement for six upland crops under RCP 4.5 scenario at Jeonju meteorological station
Crops
Cereals Vegetables
Soybeans Maize Potatoes Red Peppers Chinese Cabbage
(spring)
Chinese Cabbage (fall)
Observed
P1) 894 (244) 760 (220) 260 (82) 906 (255) 362 (148) 208 (122)
ETc2) 449 (21) 556 (23) 266 (11) 480 (20) 306 (13) 149 (11)
ER3) 133 (30) 192 (37) 49 (14) 134 (28) 62 (19) 36 (14)
NIR4) 209 (59) 236 (68) 179 (26) 239 (55) 193 (36) 89 (26)
2025s
P 804 (240) 696 (290) 245 (181) 825 (298) 345 (221) 174 (94)
ETc 475 (35) 570 (37) 271 (16) 499 (34) 313 (18) 167 (10)
ER 84 (23) 129 (37) 36 (15) 87 (22) 44 (17) 26 (14)
NIR 231 (66) 285 (87) 205 (36) 254 (61) 219 (39) 111 (24)
2055s
P 1,000 (235) 867 (297) 259 (173) 1,022 (271) 471 (232) 187 (74)
ETc 470 (27) 563 (32) 274 (14) 493 (26) 307 (18) 168 (7)
ER 86 (13) 136 (34) 36 (20) 94 (16) 48 (17) 23 (14)
NIR 214 (41) 262 (70) 207 (43) 231 (46) 203 (44) 117 (20)
2085s
P 900 (310) 793 (312) 224 (112) 935 (308) 397 (204) 196 (94)
ETc 486 (37) 579 (39) 277 (14) 508 (35) 315 (19) 173 (12)
ER 81 (20) 132 (38) 35 (19) 89 (22) 46 (18) 22 (11)
NIR 234 (58) 285 (85) 211 (41) 250 (62) 216 (47) 123 (23)
※ 1) P: precipitation, 2) ETc: crop evapotranspiration, 3) ER: effective rainfall, 4) NIR: net irrigation requirement
※ Units: (mm), standard deviation in parentheses
Table 6 Results of precipitation, crop evapotranspiration, effective rainfall, and net irrigation requirement for six upland crops under RCP 8.5 scenario at Jeonju meteorological station
Crops
Cereals Vegetables
Soybeans Maize Potatoes Red Peppers Chinese Cabbage
(spring)
Chinese Cabbage (fall)
Observed
P1) 894 (244) 760 (220) 260 (82) 906 (255) 362 (148) 208 (122)
ETc2) 449 (21) 556 (23) 266 (11) 480 (20) 306 (13) 149 (11)
ER3) 133 (30) 192 (37) 49 (14) 134 (28) 62 (19) 36 (14)
NIR4) 209 (59) 236 (68) 179 (26) 239 (55) 193 (36) 89 (26)
2025s
P 895 (288) 749 (274) 200 (125) 893 (285) 351 (249) 185 (107)
ETc 469 (29) 560 (27) 270 (9) 492 (26) 309 (13) 168 (12)
ER 86 (19) 126 (33) 32 (14) 84 (21) 40 (19) 28 (15)
NIR 208 (50) 279 (69) 212 (28) 241 (50) 228 (42) 115 (30)
2055s
P 843 (231) 708 (241) 227 (119) 829 (235) 303 (177) 171 (80)
ETc 502 (30) 594 (30) 279 (14) 523 (26) 323 (18) 179 (10)
ER 83 (20) 127 (41) 35 (18) 79 (23) 41 (21) 27 (11)
NIR 234 (53) 307 (85) 214 (38) 268 (55) 240 (47) 122 (23)
2085s
P 986 (298) 790 (307) 220 (139) 942 (317) 339 (158) 214 (96)
ETc 520 (32) 620 (37) 296 (16) 544 (31) 339 (19) 183 (10)
ER 87 (16) 117 (30) 26 (15) 83 (13) 37 (16) 28 (13)
NIR 233 (48) 329 (73) 244 (36) 273 (47) 254 (41) 125 (27)
※ 1) P: precipitation, 2) ETc: crop evapotranspiration, 3) ER: effective rainfall, 4) NIR: net irrigation requirement
※ Units: (mm), standard deviation in parentheses
만 강우량의 패턴이 변화하여 토양으로 침투되지 않고 지표 배수량으로 유출되는 양이 증가하였기 때문이다. 관개용수 량의 경우 기준년도는 평균 209 mm이었으며, 미래기간의 2025s, 2055s, 2085s의 예측 값은 RCP 4.5에서 231 mm (10.2 % 증가), 214 mm (2.4 % 증가), 234 mm (11.6 % 증가), RCP 8.5에서는 218 mm (4.3 % 증가), 234 mm (11.9 % 증 가), 233 mm (11.2 % 증가)이었다. 유효우량의 감소로 인하 여 관개용수량의 경우 증가였다. 옥수수, 감자, 고추, 봄배추, 가을배추의 경우에도 유사한 결과가 도출되었다.
작물별로 기준기간 대비 전 미래기간의 평균 변화율 비교 결과는 RCP 4.5의 작물증발산량의 경우 봄배추 (2.0 % 증가), 옥수수, 감자, 고추, 콩, 가을배추 (14.0 % 증가) 순이었으며, 유효우량의 경우 봄배추 (25.9 % 감소), 감자, 옥수수, 고추, 가을배추, 콩 (37.0 % 감소), 관개용수량의 경우 고추 (2.5 % 증가), 콩, 봄배추, 감자, 옥수수, 가을배추 (32.1 % 증가)이었 다. RCP 8.5의 작물증발산량의 경우 봄배추 (5.9 % 증가), 감 자, 옥수수, 고추, 콩, 가을배추 (18.6 % 증가), 유효우량의 경 우 가을배추 (22.3 % 감소), 옥수수, 콩, 봄배추, 감자, 고추 (39.0 % 감소), 관개용수량의 경우 고추 (9.1 % 증가), 콩, 봄 배추, 감자, 옥수수, 가을배추 (36.5 % 증가)순이었다. 미래 기후변화에 대한 밭작물의 영향은 작물증발산량, 유효우량, 관개용수량 등 요소별로 상이하며, 기후변화의 영향은 봄배 추가 가장 적었으며, 가을배추가 가장 큰 것으로 나타났다.
Ⅳ. 결론
본 연구에서는 토양수분 물수지 모형을 적용하여 미래 기 후변화에 의한 밭작물 소비수량 및 관개용수량을 산정하였 다. 우리나라의 대표 밭작물 중 식량작물인 콩, 옥수수, 감자 와 채소작물인 고추, 봄배추, 가을배추를 대상으로 전주 기상 관측소의 과거 기상자료 및 미래 대표농도경로 시나리오, 작 물 자료를 수집하여 과거 및 미래 작물증발산량을 산정하고 토양수분 물수지 모형을 적용하여 유효우량 및 관개용수량을 산정하였으며, 미래 시나리오별, 작물별로 비교분석하였다.
토양수분 물수지 모형 기작의 적합성을 검증하기 위하여 2000년부터 2010년까지 11년간의 과거기간 관측자료 및 미 래 기후변화 시나리오 자료를 사용하였으며, 작물증발산량, 유효우량, 관개용수량의 산점도 분석결과, R2은 각각 0.7969, 0.9927, 0.9905 값이 도출되어 미래 기후변화 시나리오 자료 는 토양수분 물수지 모형을 이용한 밭용수량 분석에 적합한 것으로 나타났다. 주요 밭작물의 미래기후변화 시나리오에 따른 작물증발산량 및 유효우량, 관개용수량의 변화 결과는 작물증발산량은 증가, 유효우량은 감소, 관개용수량은 증가
하였으며, RCP 4.5 보다 RCP 8.5에서 증가률이 더 크고 미래 후기로 갈수록 증가할 것으로 예측되었다. 작물별로 기준기 간 대비 전 미래기간의 평균 변화율 비교 결과, 기후변화의 영 향은 봄배추가 가장 적었으며, 가을배추가 가장 큰 것으로 나 타났다. 본 연구 결과는 향후 시기별 작물별 기후변화에 따른 토양수분 관리 방안, 밭관개 가이드라인 제시 및 금후 국가 물 수급계획 수립의 기초자료로 활용될 수 있을 것으로 판단된다.
사 사
이 논문은 2013년도 정부 (교육부)의 재원으로 한국연구 재단의 지원을 받아 수행된 기초연구사업임 (2013R1A6A3 A03019009).
REFERENCES
1. Allen, R.G., L.S. Pereira, D. Raes, and M. Smith, 1998. Crop evapotranspiration: guidelines for computing crop water require- ments. Irrigation and Drainage Paper 56. United Nations Food and Agriculture Organization, Rome, Italy.
2. Bae, S.J., H.W. Chung, and J.Y. Choi, 1999. Agricultural drought analysis using soil water balance model and geographic information system. Magazine of the Korean Society of Agricultural Engineers 41(6): 33-43 (in Korean).
3. Cho, J.P., 2013. Impact assessment of climate change for agricultural reservoirs considering uncertainty. Research Report, APEC climate Center, Busan, Republic of Korea (in Korean).
4. Choi, J.Y., and H.W. Chung, 1995. Applicability analysis of soil moisture simulation model SWATRER. Magazine of the Korean Society of Agricultural Engineers 37(6): 82-91 (in Korean).
5. Choi, J.Y., and H.W. Chung, 1996. Irrigation scheduling with soil moisture simulation model. Magazine of the Korean Society of Agricultural Engineers 38(1): 98-106 (in Korean).
6. Chung, H.W., S.H. Park, S.J. Kim, and Y.S. Chung, 1993. A study on root growth and soil moisture extraction pattern during growing period of upland crops –soybean, red pepperm, sesame-. Magazine of the Korean Society of Agricultural Engineers 35(1): 67-75 (in Korean).
7. Chung, S.O., 2009. Prediction of paddy irrigation demand in Nakdong river basin using regional climate model outputs.
Journal of the Korean Society of Agricultural Engineers 51(4):
7-13 (in Korean).
8. Chung, S.O., 2010. Simulating evapotranspiration and yield
response of rice to climate change using FAO-AquaCrop.
Journal of the Korean Society of Agricultural Engineers 52(3):
57-64 (in Korean).
9. Chung, S.O., 2012. Projection of paddy rice consumptive use in the major plains of the Korean Peninsula under the RCP scenarios. Journal of the Korean Society of Agricultural Engineers 54(5): 35-41 (in Korean).
10. Eom, K.C., P.K. Jung, M.H. Koh, S.H. Kim, S.Y. Yoo, S.H.
Park, S.O. Hur, and S.K. Ha, 2010. Water saving irrigation manual of spring chinese cabbage. Korean Journal of Soil Science and Fertilizer 43(6): 812-822 (in Korean).
11. Eom, K.C., and S.H. Park, 2012. Water saving irrigation manual of house red pepper for the northern region of Korea.
Korean Journal of Soil Science and Fertilizer 45(2): 312-316 (in Korean).
12. Eom, K.C., S.H. Park, and S.Y. Yoo, 2012a. Assessment of the amount of irrigation water for red pepper by water saving irrigation manual. Korean Journal of Soil Science and Fertilizer 45(2): 301-305 (in Korean).
13. Eom, K.C., S.H. Park, and S.Y. Yoo, 2012b. Water requirement of potato according growth stage. Korean Journal of Soil Science and Fertilizer 45(6): 861-866 (in Korean).
14. Eom, K.C., S.H. Park, and S.Y. Yoo, 2013. Water requirement of maize according growth stage. Korean Journal of Soil Science and Fertilizer 46(1): 16-22 (in Korean).
15. Han, K.H., 2012. Development of water management techniques for water saving. National Academy of Agricultural Science, Rural Development Administration (RDA).
16. Hong, E.M., J.Y. Choi, S.H. Lee, S.H. Yoo, and M.S. Kang, 2009. Estimation of paddy rice evapotranspiration considering climate change using LARS-WG. Journal of the Korean Society of Agricultural Engineers 51(3): 25-35 (in Korean).
17. Irmak, S., R.G. Allen, and E.B. Whitty, 2003. Daily grass and alfalfa-reference evapotranspiration estimates and alfalfa-to- grass evapotranspiration ratios in Florida. Journal of Irrigation and Drainage Engineering 129(5): 360-370.
18. Jensen, M.E., J.L. Wright, and B.J. Pratt, 1971. Estimation soil moisture depletion from climate, crop and soil data. Transactions of the ASAE 14(5): 954-959.
19. Jung, N.S., D.H. Jang, and S.H. Lee, 2009. Research on an upland indicator plant for vulnerability assessment of climate change. Journal of the Association of Korean Photo-Geographers 19(4): 81-93 (in Korean).
20. Jung, P.K., K.C. Eom, Y.K. Son, M.H. Koh, S.H. Kim, S.H.
Park, and S.Y. Yoo, 2011. Water saving irrigation manual of autumn chinese cabbage. Korean Journal of Soil Science and Fertilizer 44(5): 679-687 (in Korean).
21. Kim, C.K., J.H. Kim, H.W. Chung, H.K. Choi, and Y.H.
Kwun, 1989. Basic studies on the consumptive use of water required for dry field crops (2) -garlic and cucumber-.
Magazine of the Korean Society of Agricultural Engineers 31(3): 41-56 (in Korean).
22. Kim, C.K., J.H. Kim, H.W. Chung, H.K. Choi, and Y.H.
Kwun, 1990. Basic studies on the consumptive use of water required for dry field crops (3) -red pepper and radish-.
Magazine of the Korean Society of Agricultural Engineers 32(1): 55-71 (in Korean).
23. Kim, H.Y., Y.J. Suh, M.S. Sim, and K.Y. Lee, 1999. Determin- ation of a new method for the upland water requirements.
Proceedings of the Korean Society of Agricultural Engineers Conference: 41-46 (in Korean).
24. Kim, M.K., M.S. Han, D.H. Jang, S.G. Baek, W.S. Lee, Y.H.
Kim, and S. Kim, 2012. Production technique of observation grid data of 1km resolution. Journal of Climate Research 7(1):
55-68 (in Korean).
25. Kim, M.K., D.H. Lee, and J. Kim, 2013. Production and validation of daily grid data with 1km resolution in South Korea. Journal of Climate Research 8(1): 13-25 (in Korean).
26. Kim, O.K., J.Y. Choi, M.W. Jang, S.H. Yoo, W.H. Nam, J.H.
Lee, and J.K. Noh, 2006. Watershed scale drought assessment using soil moisture index. Journal of the Korean Society of Agricultural Engineers 48(6): 3-13 (in Korean).
27. Kim, S.J., J.Y. Lee, and P.S. Kim, 2005. Securement of upland irrigation water in small dams through periodical management of storage level. Journal of the Korean Society of Agricultural Engineers 47(2): 3-12 (in Korean).
28. Lee, J.Y., S.J. Kim, and P.S. Kim, 2006. Security of upland irrigation water through the effective storage management of irrigation dams. Journal of the Korean Society of Agricultural Engineers 48(2): 13-23 (in Korean).
29. Lee, K.Y., and Y.J. Suh, 2001. Development of the estimation system for agricultural water demand. Magazine of the Korean Society of Agricultural Engineers 43(1): 53-57 (in Korean).
30. Ma, Y., S. Feng, and X. Song, 2013. A root zone model for estimating soil water balance and crop yield responses to deficit irrigation in the North China Plain. Agricultural Water Management 127: 13-24.
31. Nam, W.H., S.H. Yoo, J.Y. Choi, and M.W. Jang, 2008.
Analysis of autumn drought using soil moisture index. Journal of Korea National Committee on Irrigation and Drainage 15(1): 19-27 (in Korean).
32. Nam, W.H., J.Y. Choi, S.H. Yoo, and B.A. Engel, 2012a. A real-time online drought broadcast system for monitoring soil moisture index. KSCE Journal of Civil Engineering 16(3):
357-365.
33. Nam, W.H., J.Y. Choi, S.H. Yoo, and M.W. Jang, 2012b. A
decision support system for agricultural drought management using risk assessment. Paddy Water Environment 10(3):
197-207.
34. Nam, W.H., and J.Y. Choi, 2014. Development of an irrigation vulnerability assessment model in agricultural reservoirs utilizing probability theory and reliability analysis. Agricultural Water Management 142: 115-126.
35. Nam, W.H., E.M. Hong, and J.Y. Choi, 2014a. Uncertainty of water supply in agricultural reservoirs considering the climate change. Journal of the Korean Society of Agricultural Engineers 56(2): 11-23 (in Korean).
36. Nam, W.H., E.M. Hong, T.G. Kim, and J.Y. Choi, 2014b.
Projection of future water supply sustainability in agricultural reservoirs under RCP climate change scenarios. Journal of the Korean Society of Agricultural Engineers 56(4): 59-68 (in
Korean).
37. Nkomozepi, T., and S.O. Chung, 2014. Modeling future yield and irrigation demand of rice paddy in Korea. Journal of the Korean Society of Agricultural Engineers 56(1): 31-40.
38. Suh, Y.J., and K.Y. Lee, 2002. Method of calculation in upland irrigation. Magazine of the Korean Society of Agricultural Engineers 44(1): 25-34 (in Korean).
39. Yun, D.K., S.O. Chung, and S.J. Kim, 2011. Climate change impacts on paddy water requirement. Journal of the Korean Society of Agricultural Engineers 53(4): 39-47 (in Korean).
40. Yun, S.K., S.O. Hur, S.H. Kim, S.J. Park, J.B. Kim, and I.M.
Choi, 2009. Prediction of evapotranspiration from grape vines in Suwon with the FAO Penman-Monteith equation. Korean Journal of Agricultural and Forest Meteorology 11(3): 111- 117 (in Korean).