Copyright © 2020 Korean Stroke Society
This is an Open Access article distributed under the terms of the Creative Commons Attribution Non-Commercial License (http://creativecommons.org/licenses/by-nc/4.0/) which permits unrestricted non-commercial use, distribution, and reproduction in any medium, provided the original work is properly cited.
Letter to the Editor
Dear Sir:
The accurate prediction of functional recovery after a stroke is essential for post-discharge treatment planning and resource utilization. Recently, machine learning (ML) algorithms with baseline clinical variables have demonstrated better perfor- mance for predicting the functional outcome of ischemic stroke compared with preexisting scoring systems developed by conventional statistics.
1,2However, most studies compared model performance by area under curve (AUC) only, and ML and conventional statistical approaches were not sufficiently evaluated in terms of the reliability and clinical utility.
3We aimed to compare the performance of the ML with that of the conventional logistic regression (LR) model by evaluating accu- racy, reliability, and clinical utility using AUC comparison, cali- bration, and decision curve analysis to predict the outcome of
a stroke using KOrean Stroke Neuroimaging Initiative (KOSNI) database.
Using clinical variables measurable at admission (Supple- mentary methods 1), we used various ML algorithms including deep learning (DL), support vector machine (SVM), random for- est (RF), XGboost (XGB), and conventional LR models for pre- dicting 3-month modified Rankin Scale (mRS) >2 or 1 (Supple- mentary methods 2). Receiver operating characteristic (ROC) curve analysis was performed to evaluate the sensitivity and specificity of each model across each decision threshold. Cali- bration was evaluated using a reliability diagram and expected calibration error (ECE) to assess the reliability of estimates be- tween the predicted and actual outcomes.
4The decision curve analysis was constructed to assess the clinical utility of various developed models (Supplementary methods 3).
5Six thousand seven hundred thirty-one patients included
Reliability and Clinical Utility of Machine Learning to Predict Stroke Prognosis: Comparison with Logistic Regression
Su-Kyeong Jang,
a,* Jun Young Chang,
a,* Ji Sung Lee,
b,cEun-Jae Lee,
aYong-Hwan Kim,
dJung Hoon Han,
aDae-Il Chang,
eHan Jin Cho,
fJae-Kwan Cha,
gKyung Ho Yu,
hJin-Man Jung,
iSeong Hwan Ahn,
jDong-Eog Kim,
kSung-Il Sohn,
lJu Hun Lee,
mKyung-Pil Park,
nSun U. Kwon,
aJong S. Kim,
aDong-Wha Kang,
aKOSNI Investigators
a
Department of Neurology, Asan Medical Center, Seoul, Korea
b
Clinical Research Center, Asan Medical Center, Seoul, Korea
c
Department of Clinical Epidemiology and Biostatistics, Asan Medical Center, Seoul, Korea
d
Asan Institute for Life Sciences, Asan Medical Center, Seoul, Korea
e
Department of Neurology, Kyung Hee University Medical Center, Seoul, Korea
f
Department of Neurology, Pusan National University Hospital, Busan, Korea
g
Department of Neurology, Dong-A University Hospital, Busan, Korea
h
Department of Neurology, Hallym University Sacred Heart Hospital, Anyang, Korea
i
Department of Neurology, Korea University Ansan Hospital, Ansan, Korea
j
Department of Neurology, Chosun University Hospital, Gwangju, Korea
k
Department of Neurology, Dongguk University Ilsan Hospital, Goyang, Korea
l
Department of Neurology, Keimyung University Medical Center, Daegu, Korea
m
Department of Neurology, Hallym University Kangdong Sacred Heart Hospital, Seoul, Korea
n
Department of Neurology, Pusan National University Yangsan Hospital, Yangsan, Korea
*These authors contributed equally to the manuscript as first author.
from 10 tertiary stroke centers in South Korea. This study was approved by the Institutional Review Boards of all participating institutions and comprehensive written informed consent was obtained from patients enrolled in the prospective study. Four thousand seven hundred nine (70%) of the datasets from the former part in the order of admission date were used for train- ing, whereas the remaining 2,019 (30%) from the latter were used as a test set for evaluating the final performance. The baseline characteristics stratified by the outcomes were sum- marized in Supplementary Table 1.
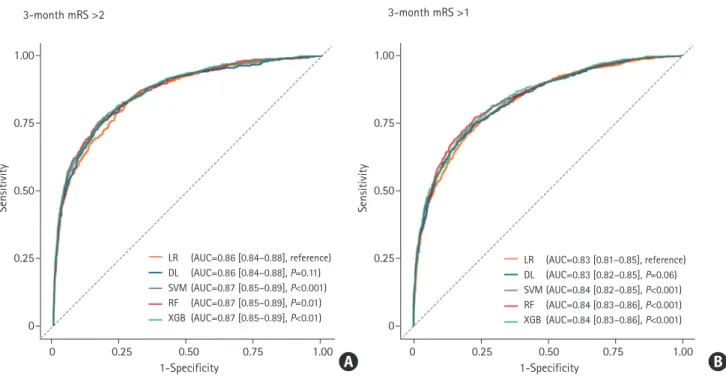
When the predictive ability was compared with the LR model (AUC of the ROC curve: 0.860 for predicting mRS >2; 0.831 for predicting mRS >1), DL achieved AUC of 0.864 for predicting mRS >2 (P=0.11) and 0.834 for predicting mRS >1 (P=0.06), which was not statistically different. The AUC of SVM, RF, and XGB were 0.871 (P<0.001), 0.870 (P=0.01), and 0.871 (P<0.01) for mRS >2, 0.838 (P<0.001), 0.844 (P<0.001), and 0.843 (P<0.001) for mRS >1 respectively, which demonstrated better performance than the LR model (Figure 1). The detailed confu- sion matrix and accuracy are described in Supplementary Table 2. In the reliability diagram, the ECE values of SVM was the lowest for predicting both mRS >2 (0.020) and mRS >1 (0.037), suggesting that the SVM model was the most calibrated (Fig- ure 2). The decision curve analysis indicated that the level of clinical benefit throughout the risk thresholds were similar for
various ML and LR models (Figure 2).
Our study shows that ML models had better discriminated power evaluated by AUC and reliability in predicting clinical outcome after a stroke than conventional LR models. It should be noted that, however, both ML and LR models demonstrated moderate-to-good performances, and ML model did not out- perform LR models in terms of clinical utility.
This study has the advantage that we evaluated reliability and clinical utility of the models in addition to discriminated power comparison. The assessment of the agreement between the predicted and actual outcomes on the calibration plot is a requisite for model validation.
6Also clinical net benefit needs to be evaluated using decision curve analysis.
7The results indi- cate ML was also comparable or superior to LR in terms of reli- ability and clinical net benefit.
ML is effective in dealing with wide data where the number of variables per study subjects is relatively large and interac- tions between variables exist.
8Introducing mixed-media data including image (computer tomography, magnetic resonance imaging), biosignal data acquired from continuous monitoring (blood pressure, heart rate, electrocardiography, and electroen- cephalography) in the analysis in addition to clinical variables with numeric, symbolic features may enable us to develop more accurate predictive ML model.
9Training to predict an outcome with strong signal-to-noise ratio rather than an out-
LR (AUC=0.86 [0.84–0.88], reference) DL (AUC=0.86 [0.84–0.88], P=0.11) SVM (AUC=0.87 [0.85–0.89], P<0.001) RF (AUC=0.87 [0.85–0.89], P=0.01) XGB (AUC=0.87 [0.85–0.89], P<0.01)
LR (AUC=0.83 [0.81–0.85], reference) DL (AUC=0.83 [0.82–0.85], P=0.06) SVM (AUC=0.84 [0.82–0.85], P<0.001) RF (AUC=0.84 [0.83–0.86], P<0.001) XGB (AUC=0.84 [0.83–0.86], P<0.001)
Sensitivity
1-Specificity
3-month mRS >2 3-month mRS >1
0 0.25 0.50 0.75 1.00
1.00
0.75
0.50
0.25
0
Sensitivity
1-Specificity
0 0.25 0.50 0.75 1.00
1.00
0.75
0.50
0.25
0
Figure 1. Receiver operating characteristic curve of classifiers to predict modified Rankin Scale (mRS) >2 (A) and mRS >1 (B). The P-value was calculated us- ing DeLong’s test for the curve of logistic regression (LR) and the machine learning model. AUC, area under curve; DL, deep learning; SVM, support vector ma- chine; RF, random forest; XGB, XGBoost.
A B
come of poor signal-to-noise ratio such as clinical outcome prediction may also improve performance power of ML.
3The limitation of our study is that we only use baseline clini- cal variables and treatment-related factors were not included for model construction. Variables associated with acute stroke management to prevent stroke progression or recurrence and patient’s will for active rehabilitation could have a significant impact on functional recovery.
In conclusion, our study revealed that ML algorithms using baseline clinical parameters had better accuracy, reliability, and similar clinical net benefits to the traditional LR models in pre- dicting functional recovery after an acute ischemic stroke.
Supplementary materials
Supplementary materials related to this article can be found online at https://doi.org/10.5853/jos.2020.02537.
References
1. Nishi H, Oishi N, Ishii A, Ono I, Ogura T, Sunohara T, et al. Pre- dicting clinical outcomes of large vessel occlusion before me- chanical thrombectomy using machine learning. Stroke 2019;50:2379-2388.
2. Heo J, Yoon JG, Park H, Kim YD, Nam HS, Heo JH. Machine learning-based model for prediction of outcomes in acute stroke. Stroke 2019;50:1263-1265.
3. Christodoulou E, Ma J, Collins GS, Steyerberg EW, Verbakel JY, Van Calster B. A systematic review shows no performance benefit of machine learning over logistic regression for clini- cal prediction models. J Clin Epidemiol 2019;110:12-22.
4. Naeini MP, Cooper GF, Hauskrecht M. Obtaining well cali- brated probabilities using Bayesian binning. Proc Conf AAAI Artif Intell 2015;2015:2901-2907.
5. Kerr KF, Brown MD, Zhu K, Janes H. Assessing the clinical
LR (ECE=0.026) DL (ECE=0.066) SVM (ECE=0.020) RF (ECE=0.052) XGB (ECE=0.030)
Observed frequencyStndardized net benefit Stndardized net benefit
Predicted probability
Threshold
0.20 0.25 0.50 0.75 1.00
0.4 0.6 0.8 1.0
1.0
0.8
0.6
0.4
0.2
0
1.00
0.75
0.50
0.25
0
1.00
0.75
0.50
0.25
0
Threshold
0 0.25 0.50 0.75 1.00
Observed frequency
Predicted probability
0.2 0.4 0.6 0.8 1.0
1.0
0.8
0.6
0.4
0.2
0
LR (ECE=0.040) DL (ECE=0.107) SVM (ECE=0.037) RF (ECE=0.062) XGB (ECE=0.045)
LR DL SVM RF XGB All None
LR DL SVM RF XGB All None
3-month mRS >2 3-month mRS >1
3-month mRS >2 3-month mRS >1
Figure 2. Comparison of calibration and clinical utility in different algorithms (A, B) reliability diagram (C, D). Decision curves of models which predict 3-month (A, C) modified Rankin Scale (mRS) >2 and (B, D) mRS >1. LR, logistic regression; ECE, expected calibration error; DL, deep learning; SVM, support vector machine; RF, random forest; XGB, XGBoost.
A
C
B
D
impact of risk prediction models with decision curves: guid- ance for correct interpretation and appropriate use. J Clin Oncol 2016;34:2534-2540.
6. Van Calster B, Nieboer D, Vergouwe Y, De Cock B, Pencina MJ, Steyerberg EW. A calibration hierarchy for risk models was defined: from utopia to empirical data. J Clin Epidemiol 2016;74:167-176.
7. Van Calster B, Wynants L, Verbeek JFM, Verbakel JY, Christo- doulou E, Vickers AJ, et al. Reporting and interpreting deci- sion curve analysis: a guide for investigators. Eur Urol 2018;
74:796-804.
8. Bzdok D, Altman N, Krzywinski M. Statistics versus machine learning. Nat Methods 2018;15:233-234.
9. Mitchell TM. Does machine learning really work? AI Mag 1997;
18:11.
Correspondence: Dong-Wha Kang
Department of Neurology, Asan Medical Center, University of Ulsan College of Medicine, 88 Olympic-ro 43-gil, Songpa-gu, Seoul 05505, Korea
Tel: +82-2-3010-3440 Fax: +82-2-474-4691 E-mail: [email protected] https://orcid.org/0000-0002-2999-485X
Received: June 25, 2020Revised: July 29, 2020 Accepted: August 13, 2020
This research was supported by grants from the Korea Health Technology R&D Project through the Korea Health Industry Development Institute (KHIDI), funded by the Ministry of Health and Welfare, Republic of Korea (grant numbers:
HI18C2383 and HI12C1847).
The authors have no financial conflicts of interest.
Supplementary Table 1. Characteristics of patients based on outcomes
Characteristic Total
(n=6,728)
3-month mRS: 0–2 (n=4,850)
3-month mRS: 3–6
(n=1,878)
P*NA
†Age (yr) 66.8±12.7 64.6±12.5 72.8±11.3 <0.001 0;1
Male sex 4,074 (60.6) 3,147 (64.9) 927 (49.4) <0.001 0;0
Hypertension 4,434 (65.9) 3,074 (63.4) 1,360 (72.5) <0.001 3;1
Diabetes 2,275 (33.8) 1,501 (31.0) 774 (41.2) <0.001 5;1
Hyperlipidemia 2,658 (39.5) 1,931 (39.8) 727 (38.7) 0.417 4;1
Current smoker 2,370 (35.5) 1,836 (38.1) 534 (28.7) <0.001 27;16
Previous stroke including TIA 938 (14.0) 590 (12.2) 348 (18.6) <0.001 6;4
BMI (kg/m
2) 23.9±3.4 24.1±3.4 23.2±3.5 <0.001 31;29
Initial systolic BP (mm Hg) 147.3±26.8 147.6±26.7 146.7±27.2 0.266 10;9
Initial diastolic BP (mm Hg) 86.7±15.7 87.2±15.7 85.3±15.5 <0.001 11;6
Hematocrit (%) 40.4±5.1 41.0±4.9 39.0±5.6 <0.001 23;12
Hemoglobin (g/dL) 13.8±2.0 14.0±1.9 13.3±2.1 <0.001 5;4
Initial glucose (mg/dL) 148.3±72.1 145.3±68.4 156.2±80.6 <0.001 4;3
Creatinine (mg/dL) 1.0±0.9 1.0±0.9 1.0±1.0 0.004 7;6
Total cholesterol (mg/dL) 177.6±43.9 178.2±42.8 176.0±46.4 0.069 31;28
HDL-C (mg/dL) 45.7±12.6 45.6±12.5 46.1±13.0 0.126 79;61
LDL-C (mg/dL) 112.8±41.2 113.4±41.5 111.2±40.3 0.040 44;44
Admission NIHSS 3 (1–5) 2 (1–4) 6 (4–12) <0.001 11;9
Pre-onset mRS 0 (0–0) 0 (0–0) 0 (0–2) <0.001 33;20
Duration between onset and admission (hr) 12.0±6.6 12.3±6.5 11.3±6.8 <0.001 0;0
High risk of cardiac embolic sources 1,175 (17.6) 730 (15.2) 445 (23.9) <0.001 39;19
TOAST classification
Large-artery atherosclerosis 1,766 (27.0) 1,192 (25.4) 574 (31.1) <0.001 154;33
Cardioembolism 1,258 (19.2) 793 (16.9) 465 (25.2)
Small-vessel occlusion 1,835 (28.1) 1,484 (31.6) 351 (19.0)
Other determined etiology 371 (5.7) 304 (6.5) 67 (3.6)
Undetermined etiology 1,311 (20.0) 923 (19.7) 388 (21.0)
Values are presented as mean±standard deviation, number (%), or median (interquartile range).
mRS, modified Rankin Scale; NA, not available; TIA, transient ischemic attack; BMI, body mass index; BP, blood pressure; HDL-C, high-density lipoprotein cho- lesterol; LDL-C, low-density lipoprotein cholesterol; NIHSS, National Institutes of Health Stroke Scale; TOAST, trial of ORG 10172 in acute stroke treatment.
*P-values were calculated using t-test for continuous variables and chi-square test for categorical variables;
†The column titled “NA” represents the number of
missing values in the groups of 3-month mRS 0–2 and 3–6.
Supplementary Table 2. Confusion matrix and accuracy
Variable True positive* False negative* False positive* True negative* Accuracy (%)
†Classification of 3-month mRS >2
Logistic regression 405 (20.1) 108 (5.3) 352 (17.4) 1,154 (57.2) 77.2
Deep neural network 383 (19.0) 130 (6.4) 258 (12.8) 1,248 (61.8) 80.8
Support vector machine 393 (19.5) 120 (5.9) 293 (14.5) 1,213 (60.1) 79.5
Random forest 386 (19.1) 127 (6.3) 248 (12.3) 1,258 (62.3) 81.4
XGBoost 397 (19.7) 116 (5.7) 279 (13.8) 1,227 (60.8) 80.4
Classification of 3-month mRS >1
Logistic regression 590 (29.2) 206 (10.2) 281 (13.9) 942 (46.7) 75.9
Deep neural network 592 (29.3) 204 (10.1) 269 (13.3) 954 (47.3) 76.6
Support vector machine 559 (27.7) 237 (11.7) 223 (11.0) 1,000 (49.5) 77.2
Random forest 615 (30.5) 181 (9.0) 280 (13.9) 943 (46.7) 77.2
XGBoost 596 (29.5) 200 (9.9) 265 (13.1) 958 (47.4) 77.0
mRS, modified Rankin Scale.
*The value represents frequency in the test set (n=2,019) and its percentage is given in parentheses;
†The accuracy (percentage) is calculated at optimal
threshold maximizing Youden index.
Supplementary methods 1. Selection of variables which were used as input for model
The input features for predictive models included only clinical variables measurable at admission. List of the variables and de- tailed counts of missing variables are listed in Supplementary Table 1. The missing values were substituted by Multivariate Imputation by Chained Equations (MICE).
1,2In addition, predic- tors were excluded if they were found to have multicollinearity by a variance inflation factor before model development. Full lists of the variables which were used as input for model are as follows: age, sex, hypertension, diabetes, high risk of cardiac embolic sources, hyperlipidemia, current smoker, previous stroke including transient ischemic attack, initial systolic blood pressure (BP), initial diastolic BP, hematocrit, initial glucose, total cholesterol, high-density lipoprotein cholesterol, National Institutes of Health Stroke Scale (NIHSS) at admission, dura- tion between onset and admission, body mass index, and trial of ORG 10172 in acute stroke treatment (TOAST) classification.
Supplementary methods 2.
Developments of model
Predictive models were constructed using logistic regression (LR) and machine learning (ML) algorithms including deep learning (DL), radial-kernel support vector machine, random forest, and XGBoost. Multiple LR analyses were performed with stepwise model selection using the Akaike information criterion (AIC). The DL model used in this study had the structure of a deep feed-forward neural network, also known as the multi- layer perceptron. The targeted encoding scheme was used to convert a categorical variable into binary features, and stan- dardization was employed to normalize continuous variables when constructing ML models except for random forest and XGBoost.
3As the performance of models derived from the same algorithms can vary according to the settings of the vari- ous hyperparameters, we tuned them by searching the best sets using 3-fold cross-validation and a random search strate- gy. Cross-entropy which is weighted with class frequency was used as a loss function. In a post-processing, temperature scal- ing and isotonic regression was applied to help the neural net- work and the other ML models to calibrate, respectively.
4,5The models and strategies were implemented on Python 3.7.3 with the Scikit-learn and Skorch library.
6,7Supplementary methods 3. Evaluation of reliability and clinical benefit
We used expected calibration error (ECE) for quantitative as- sessment of calibration. ECE is the average of all gaps between the actual and predicted probabilities in each bin, as depicted in a reliability diagram.
8More precisely,
actual(B
m)-predicted(B
m)|, ECE=Σ
Mm=1|Bm|n