Psychometric Properties of the Beck Anxiety Inventory in the Community-dwelling Sample of Korean Adults
Han-Kyeong Lee
1Eun-Ho Lee
2Soon-Taeg Hwang
3Sang-Hwang Hong
4Ji-Hae Kim
1†1Department of Psychiatry, Samsung Medical Center, Sungkyunkwan University School of Medicine, Seoul; 2Depression Center, Department of Psychiatry, Samsung Medical Center, Sungkyunkwan University School of Medicine, Seoul; 3Department of Psychology, Chungbuk National
University, Cheongju; 4Department of Education, Chinju National University of Education, Jinju, Korea
The Beck Anxiety Inventory (BAI) has been used in many countries since its psychological properties have been verified.
However, as there is significant heterogeneity in affective experiences among cultures, a population-specific validation study is necessary. This study examined the psychometric properties of the BAI in a non-clinical Korean population. The BAI, Spielberger State-Trait Anxiety Inventory (STAI), and Patient Health Questionnaire-9 were used to assess the concurrent and discriminant validity. The factorial structures suggested by previous research were examined using the mean- and variance- adjusted weighted least squares estimation. The internal consistency and the item-total correlations were favorable. The test- retest reliability was slightly higher in this present study compared with that in previously reported studies. There was a mod- erate correlation between the BAI and the STAI. Among the five different factor structures, the four-factor model provided the best overall fit. Overall, the current results support the use of the BAI to assess the anxiety severity in community-dwelling populations of Korean adults.
Keywords: Beck Anxiety Inventory, anxiety, reliability, validity, factor analysis
Anxiety is a widespread condition. According to a recent meta- analysis, the lifetime prevalence of total anxiety disorders was 16.6%, and the 1-year prevalence was 10.6% (Somers, Goldner, Waraich, & Hsu, 2006). In Korea, about 12% of females and 5.3%
of males experience anxiety disorders during their lifetime, and the prevalence of anxiety disorders has increased from 5% in 2006 to 8.7% in 2011 (Cho, 2011). Not only are anxiety disorders highly prevalent, the subjective and social burden of the illness is consid- erable (Teachman, 2006; Wittchen, Zhao, Kessler, & Eaton, 1994).
Even mild to moderate levels of anxiety can be accompanied by considerable distress, diminished functioning, and an increased risk of development of diagnosable disorders (Barlow, 2004; Rap- ee, 1991). Given the considerable toll taken by the disorder on pub-
lic health, psychometrically sound methods for assessing anxious symptomatology are critical for theory and research on, and treat- ment of, the emotional conditions (Contreras, Fernandez, Mal- carne, Ingram, & Vaccarino, 2004).
In primary care, many patients present with anxiety but this is seldom systematically assessed (Bakker et al., 2010). To improve anxiety management, assessment of the severity of anxiety is es- sential. However, as anxiety disorders differ in types and symp- toms, assessing the severity of anxiety in general may be difficult.
Among the most widely used anxiety measures, the Beck Anxiety Inventory (BAI) has an advantage in that its validity and reliability have been verified. Also, its brevity and simplicity render it suit- able for a range of research paradigms, and add to its clinical value (Creamer, Foran, & Bell, 1995). Since its development, the BAI has been widely used in clinical research in mental health care, mainly as a measure of general anxiety (Creamer et al., 1995; Osman, Kopper, Barrios, Osman, & Wade, 1997; Piotrowski, 1999). Pa-
ISSN 1229-0335 | eISSN 2733-4538
†Correspondence to Ji-Hae Kim, Department of Psychiatry, Samsung Medical Center, Sungkyunkwan University School of Medicine, 81, Irwon-ro, Gangnam- gu, Seoul 06351, Korea; E-mail: [email protected]
Received Jul 14, 2016; Revised Sep 13, 2016; Accepted Oct 7, 2016
tients with any anxiety disorders had a significantly higher mean score than the controls, suggesting that the BAI can be used as an indicator of anxiety severity in primary care (Muntingh et al., 2011). General rating scales may not be sufficiently specific to as- sess the severity of a certain anxiety disorder. However, extensive testing for different forms of anxiety is also not feasible during a short consultation in primary care. Thus, the BAI may serve as a reliable supplementary tool for clinician’s, and may be reasonable compromise between sensitivity and specificity (Muntingh et al., 2011). Due to its multiple strengths, the BAI has been used in di- verse clinical settings, and research on demographic factors such as age and sex is ongoing (Bergua et al., 2012; Jolly, Aruffo, Wher- ry, & Livingston, 1993; Somers et al., 2006).
The scale was validated in a sample of 160 psychiatric outpa- tients with various anxiety and depressive disorders, and the au- thors reported a high level of internal consistency (Cronbach’s α
=.92) and a good test-retest reliability over one week of .75 (Beck, Epstein, Brown, & Steer, 1988). The psychometric properties of the BAI are well established. In a review of studies on the psychomet- rics of the BAI, it has good internal consistency and test-retest reli- ability (Wilson, De Beurs, Palmer, & Chambless, 1999). The con- vergent validity of the BAI is demonstrated by significant correla- tions with anxiety diaries, self-report instruments, and clinician rating scales (Beck, Brown, Steer, Eidelson, & Riskind, 1987; Fy- drich, 1992; Steer, Ranieri, Beck, & Clark, 1993). Also, it has good discriminant validity, showing a low correlation with the clini- cian-rated Hamilton Depression Rating Scale (Beck et al., 1988).
Moreover, subfactors of the BAI were useful in differentiating spe- cific anxiety disorders (Beck, Steer, & Beck, 1993), and differenti- ated anxiety from depression better than the Spielberger State- Trait Anxiety Inventory (Creamer et al., 1995).
The factor structure of the BAI remains a subject of debate. The original developmental study yielded a two-factor structure con- sisting of subjective and somatic factors, using exploratory factor analysis (Beck et al., 1988). Many other reports supported this two-factor model (Creamer et al., 1995; Kabacoff, Segal, Hersen, &
Van Hasselt, 1997; Steer et al., 1993). Some others suggested a four- factor structure consisting of subjective, neurophysiological, auto- nomic, and panic symptoms (Beck & Steer, 1991; Steer et al., 1993), and still others argued five-factor components to be optimal (Bor-
den, Peterson, & Jackson, 1991). The reason why the BAI factor structure did not reach an agreement may be due to the factor-an- alytic approach used or the particular sample characteristics. For example, the original study by Beck et al. (1988) was conducted on psychiatric outpatients who met the criteria for DSM-III anxiety and/or depressive disorders using exploratory factor analysis (EFA) by oblique rotation. In contrast, Osman et al. derived a four- factor conclusion in both a psychiatric inpatient adolescent sample (Osman et al., 2002) and a non-clinical undergraduate sample by confirmatory factor analysis (CFA) (Osman et al., 1997).
Anxiety disorders are directly related to work capacity, and are more chronic in nature than depressive disorders (Hendriks et al., 2015). Thus, managing the subthreshold anxiety level is also cru- cial in nonclinical clinical samples to reduce potential obstacles in everyday life. However, the optimal cut-off values are specific to each study population, because healthier populations would likely have lower cut-offs (Creamer et al., 1995; Kjærgaard, Arfwedson Wang, Waterloo, & Jorde, 2014). Therefore, it is important to ex- amine the properties of the scale using a variety of non-clinical populations. Also, epidemiological studies suggest that anxiety occurs in all countries, but there is significant heterogeneity in prevalence according to biological, psychological, and social vari- ables (Tseng & Streltzer, 2013). This signals the need for a popula- tion-specific validation study because proper assessment of this condition has significant implications for understanding the com- monalities and distinctions of affective experiences across cultures and may also be crucial for treatment considerations (Contreras et al., 2004; Somers et al., 2006).
In Korea, an effort to examine psychometric properties of the BAI has been made but has been relatively limited considering its extensive usage. There was one EFA study which revealed two- factor solutions in psychiatric and normal adult populations (Yook & Kim, 1997). Han et al. (2003) concluded that a modified second-order four-factor model provided the best overall fit in a sample of psychiatric outpatients using CFA (Han, Cho, Park, Kim, & Kim, 2003). This solution was verified by two other stud- ies, each of which was conducted on general psychiatric outpa- tients (Kim & Kim, 2007) and alcohol dependent patients (Chai &
Cho, 2011). Reproduction of the second-order four-factor model seems encouraging. However, the fact that limitations of the previ-
ous studies have not yet been compensated for leaves much to be desired. As the authors noted, the study by Yook and Kim (1997) lacks a representative sample population, as it was restricted to un- dergraduate students and their parents. Also, Han et al. (2003) pointed that all previous studies using the BAI included an inac- curate translation which raises questions about the reliability of the analyses and requires clarification. Kim et al. (2007) conclud- ed that the second-order four-factor model demonstrated the best fit. However, the fit indices of the model were not acceptable, and showed slight differences from the fit of the four-factor model de- veloped by Beck et al. (1991).
The aim of this study is (1) to evaluate the reliability and validity of the Korean version of the BAI, which was strictly translated, and (2) to investigate the factorial structure suggested by previous studies in a large, normal adult Korean population.
Methods
Participants
We conducted a cross-sectional survey using a stratified sample of 1022 community-dwelling people aged 19 years and over, resident in Seoul, Incheon, Cheongju, Daegu, and Jinju in Korea. This data is a subset of the Korean Beck Anxiety and Depression Inventory (K-BANDI) project, which is an ongoing study to standardize the psychometric properties of the self-report measures (i.e., BDI-II, BAI, and BHS). Participants were recruited from various sources, via educational classes, recreational centers, advertisement, and so forth. The Institutional Review Board of the Samsung Medical Center approved this study. All subjects were paid 5,000 won for their participation.
Measures
Beck Anxiety Inventory (BAI). This 21-item scale was designed to measure clinical anxiety and was constructed to avoid confound- ing with depression. The BAI asks individuals to rate symptoms of anxiety on a four-point scale (e.g., ‘heart pounding or racing’, and
‘fear of losing control’). The BAI has good psychometric proper- ties, with high internal consistency (α=.92) and good test re-test reliability (r =.73). The BAI has good convergent validity with oth- er anxiety measures and discriminant validity with measures of
depression in a large psychiatric sample (Beck et al., 1988; Beck &
Steer, 1991). After obtaining permission to create a Korean version of the BAI from Psychological Corporation (Beck & Steer, 1990), the two authors (JHK, STH) who spoke both English and Korean made the initial translation of the scale from English into Korean.
Next, another blinded bilingual speaker made a back translation from the Korean version into English. The English back transla- tion of the items was compared with the original and reviewed by a group of licensed clinical psychologists. In case of disagreement between the back-translated items and the originals, the authors offered a second Korean translation.
Spielberger State-Trait Anxiety Inventory (STAI). The STAI is a frequently used measure of anxiety. The STAI was designed to measure the current level of anxiety, and the stable propensity to experience anxiety. The scale consists of 40 statements that require individuals to rate on a four-point scale how they generally feel.
Concurrent validity with other anxiety questionnaires ranges from .73–.85 (Spielberger, 1983). We used the Korean version of STAI, which has adequate reliability and validity (Hahn, Lee, Chon, & Speilberger, 2000). The value of Cronbach’s alpha coeffi- cient was .97 in this study.
Patient Health Questionnaire-9 (PHQ-9). The PHQ-9 is a nine- item self-report measure of depression. Each of the nine items cor- responds to one of the DSM-IV Diagnostic Criterion A symptoms for major depressive disorder. Subjects were asked how often, over the last two weeks, they have been bothered by each of the depres- sion-related symptoms. PHQ-9 scores range from 0 to 27, which scores of ≥5, ≥10, ≥15, representing mild, moderate, and severe levels of depression severity (Kroenke, Spitzer, & Williams, 2001).
The psychometric properties of the PHQ-9 are well documented (Kroenke, Spitzer, Williams, & Lowe, 2010). We used the Korean version of the PHQ-9, which has been shown to be highly reliable and valid (Choi et al., 2007). The Cronbach’s alpha for this sample was .82.
Tested Models
Single-factor model: This model postulates that all of the items can be explained by one common factor; The result of the null model can be used as reference points for the fit indices of other models.
Two-factor model: Beck et al. (1998) proposed that a two-factor solution, consisting of somatic symptoms and subjective anxiety, can best explain the construct of the BAI. Items 1, 2, 3, 6, 7, 8, 12, 13, 17, 19, 20, and 21 constitute the somatic factor, and the remain- ing items are the subjective factor.
Three-factor model: In 1996, Cox et al. (1996) insisted that the BAI resembles the Panic Attack Questionnaire, and a solution composed of dizziness-related (items 1, 2, 3, 4, 6, 8, 12, 13, 18, 19, 20, and 21), catastrophic cognition/fear (items 5, 9, 10, 14, 16, and 17), and cardiorespiratory-related factors (items 7, 11, 15) would be optimal (Cox, Cohen, Direnfeld, & Swinson, 1996).
Four-factor model: Beck et al. identified four BAI components, reflecting subjective (items 1, 3, 6, 8, 12, 13, and 19), neurophysio- logical (items 4, 5, 9, 10, 14, and 17), autonomic (items 7, 11, 15, and 16), and panic (items 2, 18, 20, and 21) symptoms of anxiety (Beck
& Steer, 1991).
Second-order four-factor model: Osman et al. (1997) developed a second-order four-factor model that resembles Beck’s four-factor model (Beck & Steer, 1991) and includes the same items. However, in this model, a single higher-order factor, which represents the severity of general anxiety, affects each second-order factor. We also tested a modified four-factor model by Han et al. (2003). In that model, items 8 and 13 were reassigned as subjective factor rather than neurophysiological factor, and items 2, 9, and 16 were added to the subjective factor while being retained in their original capacities.
Five-factor model: The five-factor model consists of the follow- ing factors: subjective fear (items 4, 5, 9, 10, 14, 16, 17, and 18), so- matic nervousness (items 7, 8, 10, 12, and 13), neurophysiological (items 2, 6, 19, 20, and 21), muscular/motoric (items 1, 3, 8, 14, and 18), and respiration (items 11, 15, 16) (Borden et al., 1991).
Statistical Analysis
The Statistical Package for Social Sciences version 21 (SPSS ver. 21) was used to examine internal consistency, corrected item-total correlation, test-retest reliability and concurrent validity of the to- tal sample. We applied a series of CFA to determine the internal structure of the BAI. All hypothesized models were examined us- ing the mean and variance-adjusted weighted least squares esti- mation (WLSMV) implemented in Mplus 6.1. Since the χ² statistic
is highly sensitive to sample size, it is now commonly accepted practice to employ a combination of fit indices in conjunction with the χ² statistic to determine the adequacy of model fit (Bentler &
Bonnet, 1980). In addition to the χ² statistic, the comparative fit index (CFI) and Tucker-Lewis index (TLI) were also employed to compare the hypothesized model with the null hypothesis. Gener- ally, a cut-off value >.90 for the CFI and TLI is considered to be consistent with adequate model fit and a cutoff value close to .95 indicates good model fit (Bentler, 1990; Hu & Bentler, 1999). The model fit of the CFA models was also assessed by the root mean square error of approximation (RMSEA), which is capable of as- sessing how well a hypothesized model reproduces the sample co- variance matrix. For the RMSEA, a cut-off value of 0.05 or lower indicates good model fit and values up to 0.08 represent moderate model fit (Brown & Cudeck, 1993).
Results
Internal Consistency and Item Analysis
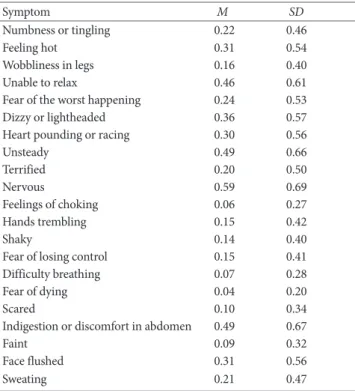
Coefficient alphas and corrected item-total correlations were com- puted for the Korean BAI (Table 1). The reliability coefficient,
Table 1. Means and Standard Deviations of the Korean BAI
Symptom M SD
Numbness or tingling 0.22 0.46
Feeling hot 0.31 0.54
Wobbliness in legs 0.16 0.40
Unable to relax 0.46 0.61
Fear of the worst happening 0.24 0.53
Dizzy or lightheaded 0.36 0.57
Heart pounding or racing 0.30 0.56
Unsteady 0.49 0.66
Terrified 0.20 0.50
Nervous 0.59 0.69
Feelings of choking 0.06 0.27
Hands trembling 0.15 0.42
Shaky 0.14 0.40
Fear of losing control 0.15 0.41
Difficulty breathing 0.07 0.28
Fear of dying 0.04 0.20
Scared 0.10 0.34
Indigestion or discomfort in abdomen 0.49 0.67
Faint 0.09 0.32
Face flushed 0.31 0.56
Sweating 0.21 0.47
Note. BAI=Beck Anxiety Inventory.
Cronbach’s alpha for the Korean BAI total score was .91. Correct- ed item-total correlation ranged from .42 to .65, and the Cronbach’
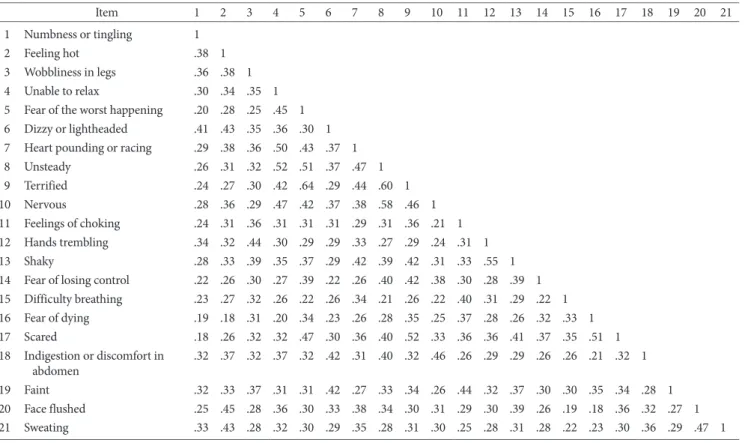
s alpha if item deleted were .90 for all items. The correlations be- tween items of the BAI ranged from .18 to .64 (Table 2). These val- ues are comparable to those reported by previous studies (Beck et al., 1988; Fydrich, 1992).
Test-Retest Reliability
The test-retest correlation for an average time lapse of 7.2 days was .84 (p<.01), which is somewhat higher than the reliability of .75 reported by Beck et al. (1988).
Concurrent and Discriminant Validity
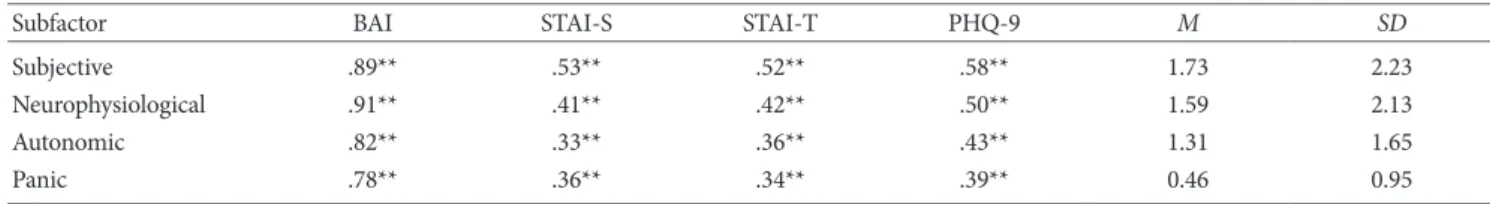
Intercorrelations between the BAI total score and other self-report measures are presented in Table 3. The BAI and the STAI were sig- nificantly correlated. Correlations between two measures relating anxiety symptomatology were positive and moderate in size. The correlations between the BAI subfactors and the STAI were also
significant, ranging from .33 to .53 (Table 4). The BAI and the measure of depression, the PHQ-9, showed slightly higher correla- tions than did the BAI and other anxiety-related measures. Corre- lations between the BAI subfactors and the PHQ-9 ranged from .39 to .58.
Factorial Validity
The previously published factor models were tested using CFA.
Table 5 presents the fit indices for the factor models. None of the Table 2. Intercorrelations among the Items of the BAI for Korean Adults
Item 1 2 3 4 5 6 7 8 9 10 11 12 13 14 15 16 17 18 19 20 21
1 Numbness or tingling 1
2 Feeling hot .38 1
3 Wobbliness in legs .36 .38 1 4 Unable to relax .30 .34 .35 1 5 Fear of the worst happening .20 .28 .25 .45 1 6 Dizzy or lightheaded .41 .43 .35 .36 .30 1 7 Heart pounding or racing .29 .38 .36 .50 .43 .37 1
8 Unsteady .26 .31 .32 .52 .51 .37 .47 1
9 Terrified .24 .27 .30 .42 .64 .29 .44 .60 1
10 Nervous .28 .36 .29 .47 .42 .37 .38 .58 .46 1
11 Feelings of choking .24 .31 .36 .31 .31 .31 .29 .31 .36 .21 1 12 Hands trembling .34 .32 .44 .30 .29 .29 .33 .27 .29 .24 .31 1
13 Shaky .28 .33 .39 .35 .37 .29 .42 .39 .42 .31 .33 .55 1
14 Fear of losing control .22 .26 .30 .27 .39 .22 .26 .40 .42 .38 .30 .28 .39 1 15 Difficulty breathing .23 .27 .32 .26 .22 .26 .34 .21 .26 .22 .40 .31 .29 .22 1 16 Fear of dying .19 .18 .31 .20 .34 .23 .26 .28 .35 .25 .37 .28 .26 .32 .33 1 17 Scared .18 .26 .32 .32 .47 .30 .36 .40 .52 .33 .36 .36 .41 .37 .35 .51 1 18 Indigestion or discomfort in
abdomen .32 .37 .32 .37 .32 .42 .31 .40 .32 .46 .26 .29 .29 .26 .26 .21 .32 1 19 Faint .32 .33 .37 .31 .31 .42 .27 .33 .34 .26 .44 .32 .37 .30 .30 .35 .34 .28 1 20 Face flushed .25 .45 .28 .36 .30 .33 .38 .34 .30 .31 .29 .30 .39 .26 .19 .18 .36 .32 .27 1 21 Sweating .33 .43 .28 .32 .30 .29 .35 .28 .31 .30 .25 .28 .31 .28 .22 .23 .30 .36 .29 .47 1 All correlations p<.01.
Note. BAI=Beck Anxiety Inventory.
Table 3. Correlations among the BAI and Other Study Measures
BAI STAI-S STAI-T PHQ-9 M SD
BAI 1 5.12 6.02
STAI-S .49** 1 37.69 11.03
STAI-T .50** .89** 1 38.78 11.23
PHQ-9 .58** .59** .60** 1 3.69 3.66
Note. BAI=Beck Anxiety Inventory; STAI-S=Spielberger State Anxiety Inventory; STAI-T =Spielberger Trait Anxiety Inventory; PHQ-9 = Patient Health Questionnaire-9.
**p<.01
models, except the four-factor solution, provided an adequate fit to the data (Figure 1). Three fit indices (CFI, TLI, and RMSEA) indi- cated that both CFI and TLI were greater than .90, and RMSEA was .06. All item loadings were statistically significant. The inter- correlations among the sub-factors ranged from .79 to .97. The five-factor model produced by Borden et al. (1991) provided the best fit with the data. However, the muscular/motoric factor and item 8 (Unsteady) showed negative correlations, which seems the- oretically inappropriate. The second-order four-factor model by Osman et al. (1997) and the modified model by Han et al. (2003) showed negative variances among the factors, which indicates that these solutions are not applicable to the current data.
Discussion
The purpose of the present study is to investigate whether the BAI, widely used self-report measure of anxiety has a sound psycho- metric property in the Korean normal adult populations. As in previous research, the internal consistency as measured by Cron- bach's coefficient alpha and the item-total correlations in terms of level of significance proved to be favorable. The stability of the in- ventory as measured by the test-retest reliability was slightly high- er than reported previously. The BAI and the STAI showed mod- erate correlations with one another.
However, the relationship between anxiety measured by the
BAI and depression measured by the PHQ-9 was not negligible.
This is consistent with the prior literature on the BAI, as well as on other measures of anxiety (de Beurs, Wilson, Chambless, Gold- stein, & Feske, 1997). This finding could be interpreted as either insufficient discriminant validity or as an accurate reflection of concordance between anxiety and depression. According to tri- partite model of emotion, these two states share negative affectivi- ty, and the difference between anxiety and depression lies in the presence of neurophysiological arousal in anxious people and the absence of positive affectivity in depressed people (de Beurs et al., 1997; Watson, Clark, & Carey, 1988). Also, it has been suggested that depression and anxiety might share an underlying biological and genetic diathesis (Kendler, 1996). Reflecting these commonal- ities, DSM-5 diagnostic criteria overlap with regard to symptoms such as irritability, trouble with concentration, sleep problems, restlessness, and fatigue. Therefore, the moderate correlations be- tween the BAI with PHQ-9 can be interpreted as supporting its construct and biological validity. Regarding the correlations be- tween the BAI subfactors and measure of anxiety or depression, the PHQ-9 showed the highest correlations overall, which gives reason to doubt the construct validity of the BAI. However, the fact that subjective factor, which contributes most to the covari- ance between anxiety and depression, showed the highest correla- tions, while the panic factor, which is theoretically regarded as specific to anxiety, showed the lowest correlation, indicate that Table 4. Correlations among the BAI Subfactors and Other Study Measures
Subfactor BAI STAI-S STAI-T PHQ-9 M SD
Subjective .89** .53** .52** .58** 1.73 2.23
Neurophysiological .91** .41** .42** .50** 1.59 2.13
Autonomic .82** .33** .36** .43** 1.31 1.65
Panic .78** .36** .34** .39** 0.46 0.95
**p<.001.
Table 5. Summary of Results from Confirmatory Factor Analyses
Study Model X2 df CFI TLI RMSEA 90% CI
Null Model One-factor 879.35 189 .94 .93 .06 .056 - .064
Beck et al., 1988 Two-factor 857.05 188 .94 .93 .06 .055 - .064
Cox et al., 1996 Three-factor 925.61 186 .94 .93 .06 .058 - .066
Beck et al., 1991 Four-factor 860.11 183 .95 .94 .06 .056 - .064
Borden et al., 1991 Five-factor 690.36 174 .96 .95 .05 .050 - .058
Note. CFI=comparative fit index; TLI=Tucker-Lewis index; RMSEA=root mean square error of approximation; CI=confidence interval.
subfactors may be more informative when using the BAI for screening purposes.
We next investigated which published factor structures would show the best fit via CFA. With regard to the existing BAI models, the four-factor model by Beck et al. (1991) provided the best over- all fit. Even though the Korean version of the BAI remains some- what ambiguous, it has been suggested that BAI represents a con- sistent flow of cognitive and somatic factors. For instance, Borden et al. (1991) propose that their five-factor model resembles Beck’s original two-factor model, in that all but a subjective factor pres- ents somatic dimensions. They expect that somatic experience might differ according to anxiety level, and milder forms of anxi- ety can be experienced as more specific and delineated forms.
Also, Creamer et al. (1995) showed that factorial structure differed in times of low stress vs. high stress in the same subject group.
Thus, in the context of sample heterogeneity, a different conclu- sion does not mean that the factorial structure of BAI is ambigu- ous. Rather, this strongly suggests that a population-specific study is needed according to an analysis.
This study has several strengths. First, many of the problems that have been pointed out in previous studies using the Korean version of the BAI were addressed. Specifically, we used a large, stratified sample, which is rare in Asian countries to standardize the BAI. Also, we made an effort at more thorough translation via several back translation processes. We also investigated which suggested models showed the best overall fit via CFA using the WLSMV implemented in Mplus 6.1, which can be regarded as an advanced statistical technique.
This study has some limitations, many of which could be clari- fied by future work. First, we should be cautious about generaliz- Figure 1. Four-factor model and the standardized factor loadings of the BAI.
ing the findings to clinical populations. Even though the four-fac- tor model is favorable and is in line with our research, most of the research is based on clinical populations. This result should be verified in various patient groups, especially in those with anxiety disorder, possibly also considering the subtype. Also, the reason for the high correlation between the BAI and depression measure should be clarified in a clinical population. Lastly, only self-report measures were used, accordingly relationships between study variables may have been inflated by questionnaire-specific meth- od variance.
Conclusion
This study revealed that the Korea version of the BAI showed fa- vorable psychometric properties. The current findings suggest that the BAI can be used as a reliable anxiety measuring tool in non- clinical adult population of Korea. Also, among the reported facto- rial structure, the four-factor model showed the best overall fit.
References
Bakker, I. M., van Marwijk, H. W., Terluin, B., Anema, J. R., van Mechelen, W., & Stalman, W. A. (2010). Training GP's to use a minimal intervention for stress-related mental disorders with sick leave (MISS): Effects on performance: Results of the MISS proj- ect; A cluster-randomised controlled trial [ISRCTN43779641].
Patient Education and Counselings, 78, 206-211.
Barlow, D. H. (2004). Anxiety and its disorders: The nature and treatment of anxiety and panic (2 ed.). New York: Guilford press.
Beck, A. T., Brown, G., Steer, R. A., Eidelson, J. I., & Riskind, J. H.
(1987). Differentiating anxiety and depression: A test of the cog- nitive content-specificity hypothesis. Journal of Abnormal Psy- chology, 96, 179-183.
Beck, A. T., Epstein, N., Brown, G., & Steer, R. A. (1988). An inven- tory for measuring clinical anxiety: Psychometric properties.
Journal of Consulting and Clinical Psychology, 56, 893-897.
Beck, A. T., & Steer, R. A. (1990). Manual for the Beck Anxiety In- ventory. San Antonio, TX: Psychological Corporation.
Beck, A. T., & Steer, R. A. (1991). Relationship between the Beck Anxiety Inventory and the Hamilton Anxiety Rating Scale with anxious outpatients. Journal of Anxiety Disorders, 5, 213-223.
Beck, A. T., Steer, R. A., & Beck, J. S. (1993). Types of self-reported anxiety in outpatients with DSM-III-R anxiety disorders. Anxi- ety, Stress, & Coping, 6, 43-55.
Bentler, P. M. (1990). Comparative fit indices in structural models.
Psychological Bulletin, 107, 238-246.
Bentler, P. M., & Bonnet, D. C. (1980). Significance tests and good- ness of fit in the analysis of covariance structures. Psychological Bulletin, 107, 238-246.
Bergua, V., Meillon, C., Potvin, O., Bouisson, J., Le Goff, M., Rouaud, O., . . . Amieva, H. (2012). The STAI-Y trait scale: Psy- chometric properties and normative data from a large popula- tion-based study of elderly people. International Psychogeriatrics, 24, 1163-1171.
Borden, J. W., Peterson, D. R., & Jackson, E. A. (1991). The Beck Anxiety Inventory in nonclinical samples: Initial psychometric properties. Journal of Psychopathology and Behavioral Assess- ments, 13, 345-356.
Brown, M. W., & Cudeck, R. (1993). Alternative ways of assessing model fit. In K. A. Bollen & J. S. Long (Eds.), Testing structural equation models (pp. 136-162). Newbury Park, CA: Sage.
Chai, S. H., Han, E. K., & Cho, Y. (2011). Confirmatory factor analysis of the Korean version of the Beck Anxiety Inventory in a sample of male alcoholics. Korean Journal of Clinical Psycholo- gy, 30, 1027-1035.
Cho, M. J. (2011). The epidemiology survey of mental disorders in Korea. Seoul: Ministry of Health and Welfare.
Choi, H. S., Choi, J. H., Park, K. H., Joo, K. J., Ga, H., Ko, H. J., &
Kim, S. R. (2007). Standardization of the Korean version of Pa- tient Health Questionnaire-9 as a screening instrument for ma- jor depressive disorder. Journal of the Korean Academy of Family Medicine, 28, 114-119.
Contreras, S., Fernandez, S., Malcarne, V. L., Ingram, R. E., & Vac- carino, R. V. (2004). Reliability and validity of the Beck Depres- sion and Anxiety Inventories in Caucasian Americans and Lati- nos. Hispanic Journal of Behavioral Sciences, 26, 446-462.
Cox, B. J., Cohen, E., Direnfeld, D. M., & Swinson, R. P. (1996).
Does the Beck Anxiety Inventory measure anything beyond panic attack symptoms? Behaviour Research and Therapy, 34, 949-954.
Creamer, M., Foran, J., & Bell, R. (1995). The Beck Anxiety Inven- tory in a non-clinical sample. Behaviour Research and Therapy, 33, 477-485.
de Beurs, E., Wilson, K. A., Chambless, D. L., Goldstein, A. J., &
Feske, U. (1997). Convergent and divergent validity of the Beck Anxiety Inventory for patients with panic disorder and agora- phobia. Depression and Anxiety, 6, 140-146.
Fydrich, T. (1992). Reliability and validity of the Beck Anxiety In- ventory. Journal of Anxiety Disorders, 6, 55-61.
Hahn, D. W., Lee, C. H., Chon, K. K., & Speilberger, C. D. (2000).
Manual for STAI-KYZ. Seoul: Hakjisa.
Han, E., Cho, Y., Park, S., Kim, H., & Kim, S. (2003). Factor struc- ture of the Korean version of the Beck Anxiety Inventory: An
application of confirmatory factor analysis in psychiatric pa- tients. Korean Journal of Clinical Psychology, 22, 261-270.
Hendriks, S. M., Spijker, J., Licht, C. M., Hardeveld, F., de Graaf, R., Batelaan, N. M., . . . Beekman, A. T. (2015). Long-term work dis- ability and absenteeism in anxiety and depressive disorders.
Journal of Affective Disorders, 178, 121-130.
Hu, L. T., & Bentler, P. (1999). Cutoff criteria for fit indices in cova- riance structure analysis: Conventional criteria versus new alter- natives. Structural Equation Modeling, 6, 1-55.
Jolly, J. B., Aruffo, J. F., Wherry, J. N., & Livingston, R. (1993). The utility of the Beck Anxiety Inventory with inpatient adolescents.
Journal of Anxiety Disorders, 7, 95-106.
Kabacoff, R. I., Segal, D. L., Hersen, M., & Van Hasselt, V. B. (1997).
Psychometric properties and diagnostic utility of the Beck Anxi- ety Inventory and the State-Trait Anxiety Inventory with older adult psychiatric outpatients. Journal of Anxiety Disorders, 11, 33-47.
Kendler, K. S. (1996). Major depression and generalised anxiety disorder. Same genes, (partly) different environments-revisited.
British Journal of Psychiatry Supplement, 30, 68-75.
Kim, S., & Kim, K. (2007, June). Confirmatory factor analysis of the Korean version of the Beck Anxiety Inventory in psychiatric pa- tients. Paper presented at the annual meeting of the Korean Psy- chological Association.
Kjærgaard, M., Arfwedson Wang, C. E., Waterloo, K., & Jorde, R.
(2014). A study of the psychometric properties of the Beck De- pression Inventory‐II, the Montgomery and Åsberg Depression Rating Scale, and the Hospital Anxiety and Depression Scale in a sample from a healthy population. Scandinavian Journal of Psychology, 55, 83-89.
Kroenke, K., Spitzer, R. L., & Williams, J. B. (2001). The PHQ-9:
Validity of a brief depression severity measure. Journal of Gener- al Internal Medicine, 16, 606-613.
Kroenke, K., Spitzer, R. L., Williams, J. B., & Lowe, B. (2010). The Patient Health Questionnaire somatic, anxiety, and depressive symptom scales: A systematic review. General Hospital Psychiatry, 32, 345-359.
Muntingh, A. D., van der Feltz-Cornelis, C. M., van Marwijk, H.
W., Spinhoven, P., Penninx, B. W., & van Balkom, A. J. (2011). Is the Beck Anxiety Inventory a good tool to assess the severity of anxiety? A primary care study in the Netherlands Study of De- pression and Anxiety (NESDA). BMC Family Practice, 12, 66.
Norton, G. R., Dorward, J., & Cox, B. J. (1986). Factors associated
with panic attacks in nonclinical subjects. Behavior Therapy, 17, 239-252.
Osman, A., Hoffman, J., Barrios, F. X., Kopper, B. A., Breitenstein, J.
L., & Hahn, S. K. (2002). Factor structure, reliability, and validity of the Beck Anxiety Inventory in adolescent psychiatric inpa- tients. Journal of Clinical Psychology, 58, 443-456.
Osman, A., Kopper, B. A., Barrios, F. X., Osman, J. R., & Wade, T.
(1997). The Beck Anxiety Inventory: Reexamination of factor structure and psychometric properties. Journal of Clinical Psy- chology, 53, 7-14.
Piotrowski, C. (1999). The status of the Beck Anxiety Inventory in contemporary research. Psychological Reports, 85(1), 261-262.
Rapee, R. (1991). Generalized anxiety disorder: A review of clinical features and theoretical concepts. Clinical Psychology Review, 11, 419-440.
Somers, J. M., Goldner, E. M., Waraich, P., & Hsu, L. (2006). Preva- lence and incidence studies of anxiety disorders: A systematic review of the literature. Canadian Journal of Psychiatry, 51, 100- 113.
Spielberger, C. D. (1983). Manual for the State-Trait Anxiety Inven- tory (Form Y). Palo Alto, CA: Consulting Psychologists Press.
Steer, R. A., Ranieri, W. F., Beck, A. T., & Clark, D. A. (1993). Fur- ther evidence for the validity of the Beck Anxiety Inventory with psychiatric outpatients. Journal of Anxiety Disorders, 7, 195-205.
Teachman, B. A. (2006). Aging and negative affect: The rise and fall and rise of anxiety and depression symptoms. Psychology and Aging, 21, 201-207.
Tseng, W. S., & Streltzer, J. (2013). Culture and psychopathology: A guide to clinical assessment. New York: Routledge.
Watson, D., Clark, L. A., & Carey, G. (1988). Positive and negative affectivity and their relation to anxiety and depressive disorders.
Journal of Abnormal Psychology, 97, 346-353.
Wilson, K. A., De Beurs, E., Palmer, C. A., & Chambless, D. L.
(1999). Beck Anxiety Inventory. In M. E. Maruish (Ed.), The use of psychological testing for treatment planning and outcomes as- sessment (2nd ed., pp. 971-992). Mahwah, NJ: Lawrence Erl- baum.
Wittchen, H. U., Zhao, S., Kessler, R. C., & Eaton, W. W. (1994).
DSM-III-R generalized anxiety disorder in the national comor- bidity survey. Archives of General Psychiatry, 51, 355-364.
Yook, S., & Kim, Z. (1997). A clinical study on the Korean version of Beck Anxiety Inventory: Comparative study of patient and non-patient. Korean Journal of Clinical Psychology, 16, 185-197.