1)1. Introduction
Precipitation supplies forest ecosystems with water and nutrients, and mediates nutrient cycles. The forest water balance is important to support the production, hydrology, and climate at regional scales (Esser and Overdieck, 1991). Under sustained precipitation, the
water-holding capacity of trees decreases and water is divided into stemflow, which drains through the crown and down the stem, throughfall, which passes through the canopy to the soil, and interception loss, which evaporates. Each route has a critical role in the water cycle in forests, and the distribution of water among the routes is affected by the forest canopy
Received 1 July, 2019; Revised 3 September, 2019;
Accepted 5 September, 2019
*Corresponding author: Kee Dae Kim, Department of Environmental Education, Korea National University of Education, Chungbuk 28173, Korea
Phone : +82-43-230-3727 E-mail:[email protected]
ⓒ The Korean Environmental Sciences Society. All rights reserved.
This is an Open-Access article distributed under the terms of the Creative Commons Attribution Non-Commercial License (http://
creativecommons.org/licenses/by-nc/3.0) which permits unrestricted non-commercial use, distribution, and reproduction in any medium, provided the original work is properly cited.
ORIGINAL ARTICLE
Inorganic Nutrient Inputs from Precipitation, Throughfall, and
Stemflow in Pinus densiflora and Quercus mongolica Stands in an Urban Forest Ecosystem
Kee Dae Kim*
Department of Environmental Education, Korea National University of Education, Chungbuk 28173, Korea
Abstract
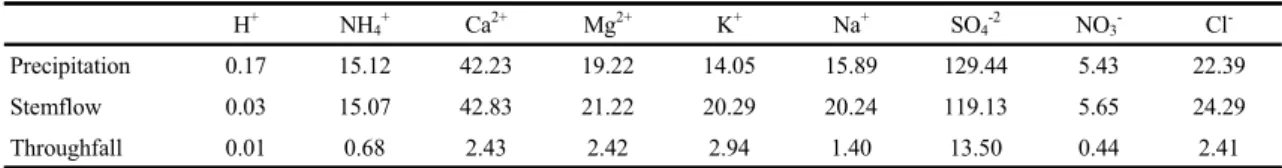
We measured the amount of precipitation, stemflow, and throughfall and concentrations of nine major inorganic nutrients (H+, NH4+, Ca2+, Mg2+, K+, Na+, Cl-, NO3-, and SO42-) to investigate the nutrient inputs into soil from precipitation in Pinus densiflora and Quercus mongolica stands from September 2015 to August 2016. The precipitation inputs of H+, NH4+, Ca2+, Mg2+, K+, Na+, Cl-, NO3-, and SO42- into soil were 0.170, 15.124, 42.227, 19.218, 14.050, 15.887, 22.391, 5.431, and 129.440 kg·ha-1·yr-1, respectively. The P. densiflora stemflow inputs were 0.008, 0.784, 1.652, 1.044, 0.476, 0.651, 1.509, 0.278, and 9.098 kg·ha-1·yr-1, and those for Q. mongolica were 0.008, 0.684, 2.429, 2.417, 2.941, 1.398, 2.407, 0.436, and 13.504 kg·ha-1·yr-1, respectively. The P. densiflora throughfall inputs were 0.042, 21.518, 52.207 27.694, 20.060, 24.049, 37.229, 10.241, and 153.790 kg·ha-1·yr-1, and those for Q. mongolica were 0.032, 15.068, 42.834, 21.219, 20.294, 20.237, 24.288, 5.647, and 119.134 kg·ha-1·yr-1, respectively. Of the total throughfall flux (i.e., stemflow + throughfall flux) of the nine ions for the two species, SO42- had the greatest total throughfall flux and H+ had the lowest. The net throughfall fluxes of the ions for the two species had various correlations with the precedent dry period, rainfall intensity, rainfall amount, and pH of precipitation. The soil pH under the Q. mongolica canopy (4.88) was higher than that under the P. densiflora canopy (4.34).
The difference in the soil pH between the two stands was significant (P < 0.01), but the difference in soil pH by the distance from the stems of the two species was not (P > 0.01). This study shows the enrichments of inorganic nutrients by two representative urban forests in temperate regions and the roles of urban forests during rainfall events in a year.
Key words : Inorganic nutrient, Net throughfall flux, pH, Pinus densiflora, Precedent dry period, Quercus mongolica, Rainfall intensity
architecture (Parker, 1983; Pathak et al., 1985).
Nutrient cycles are strongly associated with the hydrological cycle, and nutrient inputs and outputs are directly related to the amount of water that moves into and out of forest ecosystems (Bormann and Likens, 1967). For example, a study of nutrient transport from fallen dead leaves and rainfall revealed that rainfall had a 11 46% influence on the forest nutrient cycle (Mehra et al., 1985).
Nutrient inputs via precipitation include external inputs (e.g., atmospheric deposition) and internal inputs (e.g., leaching from plants) (Ivens, 1990).
Therefore, stemflow and throughfall have greater nutrient contents than precipitation (Gosz, 1980) and fluctuate according to canopy conditions (Alenas and Skarby, 1988).
Atmospheric deposition, which is affected by natural and anthropogenic influences, can be subdivided into dry and wet deposition (Bidleman, 1988; Howells, 1990). The rough surface of trees is advantageous for dry deposition, which can be estimated to chemically analyze throughfall (Lindberg et al., 1986; Ivens, 1990; Lindberg and Lovett, 1992).
Moreover, coniferous forests tend to capture more dry deposition than deciduous forests because of their durable canopies and wide leaf surface area (Reuss and Johnson, 1986).
Rainfall moves through branches and stems, interacting with plant surfaces and transporting minerals to soil, thereby changing the soil chemical characteristics (Parker, 1983). Both inner ions from plants and atmospheric fallout undergo such chemical eluviation on leaves via rainfall (Miller et al., 1975).
Meanwhile, stemflow partially affects water and nutrients near the stem, which influences vegetation distribution (Zinke, 1962; Gersper and Holowaychuk, 1970; Falkengren-Grerup, 1989; Hazlett and Foster, 1989; Andersson, 1991).
In Korea, stemflow and throughfall have been measured in coniferous Pinus taeda forests and
deciduous forests predominated by Alnus hirsuta and Quercus mongolica (Kim and Woo, 1988).
Additionally, runoff loss relative to total rainfall has been researched in forests of Pinus densiflora and P.
taeda (Lee, 1992). Finally, scholars have investigated the mineral nutrient cycles of nitrogen, phosphorus, and potassium (Kim and Kwak, 1992), as well as the amounts of ammonium nitrogen and nitrate nitrogen in stemflow and throughfall (Seo, 1988).
As an extension of existing research, our first study objective is to quantify the inputs of nine inorganic nutrients into soil via stemflow and throughfall in P.
densiflora and Q. mongolica trees in an urban forest of the representative temperate region. And second study objective is to show the roles of urban forest hydrology in urban forest ecosystem.
2. Methodology 2.1. Study sites
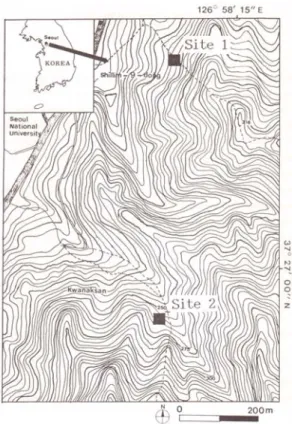
The two study sites were located on Gwanaksan Mountain, Seoul, South Korea (latitude: 37°26′N 37°30′N, longitude: 126°56′E 126°57′E) (Fig. 1).
The slope, aspect and elevations of study site A and study site B were 2°, north-west, 260 m and 16°, north-east, 215 m, respectively. Study site A was predominated by P. densiflora (61% cover), with 51 individuals in a 20 × 20-m study plot, and Q.
mongolica (56% cover), with 58 individuals in a 20 × 20-m study plot.
The plant vegetation of site A included P. densiflora in the tree layer, Robinia pseudoacacia, Pinus koraiensis, A. hirsute, Pinus rigida, Sorbus alnifolia, Juniperus rigida, Rhus trichocarpa, Rhododendron schlippenbachii, Q. mongolica, Quercus serrata, Lindera obtusiloba, Zanthoxylum piperitum, and Lespedeza bicolor in the shrub layer, and Rubus crataegifolius, Spodiopogon cotulifer, and Carex lanceolata in the herbaceous layer.
The plant vegetation of site B included P. densiflora
in the tree layer, P. densiflora, S. alnifolia, Acer pseudosieboldianum, Rhododendron mucronulatum, Symplocos chinensis f. pilosa, stephanandra incisa, R.
trichocarpa, and J. rigida in the shrub layer, and Pteridium aquilinum var. latiusculum, C. lanceolata, Artemisia keiskeana, Carex siderosticha, Viola mandshurica, Smilax sieboldii, Polygonatum odoratum var. pluriflorum, and Liparis kumokiri in the herbaceous layer.
Fig. 1. Locations of Pinus densiflora stand (site 1) and Quercus mongolica stand (site 2).
To determine the stem thickness of the dominant vegetation (P. densiflora and Q. mongolica), the frequency distribution of the stem diameter at 120 cm above ground level was determined, and the diameter classes were grouped in 2.0-cm increments. The stem diameter of P. densiflora at site A had a maximum distribution at 4 6 and 6 8 cm (mean stem diameter:
9.5 cm) and the stem diameter of Q. mongolica at site B had a maximum distribution at 0 2 cm (mean stem diameter: 6.9 cm). Stemflow and throughfall samplers were placed throughout the study plots.
The average annual temperature of Seoul during study days was 13.6 (±10.8). The annual total precipitation of Seoul during study days was approximately 1047 mm (Fig. 2).
Fig. 2. Monthly variation of amount of total precipitation (mm) and mean temperature ( ) during September 2015 to August 2016. The data are based on the climate data of meteorological auxiliary station in Seoul.
2.2. Precipitation water sampling
Rainfall, defined as precipitation above the canopy or in open sites (hereafter unintercepted precipitation), stemflow, and throughfall in the P. densiflora and Q.
mongolica plots were sampled within 24 h of rainfall or snowfall from September 2015 to August 2016 (Stephen and Wigington, 1987).
2.2.1. Water sampling of unintercepted precipitation A 30-L rain gauge with a 21.7-cm-diameter funnel (funnel cross-section area: 369.84 cm2) was fixed to a 1.5-m support stand on the rooftop of the biology building at Seoul National University. Water precipitation outside the forest was sampled in a cylinder (So and Lee, 1986). For the chemical analysis, precipitation was treated with 3 N hydrochloric acid, filtered through filter paper (Whatman No. 44) from a plastic bottle into a 220-mL
polyethylene bottle, and stored at 4 .
2.2.2. Water sampling of precipitation in trees 2.2.2.1. Stemflow sampling
Each stemflow collector was cleaned by soaking in hydrochloric acid for 24 h and glued with adhesive to the bark of a tree, which had been cut, wrapped with a rubber plate, and washed with distilled water (thickness: 6 cm; width: 7 cm) A piece of stainless steel was used to stabilize the rubber plate. An acrylic tube was placed between the bark and rubber plate and tilted to allow water to flow. The acrylic tube was connected to a plastic tube that drained into a 100-L plastic bottle. The apparatus was tested for leaks, and water gauges were attached to the plastic bottle and hose in July and August to prevent overflow. The water gauge accuracy was measured based on a comparative analysis of water flow measurements.
Stemflow collectors were set up at diameter at breast height (DBH) on seven P. densiflora and seven Q.
mongolica trees. Then, 100 L of water collected in the stemflow bottles was mixed ten times and transferred to a 220-mL polyethylene bottle that had been cleaned with hydrochloric acid. The remaining volume was measured using a cylinder. The acrylic tube entrance of the sampler was covered with nylon mesh (mesh size: 0.25 mm) to prevent leaf contamination. After each sample collection, leaves were removed from the rubber plate of the stemflow sampler. The remaining volume of stemflow was used to clean the sampler and the plastic bottle (Jorge and Lugo, 1985). Each 220-mL polyethylene bottle was transported to the lab, filtered through filter paper (Whatman No. 44), and stored at 4 .
2.2.2.2. Throughfall sampling
Throughfall was collected in a 20-L bottle connected to a plastic cone placed 1 m from the tree stem. To exclude water from the soil and nearby trees, the cone was positioned at a height of 60 cm (Feller, 1977). The cone was covered with nylon mesh (mesh
size: 0.25 mm) to exclude leaves and insects. To prevent algal and microorganism growth, the outer cone and tube were colored black. The throughfall collectors were set up near ten P. densiflora and ten Q.
mongolica trees. Shrubs and bushes were removed within 7 m of the throughfall collectors. After each sample collection, newly grown shrubs and bushes were removed. During sampling, the throughfall volume was measured and 200 mL was transferred to a polyethylene bottle and stored at 4 for subsequent chemical analysis.
2.3. Precipitation measurements 2.3.1. Unintercepted precipitation
Unintercepted precipitation per area was measured after every rain event using a sampling funnel and converted into the volume per site area to determine the precipitation inflow into the forest.
2.3.2. Precipitation measurement in forests 2.3.2.1. Stemflow
The total stemflow in forests is proportional to the density of trees and basal area at breast height (Killingbeck and Wali, 1978). The following formula was devised based on these two variables and the unintercepted precipitation in the projected area.
S = 1/2 ×[(D1 + D2) / D1 + (B1 + B2) / B1] × Vc (1) D1: total tree density (No./m2)
D2: tree density of non-stemflow collection trees (No./m2)
B1: total tree basal area (m2/plot)
B2: basal area of non-stemflow collection trees (m2/plot)
Vc: volume of stemflow collected (L/plot) S: stemflow (L/plot)
2.3.2.2. Throughfall
Throughfall can be determined from the average throughfall measured with or without a water pipe
(Pathak et al., 1985).
T = (Awc ×R + Auc ×Ri) / A (2) Awc: area without overhead canopy (m2) R: unintercepted rainfall (mL)
Auc: area under the canopy (m2) Ri: throughfall under the canopy (mL) A: plot area (m2)
T: throughfall (mL)
2.4. Chemical analysis of precipitation
We measured the pH of unintercepted precipitation, stemflow, and throughfall filtered through filter paper using a suction pump with a pH meter (model 230A; Fisher) standardized with pH 4 and 7 buffer solutions. Conductivity was measured using a conductivity meter (DM 35; Kramer Electronics), and NH4+ was assayed colorimetrically with phenate and measured with a spectrophotometer (model 24; Beckman Instruments) at 640 nm (APHA, 1989). For NO3-, samples were diluted by one-half, one-fifth, or one-tenth according to the concentration of the sample, and NO3- was detected colorimetrically with hydrazine using a reduction method and measured with a spectrophotometer (model 24; Beckman Instruments) at 540 nm (Cho et al., 1991).
We measured SO42- turbidity using a spectro -photometer (model 24; Beckman Instruments) at 420 nm after precipitation with BaCl2 (APHA, 1989). To block interference by K+ and Na+, CsCl2
was added in an appropriate quantity based on atomic absorption spectrophotometry (AAS; model 901; GBC Scientific Equipment). To block interference by Mg2+ and Ca2+, LaCl2 was added in an appropriate quantity based on AAS (Moore and Chapman 1986). Cl- was measured using an ion analyzer with an ion-selective electrode (Model No 94-17; Orion Research Inc.) (Allen et al., 1974;
Orion Research Inc., 1986). Because of freezing,
the samples from January and February were pooled and the monthly average was used.
2.5. Mineral nutrient concentrations
Unintercepted precipitation, stemflow, and throughfall in quadrats were multiplied by the amount of nutrients per volume to determine the mineral nutrients per area (kg/ha).
2.6. Soil pH measurement
In both P. densiflora and Q. mongolica plots, soil samples were collected near two trees located on flat ground and isolated from other trees. At each tree, one sample was collected where the stem of the tree met the ground, and the other samples were collected at 10-cm increments horizontally from the first sample. Soil was sampled using a soil sleeve (diameter: 4.5 cm) at a depth of 0–5 cm after leaf removal. To reduce errors related to differences in the soils at both sites, soil was also collected at a distance of 150 cm from each P. densiflora tree and 130 cm from each Q. mongolica tree. The sampled soil was transported to the lab and dried in the shade for one week. The dried soil was filtered through a 2-mm sieve, mixed with distilled water at a 1:5 ratio of soil:distilled water for 30 min, filtered through filter paper (Whatman No. 44), and measured using a pH meter (model 230A; Fisher) standardized with pH 4 and 7 buffer solutions.
2.7. Statistical analysis
We performed a correlation analysis of the unintercepted precipitation, stemflow from the P.
densiflora and Q. mongolica stands, and ion concentration, and completed a stepwise regression analysis of the net throughfall (NTF) input with five precipitation characteristics and a soil pH comparison by distance from the stem using a two-way analysis of variance (ANOVA) with no repetitions due to differences among trees. The
analyses were performed using SAS software ver.
9.4 (SAS Institute Inc., 2015).
3. Results
3.1. Mineral nutrient inflow
3.1.1. Unintercepted precipitation
The pH of precipitation ranged from 4.2 to 7.13, and the H+ concentration was at least 0.074–
63 µg·L-1. From the frequency distribution of 41 precipitation events divided into pH increments of 0.2, the maximum number of precipitation events (11) was distributed within a pH of 4.9–5.2. We found that pH values of 4.1–5.2 and 5.2–7.2 accounted for 76% and 24%, respectively and rains of < 5.2 pH were predominant.
The monthly difference in H+ based on the amount of precipitation was high in May–July, low in August–November (9 µmho), and increased to an average of 31 µmho in September–December.
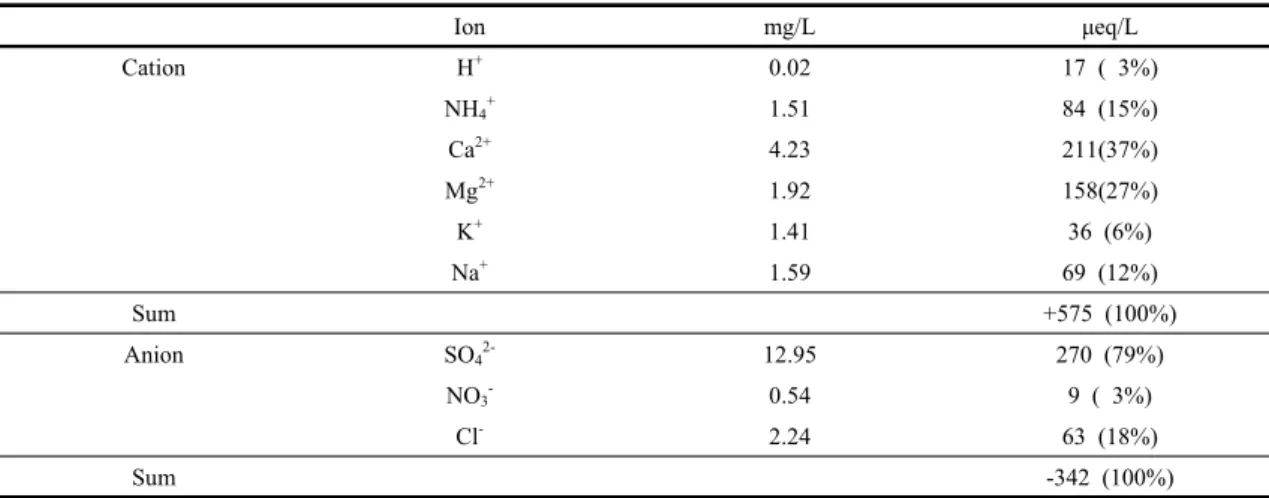
The volume-weighted mean concentration of positive ions in 2015 was 211 (37%), 158 (27%), 84 (15%), 69 (12%), 36 (6%), and 17 (3%) µeq·L-1 for Ca2+, Mg2+, NH4+, Na+, K+, and H+, respectively, where Ca2+ and Mg2+ accounted for a total of 64% of positive ions. The volume-weighted
mean concentration of the negative ions SO42-, Cl-, and NO3- was 270 (79%), 63 (18%), and 9 (3%) µeq·L-1, respectively. The concentrations of both positive and negative ions followed the order SO42-> Ca2+ > Cl- > Mg2+ > Na+ > NH4+ > K+ >
NO3- > H+. Positive ion concentrations followed the order Ca2+ > Mg2+ > Na+ > NH4+ > K+ > H+, and negative ion concentrations followed the order SO42- > Cl- > NO3- (Table 1).
The volume-weighted mean concentrations of the nine ions in precipitation revealed correlations between Ca2+ and Mg2+, NH4+ and SO42-, K+ and SO42-, and NH4+ and Cl- (P < 0.01), as well as between H+ and Mg2+, NH4+ and K+, Mg2+and Na+, SO42- and NO3-, Ca2+, Mg2+ and Cl- (P < 0.05).
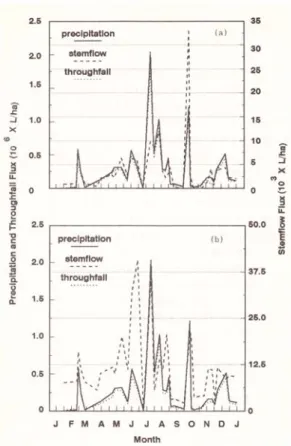
3.1.2. Forest precipitation ion contents Annual stemflow at the Pinus densiflora and Quercus mongolica stand was 145×103 L/ha and 430×103 L/ha (Fig. 3). Pinus densiflora stemflow transported 0.042 kg·ha-1·yr-1 of H+, 21.518 kg·ha-1·yr-1 of NH4+, 52.207 kg·ha-1·yr-1 of Ca2+, 27.694 kg·ha-1·yr-1 of Mg2+, 20.060 kg·ha-1·yr-1 of K+, 24.049 kg·ha-1·yr-1 of Na+, 153.79 kg·ha-1·yr-1 of SO42-, 10.241 kg·ha-1·yr-1 of NO3-, and 37.229 kg·ha-1·yr-1 of Cl- (Table 2). The total annual inflow of positive ions followed the order Ca2+ > Mg2+ > NH4+ > Na+ > K+ >
Ion mg/L μeq/L
Cation H+ 0.02 17 ( 3%)
NH4+ 1.51 84 (15%)
Ca2+ 4.23 211(37%)
Mg2+ 1.92 158(27%)
K+ 1.41 36 (6%)
Na+ 1.59 69 (12%)
Sum +575 (100%)
Anion SO42- 12.95 270 (79%)
NO3- 0.54 9 ( 3%)
Cl- 2.24 63 (18%)
Sum -342 (100%)
Table 1. Volume-weighted mean concentrations of ions in precipitation from September 1, 2015 to August 31, 2016
H+ and that of negative ions followed the order SO42- >
Cl- > NO3-.
Fig. 3. Precipitation, throughfall and stemflow flux in Pinus densiflora stand (a) and Quercus mongolica stand (b).
Based on the volume-weighted mean concentration of ions in P. densiflora stemflow, SO42- had the highest concentration (110.9 mg·L-1) and H+ had the lowest concentration (0.09 mg·L-1). Overall, the concentrations of ions followed the order SO42- > Ca2+
> Cl- > Mg2+ > NH4+ > Na+ > K+ > NO3- > H+. The highest and lowest maximum volume-weighted mean concentrations were observed for SO42- (321.34 mg·L-1) and H+ (0.3 mg·L-1), respectively. The maximum values followed the order SO42- > Cl- > Ca+
> Mg2+ > NH4+ > K+ > Na+ > NO3- > H+, while the minimum values followed the order SO42- > Ca2+ > Na+
> K+ > NH4+ > Mg2+ > Cl- > NO3- > H+. The greatest difference between the minimum and maximum was observed for SO42- (313.79 mg·L-1), while H+ had the least difference (0.29 mg·L-1).
Quercus mongolica stemflow transported 0.03 kg·ha-1·yr-1 of H+, 15.07 kg·ha-1·yr-1 of NH4+, 42.83 kg·ha-1·yr-1 of Ca2+, 21.22 kg·ha-1·yr-1 of Mg2+, 20.29 kg·ha-1·yr-1 of K+, 20.24 kg·ha-1·yr-1 of Na+, 119.13 kg·ha-1·yr-1 of SO42-, 5.65 kg·ha-1·yr-1 of NO3-, and 24.29 kg·ha-1·yr-1 of Cl- (Table 3). The total inflow of positive ions followed the order K+ > Ca2+ > Mg2+ >
Na+ > NH4+ > H+ and that of negative ions followed the order SO42 > Cl- > NO3-.
The maximum and minimum volume-weighted mean concentrations of ions in Q. Mongolica stemflow were observed for SO42- (36.78 mg·L-1) and H+ (0.02 mg·L-1), respectively. Overall, the volume-weighted mean concentration of ions followed the order SO42- >
K+ > Mg2+ > Cl- > Ca+ > Na+ > NH4+ > NO3- > H+. The highest and lowest maximum volume-weighted mean concentrations were observed for SO42- (126.91 mg·L-1) and H+ (0.13 mg·L-1), respectively. Overall, the maximum volume-weighted mean concentration followed the order SO42- > K+ > Cl- > Mg2+ > Ca2+ >
NH4+ > Na+ > NO3- > H+ and the minimum volume-weighted mean concentration followed the order K+ > SO42- > Na+ > Ca2+ = Cl- > NH4+ > NO3- >
Mg2+ > H+. The greatest difference between the minimum and maximum was observed for SO42-
(125.58 mg·L-1), while H+ had the least difference (0.13 mg·L-1).
The total inflow of H+ via stemflow was nearly the same for P. densiflora and Q. mongolica. For Q.
mongolica, the total inflows of SO42- (4.406 kg·ha-1·yr-1), NO3- (0.158 kg·ha-1·yr-1), Ca2+ (0.777 kg·ha-1·yr-1), Mg2+ (1.373 kg·ha-1·yr-1), K+ (2.465 kg·ha-1·yr-1), and Na+ (0.747 kg·ha-1·yr-1) were greater than those for P. densiflora. For P. densiflora, the total inflows of NH4+ (0.1 kg·ha-1·yr-1) and Cl- (0.898 kg·ha-1·yr-1) were greater than those for Q. mongolica
(Tables 2, 3). In both P. densiflora and Q. mongolica, SO42- had the maximum inflow and H+ had the minimum.
The volume-weighted mean concentration of SO42-
in P. densiflora stemflow was 110.94 mg·L-1, and that in Q. mongolica stemflow was 36.78 mg·L-1, about three times lower than the concentration in P.
densiflora stemflow. The volume-weighted mean concentrations of NO3-, NH4+, Ca2+, Mg2+, Na+, Cl-, and H+ were 2.12, 4.25, 3.37, 1.88, 1.91, 2.59, and 3.91 times higher in P. densiflora stemflow than in Q.
mongolica, respectively. Meanwhile, that of K+ was 1.61 times higher in Q. mongolica stemflow than in P.
densiflora.
Annual throughfall at the Pinus densiflora and Quercus mongolica stand was 9,587×103 L/ha and 9,687×103 L/ha (Fig. 3). Pinus densiflora throughfall transported 0.008 kg·ha-1·yr-1 of H+, 0.784 kg·ha-1·yr-1 of NH4+,1.652 kg·ha-1·yr-1 of Ca2+, 1.044 kg·ha-1·yr-1 of Mg2+, 0.476 kg·ha-1·yr-1 of K+, 0.651 kg·ha-1yr-1 of Na+, 9.098 kg·ha-1yr-1 of SO42-, 0.278 kg·ha-1yr-1 of NO3-, and 1.509 kg·ha-1·yr-1 of Cl- (Table 2). The inflow of ions followed the order SO42- > Ca2+ > Cl- >
Mg2+ > Na+ > NH4+ > K+ > NO3- > H+.
Quercus mongolica throughfall contained 0.008 kg·ha-1·yr-1 of H+, 0.684 kg·ha-1·yr-1 of NH4+, 2.429 kg·ha-1·yr-1 of Ca2+, 2.417 kg·ha-1·yr-1 of Mg2+, 2.941
kg·ha-1·yr-1 of K+, 1.398 kg·ha-1·yr-1 of Na+, 13.504 kg·ha-1·yr-1 of SO42-, 0.436 kg·ha-1·yr-1 of NO3-, and 2.407 kg·ha-1·yr-1 of Cl- (Table 3). The ion inflows followed the order SO42- > Ca2+ > Cl- > Mg2+ > K+ >
Na+ > NH4+ > NO3- > H+ (Table 3).
The sums of the ions inflowing via stemflow and throughfall differed significantly between Q.
mongolica and P. densiflora (P < 0.05; Tables 2, 3).
With the exception of K+, all ion inflows were higher in P. densiflora than in Q. mongolica. Ion inflows via throughfall divided by the inflow from rainfall (i.e., the enrichment ratio) revealed that NO3- had the highest enrichment ratio (1.89) and H+ had the lowest (0.25) in P. densiflora (Tables 2, 3). The enrichment ratios of the other ions followed the order Cl- > Na+ > Mg2+ > K+
> NH4+ > Ca2+ > SO42- (Fig, 4). In Q. mongolica, K+ had the highest enrichment ratio (1.44) and H+ the lowest (0.19), while the other ions followed the order Na+ > Mg2+ > Cl- > NO3- > Ca2+ > NH4+ > SO42- (Fig, 4).
Comparison of the pH of rainfall and Q. mongolica and P. densiflora throughfall revealed that the pH of the rainwater increased from rainfall to throughfall.
For P. densiflora, when rainfall had a pH of 4.20 5.71, the pH of the rainwater increased in throughfall;
however, when the pH of rainfall was above 5.71, the pH of the rainwater decreased in throughfall. For Q.
mongolica, when the pH of rainfall 4.20 and 5.50, the
H+ NH4+ Ca2+ Mg2+ K+ Na+ SO4-2 NO3- Cl-
Precipitation 0.17 15.12 42.23 19.22 14.05 15.89 129.44 5.43 22.39
Stemflow 0.04 21.52 52.21 27.69 20.06 24.05 153.79 10.24 37.23
Throughfall 0.01 0.78 1.65 1.04 0.48 0.65 9.10 0.28 1.51
Table 2. Annual inputs (kg/ha/yr) of 9 major ions in precipitation, stemflow, and throughfall at Pinus densifolia stand
H+ NH4+ Ca2+ Mg2+ K+ Na+ SO4-2 NO3- Cl-
Precipitation 0.17 15.12 42.23 19.22 14.05 15.89 129.44 5.43 22.39
Stemflow 0.03 15.07 42.83 21.22 20.29 20.24 119.13 5.65 24.29
Throughfall 0.01 0.68 2.43 2.42 2.94 1.40 13.50 0.44 2.41
Table 3. Annual inputs (kg/ha/yr) of 9 major ions in precipitation, stemflow, and throughfall at Quercus mongolica stand
pH of the rainwater water typically increased in throughfall, and when the pH of rainfall was above 5.5, the pH of the rainwater decreased in throughfall.
Fig. 4. Enrichment ratio (the ratio of amount of ion input by throughfall to that by bulk precipitation) of 9 ions in Pinus densiflora stand and Quercus mongolica stand.
The correlation analysis of the volume-weighted mean ion concentrations in P. densiflora throughfall revealed the following correlations at a 1%
significance level: NH4+ and Mg2+; Ca2+ and Mg2+; K+ and H+; Ca2+ and K+; Mg2+ and K+; Na+ and H+; Na+ and Ca2+; Na+ and Mg2+; Na+ and K+; SO42- and H+, Ca2+, Mg2+, K+, and Na+; NO3- and Cl-, NO3-, and SO42-; and Cl- and Ca2+, Mg2+, K+, Na+, SO42-, NO3-. Additionally, the following correlations at the 5%
significance level were observed: Mg2+ and H+; and NH4+ and K+ Na+, and SO42-. The following correlations were identified in Q. mongolica throughfall at the 1% significance level: Ca2+ and H+ Mg2+, and SO42-; Mg2+ and K+, Na+, SO42-, NO3-, and Cl-; Na+ and H+; NH4+ and SO42-; SO42- and NO3-; SO42-
and Cl-; and NO3- and Cl-. Finally, the following correlations were identified in Q. mongolica throughfall at the 5% significance level: SO42- and H+; Ca2+ and NO3-; and Na+ and Cl-.
3.2. Net throughfall input and rainfall
The net throughfall (NTF) input of the nine analyzed ions was defined as the difference between the ions in rainfall (mg·m-2) and those in throughfall (mg·m-2), and was set as a dependent variable. Five variables (precipitation, rainfall duration, rainfall intensity, rainfall pH, and dry days before rainfall or precipitation period) were set as explanatory variables for the stepwise regression analysis, where the best-suited model was chosen based on the correlation coefficients (Table 4). H+ frequently had a negative NTF input due to absorption by P. densiflora (20/35 cases), and Q. mongolica (24/35 cases); thus, it was not included in the analysis. NH4+ was significantly correlated with pH and rainfall intensity in P.
densiflora and with dry days before rainfall or
Ion Pinus stand (RE; R) Quercus stand (RE; R)
NH4+ 12.97-1.91×pH-0.75×INT; 0.54** 0.06+0.01×PD; 0.62
Ca2+ 8.44-2.11×INT; 0.41* None
Mg2+ 9.86-0.23×pH-0.03PRE; 0.70** 2.21+0.02×PD-0.05×PRE; 0.64**
K+ 3.48-0.02×PRE; 0.28 6.83-3.40×INT; 0.50*
Na+ 2.60+0.02×PD-0.05×PRE; 0.71** 1.89-0.01×PRE; 0.45
SO42- 14.38+0.11×PD-0.61×PRE+7.90×INT; 0.72** -7.78+7.78×pH; 0.53
NO3- 3.24-0.03×PRE; 0.41 None
Cl- 3.30+0.03×PD; 0.48* 1.49-0.46×INT; 0.4
RE; regression equation, R; Square of coefficient of determination, PRE; amount of precipation(mm), INT; intensity of rainfall (mm/hr), PD; precedent dry period, * P < 0.05, ** P < 0.01.
Table 4. Result of stepwise regression between net throughfall flux of 9 ions and 5 environmental variables at Pinus stand and Quercus stand. All regressions were based on data from 10-29 rainfall events
precipitation period in Q. mongolica. Ca2+ was correlated with rainfall intensity in P. densiflora but was not significantly correlated in Q. mongolica. Mg2+
was significantly correlated with rainfall pH in P.
densiflora. In Q. mongolica, dry days before rainfall or precipitation period was correlated with precipitation.
K+ in P. densiflora was correlated with rainfall intensity in Q. mongolica. Na+ was correlated with dry days before rainfall or precipitation period and precipitation in P. densiflora and with precipitation in Q. mongolica. SO42- was correlated with dry days before rainfall or precipitation period, precipitation, and rainfall intensity in P. densiflora and with rainfall pH in Q. mongolica. NO3- was correlated with precipitation in P. densiflora but was not significantly correlated in Q. mongolica. Cl- was correlated with dry days before rainfall or precipitation period in P.
densiflora and with rainfall intensity in Q. mongolica.
In P. densiflora, NH4+ and Mg2+ were positively correlated with dry days before rainfall or precipitation period and negatively correlated with rainfall pH.
Moreover, the regression coefficient of NH4+ was 1.91, which was higher than that of Mg2+ (0.23). Mg2+, K+, Na+, SO42-, and NO3- were negatively correlated with the amount of precipitation, of which SO42- had the highest regression coefficient (0.61). In P. densiflora, NH4+ and Ca2+ were negatively correlated with rainfall intensity, where NH4+ had a lower regression coefficient than Ca2+ (0.75 vs. 2.11, respectively). In P.
densiflora, dry days before rainfall or precipitation
period and Na+, SO42-, and Cl- were positively correlated, where SO42- had the highest regression coefficient (0.11). In Q. mongolica, the net inflow amounts of NH4+ and Mg2+ via throughfall were positively correlated with dry days before rainfall or precipitation period, where the regression coefficient of Mg2+ was higher than that of NH4+ (0.02 vs. 0.01, respectively). Mg2+ and Na+ were negatively correlated with the amount of precipitation. SO42- and pH were positively correlated. Finally, K+ and Cl- and rainfall intensity were negatively correlated.
3.3. Influence of Quercus mongolica and Pinus densiflora on soil pH
The soil pH at various distances from the two tested P. densiflora trees ranged from 3.99 to 6.05. The soil pH at distances from the trunk of 0 30, 40 70, 80 110, and > 150 cm averaged 4.32, 4.30, 4.32, and 4.40, respectively. Although pH appeared to increase slightly with distance, the average pH showed no linear regression with distance (R = 0.06, n = 12).
The soil pH at various distances from the two tested Q. mongolica trees ranged from 4.42 to 5.84. The soil pH at distances from the trunk of 0 30, 40 70, 80 110, and > 130 cm averaged 4.81, 4.85, 4.96, and 4.86, respectively. The average pH increased with distance (R = 0.34, n = 13).
The average soil pH near Q. mongolica and P.
densiflora trees was 4.32 and 4.88, respectively. Based on a two-way ANOVA of the pH of the two Q.
Source Soil pH ratio
Direction 1 Direction 2
Species ** **
Distance n. s. n. s.
Direction 1 indicates the direction connected to soil which vertical groove of stem reached. Direction 2 indicates the direction perpendicular to direction 1. Ratio means soil pH of direction 1 or 2 to that of peripheral area.
**: P < 0.01, n. s.: not significant
Table 5. Results of two-way analysis of variance for soil pH ratio along distance at intervals of 10 cm from a stem of Pinus densiflora and Quercus mongolica
mongolica and P. densiflora individuals by distance and species (the species differed in terms of soil and location, so the pH of the soil from these locations was divided by the pH of the soil collected at the farthest distance from the trees), soil pH was not associated with distance (P > 0.01), although there was a significant difference between the two species (P <
0.01, Table 5). Based on Tukey’s studentized range test of the pH by direction from the trees that exhibited differences between species, the soil pH of Q.
mongolica was higher than that of P. densiflora.
However, neither Q. mongolica nor P. densiflora had differences in soil pH in both directions (P > 0.01).
4. Discussion
4.1. Precipitation, stemflow, throughfall, and interception loss change
Although fog and frost contributed to indirect precipitation during the study period, they were not considered in this study, and only direct precipitation was measured. Precipitation was concentrated in June, July, August, and September, consistent with the summer and fall rainy season in Korea. Ice inhibited the measurement of stemflow and throughfall in January and February, so the data for these months were averaged, and unintercepted precipitation was measured after ice melted. Precipitation likely differed somewhat due to the distance between the study sites (640 m). Moreover, precipitation type can differ significantly by location. Because plants, terrain, and wind could have introduced experimental errors when measuring forest precipitation, measurements were taken on the roof of the biodiversity institute 500 m from the P. densiflora site and 850 m from the Q.
mongolica site.
Stemflow volume is influenced by tree size, branch angle, presence/absence of sempervirent leaves, tree smoothness, season, and precipitation amount (Falkengren-Grerup, 1989), as well as precipitation
duration, rainfall intensity, and tree density (Esser and Overdieck, 1991). Additionally, individual trees have unique branching patterns (Choi, 1984), and the angle between the main branch and twigs has been shown to affect stemflow in Quercus petraea and Quercus cerris (Jakucs, 1985). Regression analysis of Q. mongolica and P. densiflora stemflow with the cross-section at the upper trunk, DBH, cover, and tree height revealed that the cross-section at the upper trunk and stemflow followed a linear relationship. The proportion of stemflow to total precipitation in P. densiflora and Q.
mongolica was 0.013 and 0.039, respectively. The higher proportion in Q. mongolica can be explained by the fact that the angles between the main branch and twigs in Q. mongolica are between 45° and 90°, which are greater than those of P. densiflora. Moreover, its bark is smooth and has vertical gaps, which act as waterways when precipitation exceeds the storage capacity, whereas P. densiflora has rough bark and no vertical gaps. Although the proportion of water from stemflow was lower than that of unintercepted precipitation, it has a major effect on the inflow of nutrients and water in soil (Parker, 1983). The gradients of the linear regressions of stemflow and rainfall were the same at all locations (within 0.01), so the rate of increase for stemflow was the same as the increase in rainfall. Meanwhile, the y-intercept was higher in Q. mongolica, indicating that the amount of stemflow was greater in Q. mongolica than in P.
densiflora. For example, when rainfall was 0.46 mm, only stemflow occurred for P. densiflora trees with a diameter at the upper trunk lower than 11.46 cm, suggesting that P. densiflora intercepted all precipitation below 0.46 mm. In previous studies, no stemflow was measured when precipitation was below 2.2 or 11 mm, possibly due to the difference in the diameter at the upper trunk (Pathak et al., 1985; Kim and Woo, 1988). In this study, there were no instances when the measured Q. mongolica stemflow was zero, likely because rainfall events less than 16 mm were