◎ 논 문
ISSN (Print): 1226-9883
Air Layer Effect on the Performance Improvement of a Cross-Flow Hydro Turbine
Young-Do Choi * , Byeong-Rog Shin ** , Young-Ho Lee ***
Key Words : Cross-flow turbine, Small hydropower, Performance improvement, Internal Flow, Air layer effect ABSTRACT
The purpose of this study is not only to investigate the effects of air layer in the turbine chamber on the performance and internal flow of the cross-flow turbine, but also to suggest a newly developed air supply method. Field test is performed in order to measure the output power of the turbine by a new air supply method. CFD analysis on the performance and internal flow of the turbine is conducted by an unsteady state calculation using a two-phase flow model in order to embody the air layer effect on the turbine performance effectively. The result shows that air layer effect on the performance of the turbine is considerable. The air layer located in the turbine runner passage plays the role of preventing a shock loss at the runner axis and suppressing a recirculation flow in the runner. The location of air suction hole on the chamber wall is very important factor for the performance improvement. Moreover, the ratio between air from suction pipe and water from turbine inlet is also significant factor of the turbine performance.
†
1. Introduction
Recently, small hydropower attracts attention because of its clean, renewable and abundant energy resources to develop. However, suitable turbine type is not determined yet in the range of small hydropower and it is necessary to study for the effective turbine type.
Moreover, relatively high manufacturing cost by the complex structure of the turbine is the highest barrier for developing the small hydropower turbine. Therefore, a cross-flow turbine is adopted because of its simple structure and high possibility of applying to small hydropower.
Almost previous studies for the cross-flow turbine have been conducted to determine the optimum configuration of the turbine by experimental and numerical methods [1-10].
However, air layer effect on the turbine performance is not yet clear even thought the air layer is known for its
* Mokpo National University
** Changwon National University
*** Korea Maritime University (Corresponding Author)
† 교신저자, E-mail : [email protected]
effectiveness on the suppression of shock loss at the runner axis.
Therefore, the purpose of this study is not only to investigate the effects of air layer in the turbine chamber on the performance and internal flow of the cross-flow turbine, but also to suggest a newly developed air supply method. Experiments are performed in order to measure the output power of the turbine by the new air supply method. CFD analysis on the performance and internal flow of the turbine is conducted by an unsteady state calculation using a two-phase flow model in order to embody the air layer effect on the turbine performance effectively.
2. Experimental and Numerical Methods
2.1 Cross-flow hydro turbine for field test
Figure 1 shows a cross-flow hydro turbine for field
test. The turbine is installed and operated at the
Wakada hydropower plant in Japan for commercial
production of electric power. Effective head, rotational
speed and flow rate of the turbine at the designed
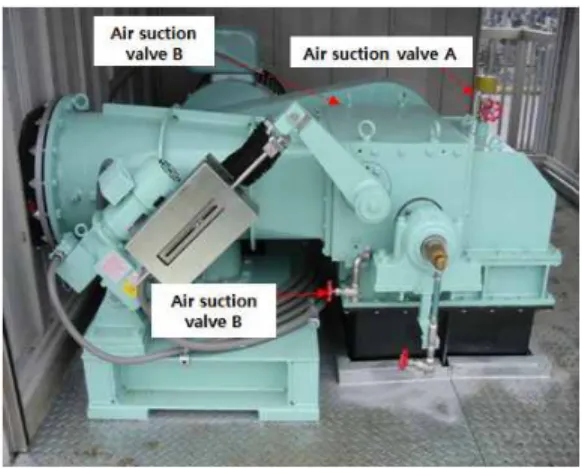
Fig. 1 Cross-flow hydro turbine for field test
Fig. 2 Schematic view of test cross-flow turbine and division of runner flow passage
Air suction flow rate
(L/min) Output Power
(kW) Vertical water level in draft tube (m)
250 69 0.86
360 70 0.77
370 71 0.75
380 72 0.74
390 72 0.73
400 73 0.72
Table 1 Variation of output power by air suction flow rate at valve B
Division Exp. CFD
Case 1 Case 2 Case 3 Working fluid Water &air Water &
air Water &
air Water &
air Number of air
suction hole 1
(A) 1
(A) 2
(A) & (B) 2 (A) & (B) Air flow rate
(
Qa
/Qw
) 0.032(A) 0.032
(A) 0.032(A)
0.006(B) 0.032(A) 0.032(B) Table 2 Test cases by experiemnt and CFD analysis
point are determined at 20m, 530min
-1and 0.516m
3/s,
respectively.
The test turbine has three air suction valves, valve A installed at the upper casing wall which is normal case for air suction in the turbine and valve B installed at the both casing side walls, as shown in Fig. 1. The air suction method using valve B is newly suggested in this study in order to prevent shock loss at the runner axis, as well as to suppress recirculation flow in the runner by forming air layer in the runner passage.
In order to investigate the effectiveness of the new air suction method using valve B, field test is performed by fixing water flow rate at the turbine inlet and air suction flow rate at the valve A at the designed point. Table 1 shows the test result by the variation of air suction flow rate at the valve B.
As the air suction flow rate at the valve B increases, output power of the test turbine increases as well, considerably. However, vertical water level in draft tube, which is measured from draft tube outlet to water level in the turbine chamber, decreases gradually by the increase of the air suction flow rate.
From the test result, it is obvious that the air suction flow rate passing through the valve B plays considerable role of improving the turbine performance.
Therefore, in this study, the effectiveness of the air suction flow rate at the valve B on the turbine performance is examined using the results of numerical analysis on the performance and internal flow of the test turbine model.
2.2 Test turbine model for numerical analysis
2.2.1 Dimensions of test turbine model
Figure 2 shows the schematic view of test turbine
model which is used for CFD analysis in this study. As
shown in Fig. 2, the inlet pipe and the nozzle are
horizontally installed and the draft tube is vertically
set up. The number of runner blades is 30, and the
inlet and outlet angles of the blade [10], if the angles
are measured at the Stage 1, are 30 and 87 degrees,
respectively. The widths of nozzle, runner and runner
chamber are all same, b=500mm. Guide vane angle for
experiment and CFD analysis is fixed to 22degree. The
guide vane angles of 0 and 25degree means closed and
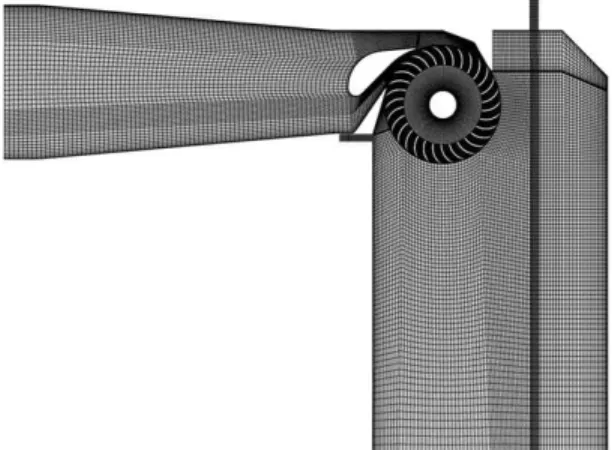
Fig. 3 Numerical grids of cross-flow hydro turbine model geometry
completely open states, respectively.
As the main purpose of this study is to confirm the effect of air layers formed in the turbine runner and runner chamber on the performance and internal flow of the turbine, three kinds of CFD analysis case are adopted for the comparison with the experimental result from field test. Table 2 shows the detailed experimental and CFD analysis conditions.
As working fluids, water which is supplied from inlet pipe, and air which is supplied from air suction hole, are used. The supplied water flow rates(Qw) are all same in the experiment and CFD analysis but the air flow rates(Qa) are different by the cases.
In case of experiment, only one air suction hole A is open and the air flow rate is fixed. However, in case of CFD analysis, the number and location of air suction hole are determined differently. Specification of Case 1 is same as that of the experimental condition. Only one air suction hole A is open. Case 2 adopts two air suction holes A and B. One is installed on the upper casing wall and another is installed on the casing wall in the left side. Case 3 also adopts 2 air suction holes but the air flow rates supplied to the holes are different from those by Case 2. In case of Case 3, air flow rate at the air suction hole A is same as that by Case 2 but air flow rate supplied at the air suction hole B is fixed to over five times the flow rate of Case 2. The difference of the air flow rate in the air suction hole B between the Cases 2 and 3 is determined to examine the influence of the air flow rate in the air suction hole B on the turbine performance.
2.2.2 Numerical analysis method
For the numerical analysis of the performance and internal flow characteristics of the cross-flow turbine, a commercial CFD code of ANSYS-CFX [11] is adopted.
The grid number of about 2.6×10
5has been used as shown in Fig. 3. Fine hexahedral numerical grids are employed for the turbine passage at inlet pipe, nozzle, casing and runner to ensure relatively high accuracy of calculated results. Even though the geometry of the turbine passage is three-dimensional, the numerical grids are made in two-dimensional geometry in order to shorten the time of unsteady-state two-phase flow calculations by assuming the flow in the turbine passage is uniform to the direction of main stream,
which means no flow velocity in the direction to the runner depth.
In consideration of multi-phase flow calculation using inhomogeneous model [11] with water and air in the runner chamber when air is induced from the air suction hole, relatively dense grids are applied in the area as shown in Fig. 3. Moreover, for the test runner, it is also made of fine dense hexahedral grids. SST turbulence model, constant pressure at the inlet and averaged outflow at the outlet of the calculation domain are the used boundary conditions.
All the calculations for the test cases, with the variation of supplied air flow rate and the constant water flow rate, are conducted under the conditions of unsteady state calculation with consideration for the effect of gravity.
Water level in the draft tube from experiment changes by the supplied air flow rate as shown in Table 1. However, in order to check the change of water level under present unsteady state calculation condition, it takes very large amount of calculation time. Therefore, only initial water level in the draft tube is fixed to the same water level of 0.80m in all cases of CFD analysis.
3. Results and Discussion 3.1 Performance analysis
3.1.1 Performance curves and efficiency analysis
Figure 4 shows performance curves of the turbine by
experiment and CFD analysis. In case of experimental
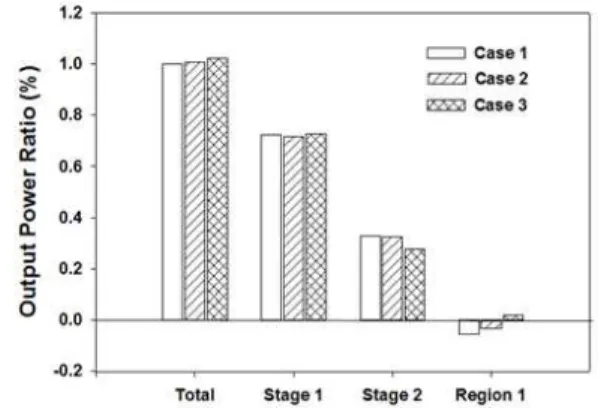
Fig. 5 Output power analysis for test cases
Division Air flow rate (
Qa
/Qw
) Efficiency ratio Suction hole A Suction hole BExperiment 0.032 - 1.000
CFD
Case 1 0.032 - 1.014
Case 2 0.032 0.006 1.021
Case 3 0.032 0.032 1.037
Table 3 Efficiency variation by suction air flow rate(
H
/Hbep
=1.0) Fig. 4 Performance curves of turbine modelDivision CFD
Case 1 Case 2 Case 3 Total output power ratio 1.000 1.007 1.022 Output power ratio at Stage 1 0.724 0.717 0.728 Output power ratio at Stage 2 0.330 0.324 0.276 Output power ratio at Region 1 -0.054 -0.034 0.018
Table 4 Analysis of output power
result, the head H is normalized by the head Hbep at
the best efficiency point as shown in the abscissa.
The ratios of efficiency and water flow rate at the ordinate are also normalized values by the efficiency and water flow rate at the best efficiency point. The efficiency by experiment is measured by changing the turbine inlet head, and the inlet water flow rate increases by the increase of the inlet head accordingly.
CFD analysis is conducted only at the best efficiency point and the suction air flow rate varies by the test cases in order to compare the effect of the air flow rate on the turbine performance.
The calculated result reveals that the efficiency by CFD analysis shows quite good agreement with that of experiment. Moreover, it is conjectured that the efficiency difference between the results by experiment and CFD analysis is caused by the difference of mechanical loss because the amount of mechanical loss predicted by CFD analysis is usually smaller than that by experiment. Moreover, water level difference in the draft tube by experiment and CFD analysis may be one more reason of the efficiency difference.
While, the turbine efficiency increases gradually by the increase of air flow rate at the suction hole B as
shown in Table 3. The tendency by numerical results for the efficiency shows good conformance with that of the test results for the output power in Table 1.
3.1.2 Output Power analysis
Figure 5 presents the divided local output powers at each stage and region of the runner blade by the three cases. It is clear that the area of Stage 1 produces almost 70% of local output power in the all test cases.
The local output power distributions of the test cases are almost similar to those by Mockmore et al. [1], Fiuzat et al. [7] and Choi et al. [10].
As the suction flow rate at the air suction hole B becomes increased in order of the Cases 1 to 3, the total output power increases accordingly. Moreover, according to the increase of the suction air flow rate from the air suction hole B, the local output power at the Region 1 changes from the negative value to the positive value as shown in Table 4. The negative output power at the Region 1 means the output power loss at the region by the shock loss and recirculation loss [10].
The result of output power analysis implies that the
increased suction air flow rate at the suction hole B
results in the improvement of total output power and
efficiency of the turbine. The increased
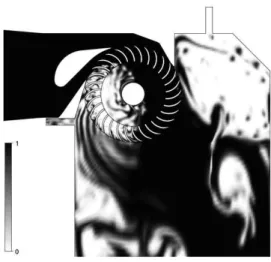
Fig. 6 Water-air two phase flow in the turbine model (Case 1, Volume of Fraction)
Fig. 7 Pressure contours in the flow field of turbine model (Case 1,
N
/N
bep=1.0,H
/H
bep=1.0)total output power is resulted from the effect of air layer by suppressing the hydraulic loss from recirculation flow and collision loss in the runner passage.
3.2 Internal flow analysis
3.2.1 Volume of fraction and pressure contours
In order to investigate the area occupied with air layer, volume of fraction (VOF) by suction air flow rate is examined using CFD analysis under the condition of water-air two-phase flow as shown in Fig. 6. The volume of fraction stands for the mixture ratio of water and air. The areas with black and white colors in the turbine passage mean the flow states of complete water and air, respectively.
The calculation results embody the turbine internal
flow field very well. Air layers locate in the runner passage and the turbine chamber.
In case of Case 1, even though there is only one air suction from valve A at the upper casing wall of the turbine chamber, there are two large air layers located below the valve A and in the runner passage to the right area of valve B in the turbine chamber. It is clear that the existence of air layer in the runner passage is caused by the lower static pressure in the region than atmospheric pressure.
As the runner rotates, the pressure in the runner passage becomes negative pressure, which is lower than atmospheric pressure and then, the air in the outside of the turbine enters into the turbine chamber naturally through the air suction hole A and the air layer occupies the runner passage. After water mixes with air in the runner passage, the mixture comes out from the runner outlet and flows down to the draft tube.
Figure 7 shows the static pressure contours within the turbine internal flow filed. Inlet pressure decreases along the nozzle passage but the pressure distribution at the nozzle outlet changes along the position of the nozzle outlet. Flow pressure passing through the passage of runner blades in the Stage 1 drops rapidly.
From this result, it is assumed that the fluid pressure passing through the passage of runner blade is taken by the runner blades and changes to output power. In addition, very low pressure region is located in the lower left region of the runner center, at which a large air layer is located as shown in Fig. 6.
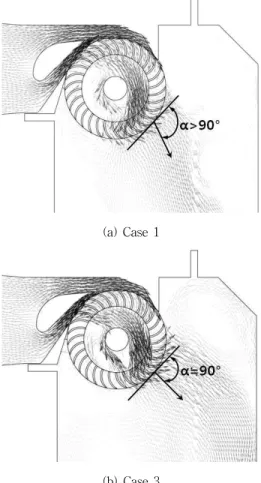
3.2.2 Velocity vectors by air suction flow rate at valve B
Figure 8 shows absolute velocity vectors in the inlet nozzle and turbine chamber, and relative velocity vectors in the runner passage. It is obvious that flow velocity becomes accelerated along the contracted nozzle passage and then, the fluid has high velocity just before runner blade inlet. After passing through the runner passage, cross-flow within the runner gains accelerated velocity once more and then the flow enters into the inlet of Stage 2.
The area occupied by the air layer in the lower left
side of the runner passage does not include
recirculation flow region which occurs in the case of
no air supply through the air suction hole [10].
Fig. 9 Passage averaged velocity distributions at Stage 1 by air suction flow rate of Cases 1 and 3 (b) Case 3
Fig. 8 Velocity vectors within the internal flow field (
H
/H
bep=1.0)(a) Case 1