ABSTRACT
BACKGROUND/OBJECTIVES: Although previous experimental studies reported the health benefits of foods rich in phytochemicals, few epidemiologic studies have investigated the associations between phytochemicals and metabolic disorders. This study aimed to calculate a phytochemical index (PI) and examine its association with metabolic syndrome in the Korean population.
SUBJECTS/METHODS: Data of Korean adults aged ≥ 19 years who participated in the 2008–2016 Korea National Health and Nutrition Examination Surveys were analyzed. The PI was calculated using 24-hour intake recall data regarding whole grains, vegetables, fruits, legumes, nuts and seeds, and soybeans and soy products. Demographic and lifestyle data were obtained using self-administered questionnaires. A multivariable logistic regression was performed to calculate the adjusted odds ratios (ORs) and 95% confidence intervals (CIs) for the prevalence of metabolic syndrome and its components according to PI quintiles.
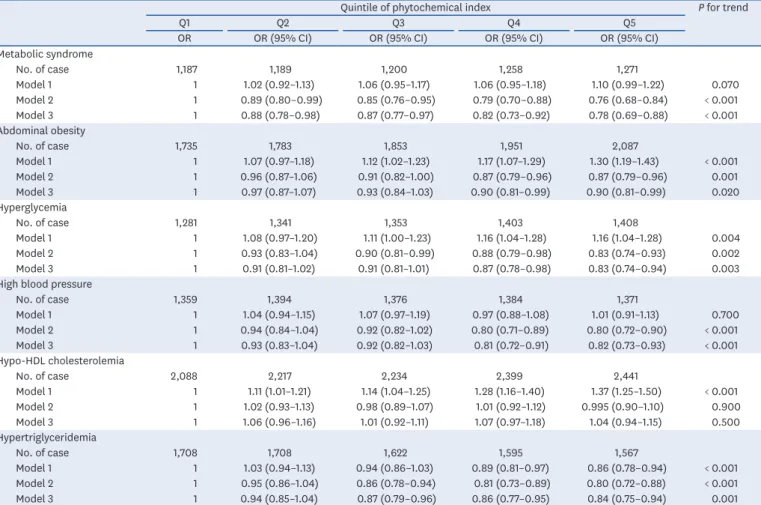
RESULTS: Overall, 31,319 adults were evaluated. Compared with men, women had a higher median PI level (9.96 vs. 13.63) and significantly higher caloric intake levels from most PI components (P < 0.05), except for soy products. After adjusting for multiple confounding variables, participants in the highest PI quintile had significantly lower prevalences of abdominal obesity (OR: 0.90, 95% CI: 0.81–0.99), hyperglycemia (OR: 0.83, 95% CI: 0.74–
0.94), high blood pressure (OR: 0.82, 95% CI: 0.73–0.93), hypertriglyceridemia (OR: 0.84, 95% CI: 0.75–0.94), and metabolic syndrome (OR: 0.78, 95% CI: 0.69–0.88).
CONCLUSIONS: Higher intakes of phytochemical-rich foods are associated with a lower prevalence of metabolic dysregulation and consequently, cardiometabolic diseases.
Keywords: Metabolic syndrome; phytochemicals; hyperglycemia; hypertension; Korea
INTRODUCTION
Phytochemicals are plant-derived substances with various known health benefits such as anti-inflammatory, antioxidant, and anticancer effects [1-5]. Previous epidemiologic studies of various populations have demonstrated that the consumption of phytochemical-rich foods can help prevent cardiovascular and metabolic diseases [6-10].
Original Research
Received: Sep 24, 2019 Revised: Dec 15, 2019 Accepted: Jan 30, 2020
§
Corresponding Author:
Kyong Park
Department of Food and Nutrition, Yeungnam University, 280 Daehak-ro, Gyeongsan 38541, Korea.
Tel. +82-53-810-2879 Fax. +82-53-810-4666 E-mail. [email protected]
©2020 The Korean Nutrition Society and the Korean Society of Community Nutrition This is an Open Access article distributed under the terms of the Creative Commons Attribution Non-Commercial License (https://
creativecommons.org/licenses/by-nc/4.0/) which permits unrestricted non-commercial use, distribution, and reproduction in any medium, provided the original work is properly cited.
ORCID iDs Minkyeong Kim
https://orcid.org/0000-0002-1474-7514 Kyong Park
https://orcid.org/0000-0002-4681-1584 Funding
This research was supported by the 2019 Yeungnam University Research Grant.
Conflict of Interest
The authors declare no potential conflicts of interests.
Minkyeong Kim and Kyong Park §
Department of Food & Nutrition, Yeungnam University, Gyeongsan 38541, Korea
Association between phytochemical
index and metabolic syndrome
Author Contributions
Conceptualization: Park K, Kim M; Data curation: Kim M; Formal analysis: Kim M;
Funding acquisition: Park K; Investigation:
Park K, Kim M; Methodology: Park K, Kim M;
Project administration: Park K; Resources:
Park K; Software: Kim M; Supervision: Park K; Validation: Park K; Visualization: Kim M;
Writing - original draft: Kim M; Writing - review
& editing: Park K
Recently, a new dietary index, the phytochemical index (PI), was developed to efficiently assess the health effects of phytochemical-rich food intakes in large population-based epidemiologic studies [7,8,11-15]. For example, the Tehran Lipid and Glucose Study calculated a PI based on the daily energy intake derived from phytochemical-rich foods and examined the cross-sectional associations of this index with metabolic risk factors [15-18]. In that study, participants with higher PI values reported a lower prevalence of abdominal obesity and hypertriglyceridemia [16]. Additionally, a recent case-control study of the association between PI and prediabetes reported that a higher PI is significantly associated with a lower risk of prediabetes [19].
There is a paucity of data on the association between the consumption of phytochemical-rich foods and metabolic disorders in the Korean population. To date, the majority of previous Korean studies have solely focused on the effects of specific foods or food groups such as fruits and vegetables [20-22]. Given the increasing prevalences of metabolic syndrome and type 2 diabetes in various Asian countries, including Korea, it is necessary to identify dietary factors that may prevent these diseases and understand their roles in human health.
Therefore, the present study aimed to establish a PI for a Korean population and analyze the association between PI and metabolic syndrome using data from the Korea National Health and Nutrition Survey (KNHANES).
SUBJECTS AND METHODS
Data source
The KNHANES is a nationwide cross-sectional health and nutrition survey of non- institutionalized residents of South Korea who are aged ≥ 1 year. All participants provided signed informed consent. Details of this survey have been reported elsewhere [23]. Briefly, survey sampling was conducted using a complex, stratified, multistage, and clustered method. Demographic, lifestyle, dietary, and health data were collected through a health interview, health examination, and nutritional survey. Initially, the KNHANES was first applied as a series of three surveys in 1998, 2001, and 2005. Since 2007, however, the KNHANES has been administered year-round to produce timeline data while excluding seasonal variations.
In this study, we attempted to include all available KNHANES data, including all key variables for the analysis. Regarding these key variables, physical activity questionnaires were not administered in 1998 and 2001, and some details were omitted in 2005. In addition, only 8% of participants responded in 2007. Therefore, this study only analyzed data from the KNHANES during 2008–2016.
The KNHANES was approved by the Institutional Review Board (IRB) of the Korea Centers for Disease Control and Prevention. This entity provided formal ethics approval for the KNHANES data sets (IRB numbers: 2008-04EXP-01-C, 2009-01CON-03-2C, 2010-02CON- 21-C, 2011-02CON-06-C, 2012-01EXP-01-2C, 2013-07CON-03-4C, and 2013-12EXP-03-5C).
Participants
Of the 76,909 people who participated in the KNHANES 2008–2016, we excluded the
following: (1) those younger than 19 years (n = 17,823); (2) those with missing sampling
weight information (n = 9,798); (3) pregnant or lactating women (n = 739); (4) those with
extremely low or high total daily energy intakes (< 500 or > 5,000 kcal; n = 835); (5) patients with known chronic diseases, including hypertension, diabetes, cardiovascular disease, and cancer (n = 14,411); and (6) those with missing data on metabolic biomarkers, including waist circumference (WC), fasting blood sugar, systolic/diastolic blood pressure, triglycerides, or high-density lipoprotein (HDL)-cholesterol levels (n = 1,984). Finally, our analysis included 31,319 participants.
Demographic information
Demographic and lifestyle data were obtained from the questionnaires. These data included age, sex, education level, household income level, job status, obesity status, family history of diabetes, smoking habits, drinking status, and physical activity level. The participants’
education levels were reclassified into two categories: lower than high school graduation and high school graduation or higher. The household income levels were categorized into four groups: low, mid-low, mid-high, and high. A positive family history of diabetes was defined as having at least one parent with diabetes. The smoking status was classified into 2 categories: smokers and non-smokers. The daily alcohol intake was calculated by multiplying the servings of alcohol consumed in one sitting by the frequency of consumption. The physical activity level was calculated in terms of metabolic equivalents of task (MET-hours per week) and categorized into tertiles [24].
PI
The PI was calculated using one day (24-hour) recall data collected by trained interviewers who visited participating households during the examination. The following formula was used to calculate the PI: daily energy intake derived from phytochemical-rich foods (kcal) ÷ total daily energy intake (kcal) × 100 [15]. The following food groups were included in the PI calculation: whole grains, vegetables, fruits, legumes, nuts and seeds, and soy products.
Fresh soybean products, including tofu, fried tofu, soybean paste, cheonggukjang, and natto, as well as extra virgin olive oil, which is rich in absorbable antioxidants were also included.
Considering the high consumption of seaweed among Koreans, we included seaweeds as well in our PI calculation. Generally, fresh fruit and vegetable juices are also included in the calculation. However, the majority of fruit and vegetable juice products consumed by this population are industrially canned or bottled products, which contain low amounts of phytochemicals [25-27]. Accordingly, these products were excluded from the PI calculation.
Some grain products with a whole grain content < 50%, potatoes, pickled vegetables (including kimchi), and powdered vegetable and soybean products were also excluded.
Anthropometry and metabolic biomarkers
The body mass index (BMI) was calculated by dividing the body weight (kg) by the square of the height (m
2). The BMI cut-off value from the World Health Organization criteria for Asian populations [28] was used to define the following categories: underweight/normal weight (<
23 kg/m
2), overweight (≥ 23 to < 25 kg/m
2), and obese (≥ 25 kg/m
2). WC was measured at the midpoint between the bottom of the least palpable rib and the top of the iliac crest using a stretch-resistant tape.
The participants were asked to fast for at least 8 hours before blood collection. Subsequently,
fasting blood samples were sent to a certified laboratory for analyses of the blood glucose,
triglyceride, and HDL-cholesterol levels. The laboratory analyses were performed using an
ADIVIA 1650 system (Tarrytown, NY, USA) in 2008 and the Hitachi Automatic Analyzer 7600
(Hitachi, Tokyo, Japan) during 2009–2016.
The systolic and diastolic blood pressure were measured twice on the right arm using a mercury sphygmomanometer (Baumanmeter
®Desk Model 0320; WA Baum, New York, NY, USA) while the participant was seated. Blood pressure levels were measured thrice, and the average values of the second and third measurements were included in the analysis.
Metabolic syndrome was defined according to the criteria of the modified National Cholesterol Education Program III for the Asian population [29]. Participants who met at least 3 of the following criteria were defined as having metabolic syndrome: (1) a WC ≥ 90 cm in men and ≥ 80 cm in women; (2) fasting glucose level ≥ 100 mg/dL or use of medication for diabetes (insulin or oral agents); (3) triglyceride level ≥ 150 mg/dL or use of lipid-lowering medication; (4) HDL-cholesterol level < 40 mg/dL in men and < 50 mg/dL in women; and (5) blood pressure level ≥ 130/85 mmHg or use of antihypertension medication.
Statistical analysis
Multistage, stratified, and clustered sampling methods were used in the analysis. The age- and total energy-adjusted mean values of daily calorie intakes of the components included in the PI calculation, namely whole grains, vegetables, fruits, legumes, soy products, nuts and seeds, seaweeds, and olive oil, were calculated using a multivariate regression model.
The participants were classified according to PI quintiles, and logistic regression models were used to calculate the odds ratios (ORs) and 95% confidence intervals (CIs) for the association between PI and the prevalence of metabolic syndrome. A preliminary analysis and literature review were conducted to identify potential confounding factors [16-18,30], and effect modifiers were tested using multiplicative terms in the models. Consequently, the following 3 covariate models were constructed: (1) model 1, unadjusted; (2) model 2, adjusted for age and sex; and (3) model 3, additionally adjusted for education, household income level, smoking status, drinking status, and physical activity level. All statistical analyses were performed using SAS software, version 9.4 (SAS Institute, Cary, NC, USA), and the statistical significance level was set at α = 0.05.
RESULTS
Intake levels of PI components
Table 1 shows the adjusted mean PI values and calorie intake levels from the food groups used to calculate the PI. The average PI value was higher in women than in men (16.49 ± 0.12 vs.
12.68 ± 0.11, P < 0.001). Moreover, the caloric intake levels of all PI components except for soy products were significantly higher in women than in men (P < 0.05).
General characteristics of participants according to PI score
Generally, higher PI scores were observed for women, elderly participants, individuals with a higher household income and/or lower education level, non-smokers, non-alcohol drinkers, and obese participants (all P < 0.01, Table 2). Participants with lower physical activity levels had a significantly lower PI (P = 0.004).
Metabolic biomarkers according to PI
Table 3 presents a multivariable-adjusted comparison of metabolic biomarker levels
according to the PI value. Notably, significant associations of the fasting blood glucose and
triglyceride levels and blood pressure (systolic and diastolic) levels with the PI score were
observed, and these relationships exhibited a dose-response pattern (P for trend < 0.05).
However, the WC and HDL-cholesterol levels did not differ significantly among PI quintiles (WC: P for trend = 0.1, HDL-C: P for trend = 0.5).
Table 1. PI and dietary intake levels of food components included in the PI calculation stratified by sex (KNHANES 2008–2016, n = 31,319)
Sex P value
Men Women
PI 12.68 ± 0.11 16.49 ± 0.12 < 0.001
Median 9.96 13.63
Caloric intake levels derived from food groups (kcal)
1)Whole grains 64.68 ± 1.43 75.94 ± 1.30 < 0.001
Vegetables 56.33 ± 0.50 59.17 ± 0.50 < 0.001
Fruits 57.97 ± 1.36 104.01 ± 1.98 < 0.001
Legumes 19.69 ± 0.49 21.22 ± 0.48 0.020
Soy products 33.57 ± 0.61 29.19 ± 0.53 < 0.001
Nuts and seeds 14.33 ± 0.53 17.91 ± 0.50 < 0.001
Seaweeds 1.81 ± 0.07 2.09 ± 0.07 0.001
Olive oil 0.74 ± 0.24 1.29 ± 0.25 < 0.001
Values are shown as means ± SE.
PI, phytochemical index; KNHANES, Korea National Health and Nutrition Examination Survey.
1)
Adjusted for age and total energy intake.
Table 2. General characteristics of the participants according to the PI quintiles (KNHANES 2008–2016, n = 31,319)
Quintile of PI P value
Q1 Q2 Q3 Q4 Q5
No. of participants 6,263 6,264 6,264 6,264 6,264
PI, median 3.23 7.40 12.04 18.23 30.82
Sex, men 3,143 (50.18) 2,924 (46.68) 2,582 (41.22) 2,195 (35.04) 1,717 (27.41) < 0.001
Age (yrs) < 0.001
19–29 1,654 (26.41) 1,111 (17.74) 917 (14.64) 695 (11.10) 517 (8.25)
30–39 1,794 (28.64) 1,803 (28.78) 1,522 (24.30) 1,260 (20.11) 991 (15.82)
40–49 1,223 (19.53) 1,520 (24.27) 1,505 (24.03) 1,547 (24.70) 1,387 (22.14)
50–59 688 (10.99) 889 (14.19) 1,136 (18.14) 1,350 (21.55) 1,720 (27.46)
≥ 60 904 (14.43) 941 (15.02) 1,184 (18.90) 1,412 (22.54) 1,649 (26.33)
Household income
2)< 0.001
Low 1,872 (30.26) 1,569 (25.33) 1,447 (23.32) 1,290 (20.79) 1,200 (19.32)
Mid-low 1,610 (26.02) 1,586 (25.61) 1,544 (24.88) 1,540 (24.82) 1,452 (23.38)
Mid-high 1,468 (23.73) 1,571 (25.36) 1,591 (25.64) 1,641 (26.45) 1,653 (26.61)
High 1,237 (19.99) 1,468 (23.70) 1,623 (26.16) 1,733 (27.93) 1,906 (30.69)
Education level
2)< 0.001
Less than high school graduation 1,336 (22.29) 1,397 (23.19) 1,565 (26.07) 1,684 (28.10) 1,804 (30.16) High school graduation or higher 4,658 (77.71) 4,628 (76.81) 4,439 (73.93) 4,309 (71.90) 4,178 (69.84)
Smoking status
2)< 0.001
Non-smoker 3,062 (50.32) 3,392 (55.59) 3,755 (61.70) 4,151 (68.17) 4,612 (75.68)
Smoker 3,023 (49.68) 2,710 (44.41) 2,331 (38.30) 1,938 (31.83) 1,482 (24.32)
Alcohol consumption (yes)
2)5,026 (82.79) 4,991 (81.91) 4,712 (77.56) 4,458 (73.33) 4,146 (68.12) < 0.001
Obesity status
2)0.008
Underweight/normal 3,192 (51.04) 3,046 (48.69) 3,141 (50.19) 3,095 (49.45) 3,010 (48.08)
Overweight/obese 3,062 (48.96) 3,210 (51.31) 3,117 (49.81) 3,164 (50.55) 3,250 (51.92)
Physical activity
1,2)< 0.001
Low 2,112 (35.21) 2,018 (33.48) 2,049 (34.08) 1,982 (33.06) 1,841 (30.76)
Middle 1,899 (31.66) 2,002 (33.21) 1,987 (33.05) 2,022 (33.72) 2,141 (35.77)
High 1,988 (33.14) 2,008 (33.31) 1,977 (32.88) 1,992 (33.22) 2,003 (33.47)
Values are presented as number of patients (%).
PI, phytochemical index; KNHANES, Korea National Health and Nutrition Examination Survey; Q, quintile.
1)
Physical activity level was calculated as metabolic equivalents of task (MET-hours per week) and grouped into tertiles.
2)
These categories had missing data, and the total n values are not identical.
Table 4 presents the ORs for abdominal obesity, hyperglycemia, high blood pressure, hypo-HDL cholesterolemia, hyperglyceridemia, and metabolic syndrome according to the PI quintiles. The age- and sex-adjusted models revealed inverse correlations of the PI quintile with the prevalence of abdominal obesity (P for trend < 0.001), hyperglycemia (P for trend = 0.002), high blood pressure (P for trend < 0.001), hypertriglyceridemia (P for trend < 0.001), and metabolic syndrome (P for trend < 0.001). These inverse linear trends remained statistically significant after adjusting for the additional confounding factors in model 3. Compared with the lowest PI quintile in model 3, participants in the highest (fifth) PI quintile were less likely to present with abdominal obesity (OR: 0.90, 95% CI: 0.81–0.99), Table 3. Adjusted average levels of metabolic biomarkers according to the dietary PI quintiles (n = 31,319)
Metabolic syndrome components
1)Quintile of PI P for trend
Q1 Q2 Q3 Q4 Q5
Waist circumstance (cm) 80.91 ± 0.17 80.76 ± 0.17 80.69 ± 0.17 80.44 ± 0.17 80.62 ± 0.16 0.100
Fasting blood glucose (mg/dL) 94.66 ± 0.27 94.46 ± 0.25 94.47 ± 0.25 93.94 ± 0.26 93.90 ± 0.28 0.020 Triglycerides (mg/dL) 138.14 ± 1.83 135.93 ± 1.94 133.64 ± 1.88 129.56 ± 1.79 126.57 ± 1.57 < 0.001
HDL-cholesterol (mg/dL) 49.58 ± 0.20 49.20 ± 0.20 49.22 ± 0.20 49.18 ± 0.20 49.32 ± 0.21 0.500
Systolic blood pressure (mmHg) 116.39 ± 0.23 115.68 ± 0.24 115.48 ± 0.24 115.10 ± 0.24 115.06 ± 0.25 < 0.001 Diastolic blood pressure (mmHg) 75.44 ± 0.17 75.05 ± 0.17 74.97 ± 0.18 74.57 ± 0.17 74.84 ± 0.17 0.003 PI, phytochemical index; Q, quintile; HDL, high-density lipoprotein.
1)