pISSN 1976-1457 eISSN 2005-6168
Effect of onion peel extract supplementation on the lipid profile and antioxidative status of healthy young women: a randomized, placebo-controlled, double-blind, crossover trial
Jungmi Kim
1, Yong-Jun Cha
2, Kyung-Hea Lee
2and Eunju Park
1§1
Department of Food and Nutrition, Kyungnam University, 449 Woryeong-dong, Masanhappo-gu, Changwon-si, Gyeongnam 631-701, Korea
2
Department Food and Nutrition, Changwon National University, Changwon, Gyeongnam 641-773, Korea
Abstract
The consumption of fruits and vegetables that have high polyphenol content has been previously associated with a reduced risk for cardiovascular disease. We investigated the effects of onion peel extract on plasma total antioxidant capacity, lipid peroxidation, and leukocyte DNA damage.
This study was a randomized, double-blind, placebo-controlled, crossover trial. Healthy female subjects received either onion peel extract or placebo (dextrin) for two weeks, underwent a 1-week washout period, and then received the other treatment for an additional two weeks. After two weeks of onion peel extract supplementation, the total cholesterol level, low-density lipoprotein cholesterol level, and atherogenic index significantly decreased (P < 0.05). No changes were observed in activities of erythrocyte antioxidant enzymes or levels of lipid peroxidation markers following onion peel extract supplementation. Additionally, no significant difference was found in plasma antioxidant vitamin (retinol, tocopherols, carotenoids, and coenzyme Q10) levels or ex vivo H2O2-provoked oxidative DNA damage after onion peel extract supplementation. The present interventional study provides evidence of the health benefits of onion peel extract and demonstrates its effects in modulating lipid profiles in healthy young Korean women.
Key Words: Onion peel extract, lipid profile, antioxidant status, DNA damage, healthy young women
Introduction
5)Elevated triglyceride (TG), total cholesterol (TC), and low- density lipoprotein cholesterol (LDL-cholesterol) concentrations are well-known risk factors for cardiovascular disease [1] in addition to oxidative stress, which is a key risk factor for cardiovascular disease [2]. Dietary habits characterized by relatively high intake of fruits and vegetables are consistently associated with reduced incidence of cardiovascular disease [3].
The underlying mechanisms for this protection include free- radical scavenging (antioxidative capacity) [4], metal-ion chelation [5], and induction of phase II detoxification enzymes [6]. In addition, the regenerating function of other antioxidants such as α -tocopherol, which acts by donating a hydrogen atom to a tocopheryl radical, may also explain the suggested anti-cardiovascular disease potential of fruits and vegetables [7].
Of particular importance is quercetin, a major dietary flavonoid found in onions and other vegetables. Through in vitro cell models, quercetin has been shown to have antioxidant activity related to a strong scavenging capacity [8,9]. In an earlier study, we also confirmed that onion peel extract, which is rich in
quercetin, possesses antigenotoxicity and antioxidant capacity and is capable of modulation of detoxification- and antioxidant- related gene expression in cellular and non-cellular systems.
Subsequently, we designed a randomized, double-blind, placebo- controlled parallel study to assess the antioxidative and anti- inflammatory properties of onion peel extract in middle-aged Korean male smokers (unpublished data of the author). From this previous intervention study, we demonstrated that the daily consumption of onion peel extract for 10 weeks reduces cardio- vascular disease risk by improving the lipid profile, blood coagulation parameters, and antioxidant systems in healthy male smokers. However, thus far, the effects of onion peel extract in healthy young women have not been studied. Since free radicals are formed not only in pathological but also in physiological processes in mammalian, oxidative stress is inevitable for healthy young women. Therefore, identifying the effects of onion peel extract supplementation on antioxidative status in healthy young women is considered as another interesting approach. We designed a randomized, placebo-controlled, double-blind, crossover study. The aim of the present study was to assess the effects of onion peel extract in healthy young women, by evaluating
This work has been supported by Changnyeong Onion and Soy Products Industry Promotion Program of the Korean Ministry of Commerce, Industry, and Energy.
§Corresponding Author: Eunju Park, Tel. 82-55-249-2218, Fax. 82-505-999-2139, Email. [email protected] Received: August 6, 2012, Revised: March 14, 2013, Accepted: June 4, 2013
ⓒ2013 The Korean Nutrition Society and the Korean Society of Community Nutrition
This is an Open Access article distributed under the terms of the Creative Commons Attribution Non-Commercial License (http://creativecommons.org/licenses/by-nc/3.0/) which permits unrestricted non-commercial use, distribution, and reproduction in any medium, provided the original work is properly cited.
the antioxidant statuses as well as lipid profiles of the subjects.
Thus, erythrocyte antioxidant enzyme activity, plasma total antioxidant capacity, lipid peroxidation, plasma antioxidant vitamin levels, and leukocyte DNA damage were measured before and after 2 weeks of daily intake of onion peel extract capsules.
Subjects and Methods
Preparation for capsule
To prepare the quercetin-rich supplementation capsules, yellow onion peels purchased from Nonghyup located in Changnyeong, were washed three times in tap water and extracted with a 60%
aqueous ethanol solution (50℃, 3 h) in a extractor (1 kL, Hansung F&C Co., Ltd., Seoul, Korea). The extracts were filtered with a filter press (Hankook Industry Co. Ltd., Seoul, Korea), the filtrates were concentrated to 2.4° Brix in a vacuum concentrator (1 kL, Hansung F&C Co.), and then the concentrates were processed to powder with a freeze dryer (SFDTS-200 kg Samwon Industry Co., Ltd. Seoul, Korea). Finally, the powder was adjusted to contain 100 mg quercetin/g dextrin (Samyang Co., Seoul, Korea). Capsules containing of only dextrin were used for placebo group.
Total flavonoids and quercetin content determination
Total soluble flavonoid of the extract was determined with aluminium nitrate using quercetin as a standard [10]. A 0.1 g sample (OPE) was mixed with 40 mL of 90% ethanol and centrifuged at 3,000 rpm for 10 min. 100 mL of solution obtained by extracting the residue with 80 % ethanol was diluted 10 times.
An aliquot of 0.5 ml was added to test tubes containing 0.1 mL of 10 % aluminium nitrate, 0.1 mL of 1 M potassium acetate, 1.5 mL of 80 % ethanol, and 2.8 mL water. The absorbance of the supernatant was measured at 415 nm after 40 min at room temperature. Total flavonoid concentration was calculated using quercetin as standard. Quercetin measurements were done using high-performance liquid chromatography (HPLC) determination as previously described [11]. In brief, the hydrolysis of all glycosides to quercetin aglycone, followed by HPLC determi- nation from samples, was analyzed. A 0.1 g sample (OPE) was mixed with 40 mL of 60% aqueous ethanol and 5 mL of 6 N HCl. After refluxing at 95℃ for 2 hours, the hydrolyzed solution was filtered into a 100 mL flask with 60% aqueous ethanol.
Approximately 10 mL of the solution filtered through a 0.45 μ m filter before injection for HPLC analysis. Quercetin in OPE was quantified using a Hewlett-Packard 1100 series HPLC system (Hewlett-Packard, Palo Alto, CA, USA) with a ZORBAX C18 column (150 × 4.6 mm, 5 μm, XDB-C18; Hewlett-Packard).
Elution was performed using a mobile phase made up of water-5% acetic acid-acetonitrile (40:30:30) at a flow rate of 1.0
mL/min. UV detector was measured at 370 nm, and the sample injection volume was 20 μL. Quantification was extrapolated from the pure quercetin (Sigma Chemical Co., St. Louis, MO) standard curve.
Subjects and study design
Twelve healthy normal-weight women, all university students, participated in a randomized, placebo-controlled, double-blinded crossover design. The inclusion criteria were healthy women in the age range of 20-25 years. All subjects were healthy, and those with documented type 2 diabetes mellitus, hypertension, thyroid disorders, malabsorption syndrome, or any type of coronary heart disease were excluded. Furthermore, subjects who were taking any medications known to influence the variables to be studied were excluded. The subjects were given written informed consent, and the institutional review board at Hannam University approved the study protocol (2008-05k). During the quercetin depletion period (day 7), all subjects were requested to restrict their consumption of quercetin to avoid any influence on the study results. These food ingredients included onions, apples, red wine, tea, biological and freshly pressed fruit juices, berries, grapes, cherries, raisins, parsley, broccoli, cabbage, beans, and tomatoes. Subsequently, the subject were randomized into two groups and administered either capsules of placebo or OPE per day capsules containing 100 mg quercetin and 128 mg other mixed flavonoids (composition unknown) in two 2-week study periods, separated by a 1-week washout peroid. The subjects were instructed to maintain their usual patterns of dietary intake during the study. Compliance was monitored through biweekly phone calls for capsule counts, and a nutritionist checked for changes in usual dietary patterns at the end of the study. Venous blood samples were collected by nurse from the forearm in EDTA-treated and plain tubes after a fasting period, both at baseline and at 2 weeks after the intervention.
Anthropometric and biochemical parameters
Body mass index (BMI) was calculated as weight in kg divided by height in meters squared; waist circumference was also measured. Systolic blood pressure (SBP) and diastolic blood pressure (DBP) was measured from the left arm in seated patients with an automatic blood pressure monitor (TM-2654, A & D, Tokyo, Japan) after a 20 min rest. Two measurements were taken at least 5 minutes apart, and the mean was used for analysis.
Serum total cholesterol (TC), low-density lipoprotein (LDL-
cholesterol), glutamate oxalacetate transaminase (GOT), glutamate
pyruvate transaminase (GPT), and high-density lipoprotein
(HDL-cholesterol) were measured with commercially available
kits (Choongwae, Seoul, Korea) using enzymatic methods. Serum
triglyceride was analyzed using a total glycerol test kit (Roche,
Basel, Switzerland). All measurements were performed on a
BS-220 auto analyzer (FULL Auto chemistry Analyzer Mindray
Bio-Medical Electronics Co. China). Fasting serum glucose (FSG) concentrations were measured by the glucose oxidase method using a Beckman glucose analyzer (Beckman Instruments, Irvine, CA, USA). Atherogenic index (AI) was calculated according to the following formula: (total cholesterol-HDL cholesterol)/HDL cholesterol.
Antioxidant and lipid peroxidation parameters
Plasma obtained from heparinized blood samples was centi- fugated at 3,000 rpm for 15 min and the supernatant fraction was separated. Glutathione peroxidase activitiy (GSH-Px) was determined according to the method described by Beutler [12].
10 μliters of erythrocytic hemolysate were added to 100 μL of 1 M Tris-Hcl-5 mM EDTA buffer (pH 8.0), 20 μL of 0.1 M glutathione, 100 μL of 10 U/ml glutathione reductase, and 100 μ L of 2 mM NADPH, and filled with H
2O to a final volume of 1 mL. After incubating at 37℃ for 10 minutes, the reaction was initiated by the addition of 10 μL of t-butyl hydroperoxide, and the absorbance was measured at 340 nm. The reaction was run for 90 sec, and the loss of NADPH was monitored by the change in A
340nm/min. Catalase (CAT) activity was measured according to the method developed by Aebi [13] 100 μL of erythrocytic hemolysate was dissolved in 50 mL of 50 mM phosphate buffer (pH 7), and 2 mL of the mixture was added to a cuvette. The reaction was initiated by the addition of 1 mL of 30 nM H
2O
2at 20℃. The H
2O
2decomposition rate was measured at 240 nm for 30 seconds using a spectrophotometer.
Superoxide dismutase (SOD) activity was assayed in erythrocyte- suspension by the procedure of Marklund and Marklund [14].
To 500 μL of the hemolysate were added 3.5 mL of water, 1 mL of ethanol and 0.6 mL chloroform. After the centrifugation at 3,000 rpm for 10 min, various dilutions were prepared from the supernatant. 20 μL pyrogallol was added to each dilution after incubation at 37℃ for 10 min. The reaction was monitored spectrophotometrically at 320 nm for 2 min. The unit of the enzyme was defined as the amount which inhibits the autoxida- tion of pyrogallol by 50%. Plasma total radical trapping antioxidant potential (TRAP) was measured using a modification of the photometric method developed by Rice-Evans and Miller [15]. The method for measuring antioxidant activity is predicated on the antioxidant-induced inhibition of the absorbance of the radical cation of 2,2'-azinobis (3-ethylbenzothiazoline 6-sulfonate) (ABTS
•+). The ABTS
•+radical cation is formed by the interaction of ABTS
•+(150 μM) with the ferrylmyoglobin radical species, which is, in turn, generated by the activation of metmyoglobin (2.5 μM) by H
2O
2(75 μM). Ten microliters of sample/buffer/
Trolox-standard was added to tubes containing 400 μL of PBS buffer, 20 μL of metmyoglobin, and 400 μL of ABTS and mixed by vortexing. The reaction was initiated by the addition of 170 μ L of H
2O
2. After 6 min of incubation, the absorbance was measured at 734 nm using a spectrophotometer. Values are expressed as trolox equivalent antioxidant capacity (TEAC) and
defined as the millimolar concentration of the trolox antioxidant capacity of a calibration curve.
Plasma concentrations of retinol, carotenoids, lycopene, tocopherol and coenzyme Q
10were determined simultaneously by RP-HPLC (Reversed Phase High Pressure Liquid Chroma- tography) according to the method of Jakob and Elmadfa [16].
Briefly, plasma proteins were precipitated with ethanol and lipids were extracted with n-hexane. After evaporation, dry residue was redissolved with 150 μL of methanol-dichloromethane (85:15, v/v) and mixed and then 100 μL of this solution was injected into a guard column (Merck LiChrospher 100 RP18 (10 μm), 250 × 4 mm). Samples were run at a flow rate of 1.0 ml/min.
on a Dionex HPLC system (Summit™ HPLC, USA). Absorbance was monitored at 325 nm for retinol, at 295 for tocopherol, at 450 nm for carotenoids, lycopene and at 270 nm for coenzyme Q
10. Concentrations were calculated from areas under the curve using an external calibration curve. To measure plasma vitamin C, venous blood samples were centrifuged 15 min at 1,000 rpm and supernatant 500 μL was added to 2 mL of 0.75 mM metaphosphoric acid solutions. After vortex-mix, it was centrifuged again at 2,400 rpm for 10 min for protein precipitation. The supernatant 500 μL along with 400 μL dinitrophenylhydrazone- thiourea-copper sulphate reagent composed of 0.01 mM of 2,4-dinitrophenylhydrazine, 0.027 M of copper sulfate, and 0.66 M of thiourea allowed to stands for 3 h at 37℃. After cooling for 10 min at cold water, incubate for 30 min at room temperature with 2 mL of 12 M H
2SO
4and then analyzed spectrophoto- metrically at 520 nm. Plasma vitamin C concentration was calculated from standard curve from ascorbic acid (0.014, 0.028, and 0.11 mM) and blank from that of metaphosphoric acid solution.
For DNA damage determination, the alkaline comet assay was conducted according to Singh et al. [17]. The isolated leukocytes duplicated from one subject were subjected to oxidative stress by suspension in PBS with 100 μM H
2O
2for 5 min on ice. The leukocytes, were mixed with 75 μL of 0.7% low melting agarose (LMA), and added to the slides precoated with 0.5% agarose.
The slide was then immersed in lysis solution (2.5 M NaCl, 100 mM EDTA, 10 mM Tris, and 1% sodium laurylasarcosine, 1%
Triton X-100 and 10% DMSO) for 1 hr at 4℃. The slides were next placed into an electrophoresis tank containing 300 mM NaOH and 10 mM Na
2EDTA (pH 13.0) for 40 min. For electrophoresis of the DNA, an electric current of 25 V/300 ± 3 mA was applied for 20 min at 4℃. The slides were washed three times with a neutralizing buffer (0.4 M Tris, pH 7.5) for 5 min at 4℃, and then treated with ethanol for another 5 min before staining with 50 μL of ethidium bromide (20 μg/mL).
Measurements were made by image analysis (Komet 4.0; Kinetic Imaging, Liverpool, U.K.) and fluorescence microscope (DMLB;
LEICA Wetzlar, Germany), determining tail length (50 cells from
each of two replicate slides).
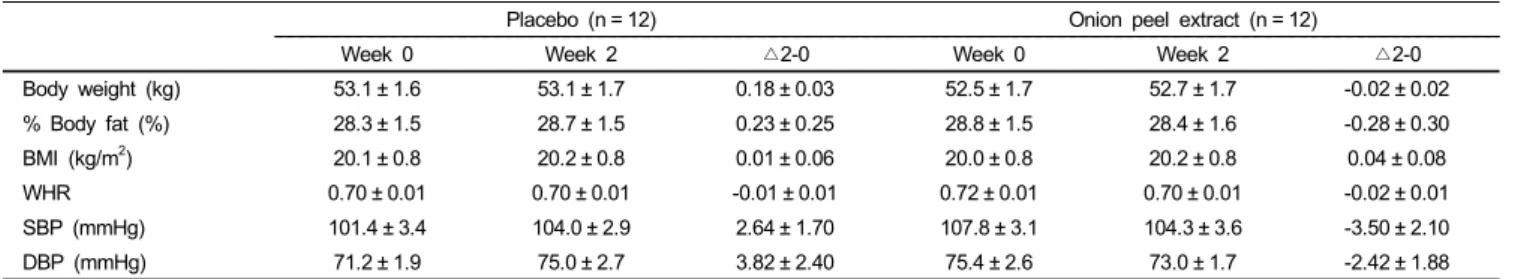
Placebo (n = 12) Onion peel extract (n = 12)
Week 0 Week 2 △2-0 Week 0 Week 2 △2-0
Body weight (kg) 53.1 ± 1.6 53.1 ± 1.7 0.18 ± 0.03 52.5 ± 1.7 52.7 ± 1.7 -0.02 ± 0.02
% Body fat (%) 28.3 ± 1.5 28.7 ± 1.5 0.23 ± 0.25 28.8 ± 1.5 28.4 ± 1.6 -0.28 ± 0.30
BMI (kg/m2) 20.1 ± 0.8 20.2 ± 0.8 0.01 ± 0.06 20.0 ± 0.8 20.2 ± 0.8 0.04 ± 0.08
WHR 0.70 ± 0.01 0.70 ± 0.01 -0.01 ± 0.01 0.72 ± 0.01 0.70 ± 0.01 -0.02 ± 0.01
SBP (mmHg) 101.4 ± 3.4 104.0 ± 2.9 2.64 ± 1.70 107.8 ± 3.1 104.3 ± 3.6 -3.50 ± 2.10
DBP (mmHg) 71.2 ± 1.9 75.0 ± 2.7 3.82 ± 2.40 75.4 ± 2.6 73.0 ± 1.7 -2.42 ± 1.88
Values are mean ± SE.
BMI, body mass index; WHR, waist hip ratio; SBP, Systolic blood pressure; DBP, diastolic blood pressure.
Table 1. Anthropometric information and blood pressure before and after trial
Placebo (n = 12) Onion peel extract (n = 12)
Week 0 Week 2 △2-0 Week 0 Week 2 △2-0
GOT (U/L) 18.8 ± 2.2 17.7 ± 1.7 -1.13 ± 2.31 22.0 ± 1.6 22.6 ± 2.1 0.50 ± 1.83
GPT (U/L) 14.2 ± 1.3 15.3 ± 2.2 1.04 ± 2.08 18.4 ± 1.4 17.6 ± 1.6 -0.71 ± 1.21
TG (mg/dL) 76.3 ± 8.6 66.8 ± 6.9 -9.63 ± 5.72 74.6 ± 7.2 86.3 ± 10.3 11.63 ± 9.36
HDL-Chol (mg/dL) 55.3 ± 1.4 53.1 ± 1.1 -2.14 ± 1.21 58.7 ± 1.4 57.6 ± 0.9 -1.16 ± 0.93
LDL-Chol (mg/dL) 93.8 ± 3.7 92.7 ± 3.9 -1.02 ± 2.46 98.7 ± 4.9 89.1 ± 2.7* -9.55 ± 3.99
Values are mean ± SE. *P< 0.05, significantly different between week 0 and week 2 within the group by paired t-test.
GOT, Glutamic oxaloacetic transaminase; GPT, Glutamic pyruvic transaminase; TG, Triglycerides; HDL-Chol, High-density lipoprotein cholesterol; LDL-Chol, Low-density lipoprotein cholesterol.
Table 2. Liver function enzyme activities and other index in serum before and after trial
Week 0 Week 2 Week 0 Week 2 100
120 140 160 180 200 220
Placebo Onion peel extract P = 0.013 P = 0.109
Total cholesterol (mg/dL)
Week 0 Week 2 Week 0 Week 2 1.0
1.5 2.0 2.5 3.0
Placebo Onion peel extract P = 0.004 P = 0.975
Atherogenic index
Fig. 1. Changes of serum total cholesterol and atherogenic index before and after trial. The P values indicate the significant difference between week 0 and week 2 within the group by paired t-test.
Statistical analysis
Data were analyzed using the SPSS 14.0 package for Windows.
Values were expressed as mean ± SE unless stated otherwise.
Statistical differences between groups and within groups were considered significant at P < 0.05 by Student’s t test and paired t test. Categorical variables were analyzed by using the χ
2test.
Results
Effect of onion peel supplementation on anthropometric and biochemical parameters
To assess the effects of onion peel extract supplementation on risk factors of atherosclerosis, 12 healthy normal-weight,
female college students (mean BMI, 20.2 ± 0.5 kg/m
2; mean percentage body fat, 28.6 ± 1.0%) participated in this study. No adverse effects of onion peel extract or placebo treatment were reported during the 2-week intervention period. On assessing body weight, percentage of body fat, and waist hip ratio, blood pressure, and the blood biochemical indices of liver function enzyme activities, no significant differences were found between the placebo and onion peel extract treatment (Tables 1 and 2).
Effect of onion peel supplementation on plasma lipid profiles After onion peel extract supplementation, the serum total cholesterol, LDL-cholesterol, and AI significantly reduced (P <
0.05), and these effects were not observed after placebo (dextrin)
intake (Table 2 and Fig. 1).
Placebo (n = 12) Onion peel extract (n = 12)
Week 0 Week 2 △2-0 Week 0 Week 2 △2-0
Antioxidative enzymes in erythrocyte
SOD (U/gHb) 2,596.3 ± 57.1 2,728.4 ± 43.3* 132.1 ± 37.2 2,425.6 ± 36.8 2,571.2 ± 33.1* 145.6 ± 56.3
GSH-Px (U/gHb) 30.5 ± 2.0 30.4 ± 1.6 -0.09 ± 1.39 30.4 ± 4.0 31.8 ± 2.7 1.58 ± 2.88
CAT (K/gHb) 118.8 ± 4.7 119.8 ± 4.6 0.89 ± 1.07 117.7 ± 4.0 117.5 ± 4.1 -0.26 ± 1.54
Total antioxidative activity in plasma
TRAP (mM) 1.29 ± 0.04 1.30 ± 0.01 0.01 ± 0.05 1.31 ± 0.02 1.25 ± 0.02 -0.06 ± 0.03
Lipid peroxidation status in plasma
CD (μM) 2.9 ± 0.6 2.7 ± 0.5 -0.16 ± 0.99 2.5 ± 0.4 3.1 ± 0.4 0.60 ± 0.44
Values are mean ± SE. *P< 0.05, significantly different between week 0 and week 2 within the group by paired t-test.
SOD, superoxide dismutase; GSH-Px, glutathione peroxidase; CAT, catalase; TRAP, total radical trapping antioxidant potential; CD, conjugated diene.
Table 3. Changes of antioxidant status and lipid peroxidation status before and after trial
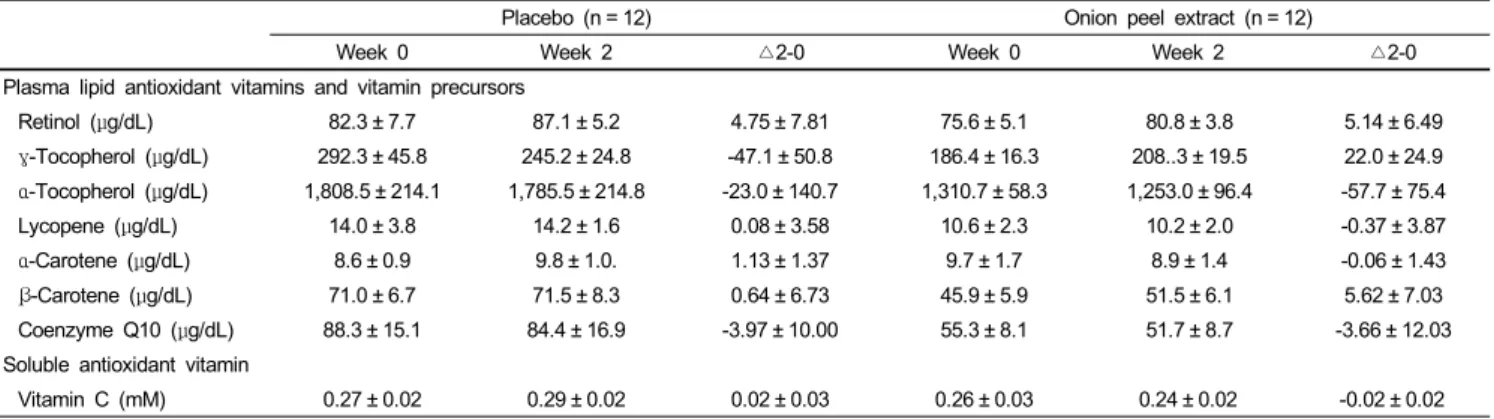
Placebo (n = 12) Onion peel extract (n = 12)
Week 0 Week 2 △2-0 Week 0 Week 2 △2-0
Plasma lipid antioxidant vitamins and vitamin precursors
Retinol (μg/dL) 82.3 ± 7.7 87.1 ± 5.2 4.75 ± 7.81 75.6 ± 5.1 80.8 ± 3.8 5.14 ± 6.49
γ-Tocopherol (μg/dL) 292.3 ± 45.8 245.2 ± 24.8 -47.1 ± 50.8 186.4 ± 16.3 208..3 ± 19.5 22.0 ± 24.9
α-Tocopherol (μg/dL) 1,808.5 ± 214.1 1,785.5 ± 214.8 -23.0 ± 140.7 1,310.7 ± 58.3 1,253.0 ± 96.4 -57.7 ± 75.4
Lycopene (μg/dL) 14.0 ± 3.8 14.2 ± 1.6 0.08 ± 3.58 10.6 ± 2.3 10.2 ± 2.0 -0.37 ± 3.87
α-Carotene (μg/dL) 8.6 ± 0.9 9.8 ± 1.0. 1.13 ± 1.37 9.7 ± 1.7 8.9 ± 1.4 -0.06 ± 1.43
β-Carotene (μg/dL) 71.0 ± 6.7 71.5 ± 8.3 0.64 ± 6.73 45.9 ± 5.9 51.5 ± 6.1 5.62 ± 7.03
Coenzyme Q10 (μg/dL) 88.3 ± 15.1 84.4 ± 16.9 -3.97 ± 10.00 55.3 ± 8.1 51.7 ± 8.7 -3.66 ± 12.03
Soluble antioxidant vitamin
Vitamin C (mM) 0.27 ± 0.02 0.29 ± 0.02 0.02 ± 0.03 0.26 ± 0.03 0.24 ± 0.02 -0.02 ± 0.02
Values are mean ± SE.
Table 4. Changes of plasma lipid antioxidant vitamins, vitamin precursors and vitamin C concentrations
Placebo (n = 12) Onion peel extract (n = 12)
Week 0 Week 2 △2-0 Week 0 Week 2 △2-0
H2O2 induced DNA damage
Head DNA (%) 84.3 ± 0.9 82.5 ± 0.7 -1.82 ± 1.19 84.1 ± 0.7 82.2 ± 0.8 -2.13 ± 1.10
Tail DNA (%) 15.7 ± 0.9 17.5 ± 0.7 1.82 ± 1.19 15.9 ± 0.7 17.8 ± 0.8 2.13 ± 1.10
Tail extent moment 13.9 ± 2.1 20.3 ± 2.2 6.28 ± 3.02 19.5 ± 1.3 22.8 ± 2.7 3.32 ± 2.90
Tail length (μm) 47.8 ± 3.1 62.2 ± 4.1* 14.64 ± 5.53 64.8 ± 2.7 73.6 ± 6.6 8.79 ± 6.69
Values are mean ± SE. *P< 0.05, significantly different between week 0 and week 2 within the group by paired t-test.
Table 5. Changes of leukocytic DNA damage and urinary excretion of damaged DNA before and after trial
Effect of onion peel supplementation on antioxidant status Significantly increased erythrocyte SOD activity was found at the end of both treatment periods. Also, the plasma total antioxidant capacity and other markers of antioxidant status including erythrocyte enzyme activity, plasma lipid antioxidant vitamin (retinol, γ-tocopherol, α-tocopherol, lycopene, α-carotene, β -carotene, and coenzyme Q10) concentrations, and lipid peroxidation parameters did not significantly change after two weeks of supplementation with the placebo or onion peel extract (Tables 3 and 4). In addition, onion peel extract supplementation did not significantly change ex vivo H
2O
2-induced DNA damage, while tail length increased following placebo supplementation (P
< 0.05, Table 5).
Discussion
In this study, we observed that onion peel extract supplemen-
tation improved the TC levels, LDL-cholesterol concentrations,
and AI, although our subjects were normolipidemic. Consistent
with the our findings, hypolipidemic effects with increased
HDL-cholesterol were also reported following freeze-dried onion
flesh powder supplementation (44 mg/day) in a study on
hyperlipidemic patients who were diagnosed early [18]. In
addition, there have been many reports on the hypolipidemic
effects of Allium vegetables including onion, welsh onion, and
garlic [19-21]. This lipid-lowering effect of onion peel extracts
has been partially attributed to various bioactive compounds
including quercetin, kaempferol, and epicatechin found in ethanol
extracts of onion peel [22]. Certain cell line experiments have
provided plausible mechanisms for the hypolipidemic effects of quercetin. According to Gnoni et al. [23], quercetin reduced triacylglycerol and VLDL formation by suppressing diacylglycerol acyltransferase and acetyl-CoA carboxylase activities, but not by inhibiting HMG-CoA-reductase activity. In addition, poor absorption and greater availability of catechins, one of the bioactive compounds in onion peel extracts, may also have contributed to a favorable effect on lipid metabolism. Indeed, Koo and Noh [24] reported that inhibition of lipid absorption by catechins is associated with the ability of catechins to form complexes with lipids and lipolytic enzymes, thus interfering with the luminal processes of emulsification, hydrolysis, micellar solubilization, and subsequent intake of lipids.
Park et al. [25] reported that 5% (w/w) onion peel supplemen- tation, as well as onion flesh supplementation, was beneficial to aged rats for lowering lipid peroxide levels as determined by the plasma total antioxidant status, liver thiobarbituric reactive substance levels, and brain 8-isoprostane levels. However, in this study, the onion peel extract supplementation had no effect on lipid peroxidation parameters or inhibitory capacity against leukocyte DNA damage. Consistent with our findings, a previous study reported no significant changes in cellular DNA damage in kidney or brain tissues of rats fed an ethanol extract of onion peel for 3 months, although plasma quercetin and isorhamnetin levels were markedly increased [25]. Additionally, as more than 80% of quercetin metabolites are localized in the human plasma fraction [26], we hypothesized that onion peel extract supplemen- tation has a sparing effect on plasma antioxidant vitamins.
However, contrary to our expectations, no significant change was found in the concentration of plasma lipid antioxidant vitamins after quercetin-rich onion peel supplementation. This finding is in accordance with the results of Boyle et al. [27], who conducted a study on volunteers who consumed an onion meal and showed that no significant change occurred in the level of any plasma antioxidants measured (vitamin C, retinol, γ-tocopherol, α-toco- pherol, lutein/zeaxanthin, β-cryptoxanthin, lycopene, α-carotene, and β-carotene), although they observed a simultaneous increase in the plasma level of flavonol glucosides, quercetin-3-glucoside, and isorhamnetin-4’-glucoside.
These results can be attributed to the systemic bioavailability of bioactive compounds in onion peel extract during the course of their absorption from the gut and subsequent conversion from the parent metabolites to biologically available products. Among the flavonoids in onion peel extract, quercetin undergoes extensive metabolism, including hydrolyzation and conjugation with glucuronic acid and/or sulfate, whereby its structure is altered [28]. Therefore, quercetin is present as conjugated forms rather than aglycone after ingestion of an onion diet. It is noteworthy that conjugated and/or methylated forms of quercetin have less potent antioxidant capacity than the aglycone form [29].
Generally, approximately 20%-40% of quercetin is methylated in the 3′-position, yielding isorhamnetin [30]. According to Yamamoto et al. [31], the introduction of a conjugate group at
the dihydroxyl group in the B ring decreases free-radical scavenging capacity. However, we do not believe that quercetin completely loses its antioxidant activity during the metabolic process, since conjugated derivative forms of quercetin, such as quercetin-3-O-sulfate, have shown 4 times more potent inhibition of lipoprotein oxidation than trolox, even though they are less powerful than quercetin aglycone [32]. Furthermore, other mixed flavonoids (128 mg) existing in the onion peel extract may also have contributed to the partial antioxidant effect in this study.
In summary, we revealed that onion peel extract supplemen- tation for 2 weeks is beneficial as it reduces the possibility of developing key risk factors for cardiovascular disease by altering the lipid profiles in healthy young women.
References
1. Schaefer EJ. Lipoproteins, nutrition, and heart disease. Am J Clin Nutr 2002;75:191-212.
2. Siems W, Quast S, Carluccio F, Wiswedel I, Hirsch D, Augustin W, Hampi H, Riehle M, Sommerburg O. Oxidative stress in chronic renal failure as a cardiovascular risk factor. Clin Nephrol 2002;58 Suppl 1:S12-9.
3. Hertog MG, Kromhout D, Aravanis C, Blackburn H, Buzina R, Fidanza F, Giampaoli S, Jansen A, Menotti A, Nedeljkovic S, Pekkarinen M, Simic BS, Toshima H, Feskens EJ, Hollman PC, Katan MB. Flavonoid intake and long-term risk of coronary heart disease and cancer in the seven countries study. Arch Intern Med 1995;155:381-6.
4. Bagchi D, Garg A, Krohn RL, Bagchi M, Tran MX, Stohs SJ.
Oxygen free radical scavenging abilities of vitamins C and E, and a grape seed proanthocyanidin extract in vitro. Res Commun Mol Pathol Pharmacol 1997;95:179-89.
5. Ramanathan L, Das NP. Inhibitory effects of some natural products on metal-induced lipid oxidation in cooked fish. Biol Trace Elem Res 1992;34:35-44.
6. Prochaska HJ, Santamaria AB, Talalay P. Rapid detection of inducers of enzymes that protect against carcinogens. Proc Natl Acad Sci U S A 1992;89:2394-8.
7. Frankel EN, Kanner J, German JB, Parks E, Kinsella JE.
Inhibition of oxidation of human low-density lipoprotein by phenolic substances in red wine. Lancet 1993;341:454-7.
8. Jiménez-Aliaga K, Bermejo-Bescós P, Benedí J, Martín-Aragón S. Quercetin and rutin exhibit antiamyloidogenic and fibril-disa- ggregating effects in vitro and potent antioxidant activity in APPswe cells. Life Sci 2011;89:939-45.
9. Kim GN, Kwon YI, Jang HD. Protective mechanism of quercetin and rutin on 2,2'-azobis(2-amidinopropane)dihydrochloride or Cu2+-induced oxidative stress in HepG2 cells. Toxicol In Vitro 2011;25:138-44.
10. Mohammadzadeh S, Sharriatpanahi M, Hamedi M, Amanzadeh Y, Ebrahimi SE, Ostad SN. Antioxidant power of Iranian propolis extract. Food Chem 2007;103:729-33.
11. Crozier A, Lean ME, McDonald MS, Black C. Quantitative analysis of the flavonoid content of commercial tomatoes, onions, lettuce, and celery. J Agric Food Chem 1997;45:590-5.
12. Beutler E. Red Cell Metabolism: A Manual of Biochemical Methods. New York (NY): Grune and Stratton; 1984. p.71-3.
13. Aebi H. Catalase. In: Bergmeyer HU, editor. Methods of Enzymatic Analysis. Vol. 2. Weinheim: Verlag Chemie; 1974. p.673-84.
14. Marklund S, Marklund G. Involvement of the superoxide anion radical in the autoxidation of pyrogallol and a convenient assay for superoxide dismutase. Eur J Biochem 1974;47:469-74.
15. Rice-Evans C, Miller NJ. Total antioxidant status in plasma and body fluids. Methods Enzymol 1994;234:279-93.
16. Jakob E, Elmadfa I. Rapid HPLC assay for the assessment of vitamin K1, A, E and beta-carotene status in children (7-19 years). Int J Vitam Nutr Res 1995;65:31-5.
17. Singh NP, McCoy MT, Tice RR, Schneider EL. A simple technique for quantitation of low levels of DNA damage in individual cells. Exp Cell Res 1988;175:184-91.
18. Lee KH, Kim Y, Park E, Cho S. Study on dietary habit and effect of onion powder supplementation on serum lipid levels in early diagnosed hyperlipidemic patients. J Korean Soc Food Sci Nutr 2008;37:561-70.
19. Kumari K, Augusti KT. Lipid lowering effect of S-methyl cysteine sulfoxide from Allium cepa Linn in high cholesterol diet fed rats. J Ethnopharmacol 2007;109:367-71.
20. Yamamoto Y, Yasuoka A. Welsh onion attenuates hyperlipidemia in rats fed on high-fat high-sucrose diet. Biosci Biotechnol Biochem 2010;74:402-4.
21. Bordia A, Verma SK, Vyas AK, Khabya BL, Rathore AS, Bhu N, Bedi HK. Effect of essential oil of onion and garlic on experimental atherosclerosis in rabbits. Atherosclerosis 1977;26:
379-86.
22. Singh BN, Singh BR, Singh RL, Prakash D, Singh DP, Sarma BK, Upadhyay G, Singh HB. Polyphenolics from various extracts/
fractions of red onion (Allium cepa) peel with potent antioxidant and antimutagenic activities. Food Chem Toxicol 2009;47:1161-7.
23. Gnoni GV, Paglialonga G, Siculella L. Quercetin inhibits fatty acid and triacylglycerol synthesis in rat-liver cells. Eur J Clin
Invest 2009;39:761-8.
24. Koo SI, Noh SK. Green tea as inhibitor of the intestinal absorption of lipids: potential mechanism for its lipid-lowering effect. J Nutr Biochem 2007;18:179-83.
25. Park J, Kim J, Kim MK. Onion flesh and onion peel enhance antioxidant status in aged rats. J Nutr Sci Vitaminol (Tokyo) 2007;53:21-9.
26. Murota K, Hotta A, Ido H, Kawai Y, Moon JH, Sekido K, Hayashi H, Inakuma T, Terao J. Antioxidant capacity of albumin- bound quercetin metabolites after onion consumption in humans.
J Med Invest 2007;54:370-4.
27. Boyle SP, Dobson VL, Duthie SJ, Kyle JA, Collins AR.
Absorption and DNA protective effects of flavonoid glycosides from an onion meal. Eur J Nutr 2000;39:213-23.
28. Manach C, Morand C, Crespy V, Demigné C, Texier O, Régérat F, Rémésy C. Quercetin is recovered in human plasma as conjugated derivatives which retain antioxidant properties. FEBS Lett 1998;426:331-6.
29. Day AJ, Mellon F, Barron D, Sarrazin G, Morgan MR, Williamson G. Human metabolism of dietary flavonoids: identifi- cation of plasma metabolites of quercetin. Free Radic Res 2001;
35:941-52.
30. Graefe EU, Wittig J, Mueller S, Riethling AK, Uehleke B, Drewelow B, Pforte H, Jacobasch G, Derendorf H, Veit M.
Pharmacokinetics and bioavailability of quercetin glycosides in humans. J Clin Pharmacol 2001;41:492-9.
31. Yamamoto N, Moon JH, Tsushida T, Nagao A, Terao J.
Inhibitory effect of quercetin metabolites and their related derivatives on copper ion-induced lipid peroxidation in human low-density lipoprotein. Arch Biochem Biophys 1999;372:347-54.
32. Morand C, Crespy V, Manach C, Besson C, Demigné C, Rémésy C. Plasma metabolites of quercetin and their antioxidant properties.
Am J Physiol 1998;275:R212-9.