Analysis on the electrical degradation characteristics of 2G HTS wires with respect to the electrical breakdown voltages
4
0
0
전체 글
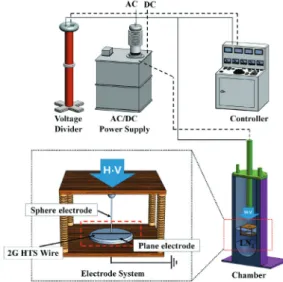
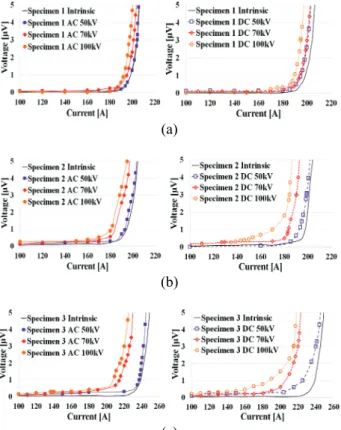
(2) 38. Analysis on the electrical degradation characteristics of 2G HTS wires with respect to the electrical breakdown voltages. (a). (b) Copper. ~20 [ m]. Stabilizer layer. 105±4 [ m]. GdBCO-HTS (1 m). Substrate (STS). (c) Fig. 1. Cross-sectional view of 2G HTS wires used in this study. (a) specimen 1. (b) specimen 2. (c) specimen 3. TABLE I. SPECIFICATIONS OF 2G HTS WIRES.. Specimen 1. Specimen 2. Specimen 3. Manufacturer. SuNAM. SuNAM. SuNAM. Ic [A]. 204. 201. 245. Width [mm]. 4 STS (lamination). 4 Brass (lamination). 4 Copper (bare). ~45. ~45. ~20. 105±4. 105±4. 105±4. 230. 230. 140. 220. 110. 80. 1.35 x 10⁶. 1.5 x 10⁷. 5.95 x 10⁷. Stabilizer material Stabilizer thickness on one side [μm] Substrate thickness [µm] Total thickness [μm] Hardness of stabilizer [H·V] Electrical conductivity of stabilizer [S/m]. 2G HTS wires are composed with different stabilizer materials respectively. Fig. 1 and Table I show the cross-sectional view and brief specifications of the specimen. As shown in Table I, the stabilizer of the specimen 1 is composed of copper laminated by stainless steel; that of the specimen 2 is composed of copper laminated by brass; and finally, specimen 3 is stabilized with copper only. Thus, stabilizer thickness of specimen 1 and 2 on one side are 45µm respectively and that of specimen 3 on one side is 20µm. It is verified that the degradation characteristics are not largely affected by thickness of stabilizer in the past study [4]. In this paper, the electrical breakdown tests are performed by using a sphere-to-plane electrode system. A sphere electrode (diameter : 2mm) made of stainless steel is used to apply the electrical breakdown voltages (50, 70 and 100kV). A 2G HTS specimen is put on a plane electrode, which is grounded and immersed in liquid nitrogen. The electrical breakdown voltages are applied to the 2G HTS wires by adjusting gap between a sphere electrode and a plane electrode. The electrical breakdown voltage is applied to the 2G HTS wires by using an AC (60Hz) power supply with a capacity of 100kV, and a DC power supply with a capacity of 200kV. The AC or DC voltage is applied at the rate of 1kV/s until breakdown, when the short current is flowed to ground electrode. The electrical breakdown test. Fig. 2. The schematic drawing of electrical breakdown experiments. is conducted with the interval of 30min after every electrical breakdown to minimize the influence of void, which may cause the electrical breakdown [2]. The schematic drawing of electrical breakdown experiments is shown in Fig. 2. The length of each specimen is 70mm and the voltage tap is set at 30mm to measure the Ic and index number. The power supply used in the measurement of Ic is EMS 208VAC, manufactured by TDK-Lambda, and the nanovoltmeter is 2182A, manufactured by Keithley. 2.2. Degradation of critical current by electrical breakdown tests The Ic of the specimen degraded by the breakdown tests is measured with AC and DC breakdown voltages. The breakdown test is successively repeated three times with AC and DC voltage. The Ic of specimens is measured after performing every test. Fig. 3 (a), (b), and (c) indicate the V-I curves of specimen 1, 2, and 3 respectively with the magnitude of breakdown voltages (50, 70, and 100kV, respectively). The labels ‘specimen 1 intrinsic’, in Fig. 3 (a) indicates the V-I curve for a 2G HTS wire not affected by breakdown test. The labels ‘specimen 1 AC 100kV’ represents the V-I curve for 2G HTS wires degraded by breakdown voltages tests with AC 100kV. The Ic of intrinsic specimen 1 stabilized by stainless steel is measured as 204A. The Ic of specimen 1 is degraded as 200A after the AC breakdown voltage of 50kV and that of specimen 1 is measured as 197.6A after the AC breakdown voltages of 100kV. It is found that the Ic of specimens is much damaged as the applied AC breakdown voltage increases. Also, the Ic of 2G HTS specimens damaged by DC breakdown voltages are degraded with respect to the applied breakdown voltage. The decreasing rate of Ic, with respect to the applied breakdown voltages, is shown in Fig. 4. As shown in Fig. 4, the Ic decreasing rate of specimen degraded by DC breakdown voltage is similar to that of specimen degraded by AC breakdown voltage. However, the degree of Ic degradation is differently measured with respect to stabilizer material of 2G HTS wires. The Ic.
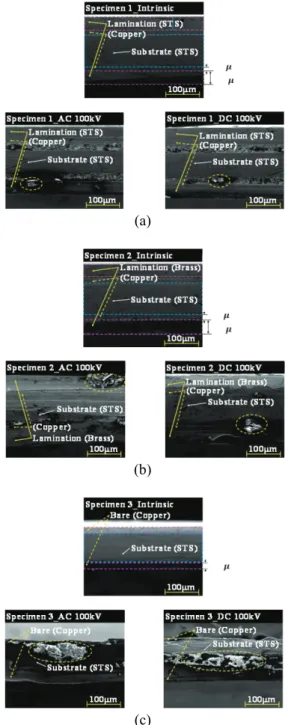
(3) Jong O Kang, Onyou Lee, Young Kyu Mo, Junil Kim, Seungmin Bang, Hongseok Lee, Jae-Hun Lee, Cheolyeong Jang, and Hyoungku Kang. 39. (a). Fig. 5. Decreasing rate of index number with respect to the applied breakdown voltages. (b) n=. (c) Fig. 3. V-I curves of 2G HTS wires degraded by AC and DC breakdown tests. (a) specimen 1. (b) specimen 2. (c) specimen 3.. Fig. 4. Decreasing rate of Ic with respect to the applied breakdown voltages. decreasing rate of specimen 3 stabilized by copper layers is much dependent on the applied breakdown voltage than that of specimen 1 stabilized by stainless steel layers. 2.3. Degradation of index number by electrical breakdown tests The index number characteristics of the specimen with respect to the electrical breakdown tests are observed. The index number presents the sharpness of phase transition of superconducting wires. The index number of 2G HTS wires is calculated using Eq. (1). Typically, E1 is 0.1µV/cm and E2 is 1.0µV/cm when the voltage tap is set at 10mm. I1 and I2 are the current values which correspond to E1 and E2, respectively.. ln(E2 /E1) ln(I2 /I1). (1). In this study, E1 is 0.3µV/cm and E2 is 3.0µV/cm because the voltage tap is set at 30mm. The initial index numbers of specimen 1, 2, and 3, are measured as 41.2, 38.1, and 38.7, respectively. The index numbers of specimens after the AC breakdown voltage with 100kV are measured as 24.8, 10.1, and 4.82 respectively. It is inferred that the index number of 2G HTS wires is degraded according to the electrical breakdown voltage. The decreasing rate of index number with respect to the applied breakdown voltages is shown in Fig. 5. As shown in Fig. 5, the index number decreasing rate of specimen 3 is measured as 37% after the AC breakdown voltage of 50kV; the specimen 3 is measured as 87% after the AC breakdown voltage of 100kV. It is considered that the decreasing rate of 2G HTS specimens is much degraded as the applied breakdown voltage increases. The index number decreasing rate of specimen degraded by DC breakdown voltage is similar to that of specimen degraded by AC breakdown voltage. The decreasing rate of specimen 1 stabilized by stainless steel is lowest among the 2G HTS specimens, while that of specimen 3 stabilized by copper is highest among the 2G HTS specimens. It is concluded that the index number degradation characteristics of 2G HTS wires are affected by the stabilizer material and the magnitude of breakdown voltages. 3. DISCUSSION Fig. 6 shows the cross sectional view of 2G HTS wires by using SEM. The micro-structural degradation of 2G HTS wires is observed with the AC and DC breakdown voltage of 100kV in Fig. 6. It shows that specimen 1 stabilized by stainless steel is most robust among the 2G HTS wires against breakdown voltage tests; while specimen 3 stabilized by copper is most vulnerable against breakdown voltage tests. It is considered that this result may be influenced by the different hardness and electrical conductivity of the stabilizer layers. The destruction of 2G HTS wires is caused by the kinetic energy of electrons. The.
(4) 40. Analysis on the electrical degradation characteristics of 2G HTS wires with respect to the electrical breakdown voltages. quench according to Ohm’s law. As results, it may lead to micro-structural destruction. It is concluded that the robust performance against the electrical breakdown tests is determined by the hardness and electrical conductivity of the stabilizer material. 3. CONCLUSIONS. (a). (b). The degradation characteristics of 2G HTS wires, such as Ic and index number, are examined by performing electrical breakdown tests according to the type of applied voltage (AC and DC) and stabilizer material (stainless steel, brass, and copper). The electrical breakdown tests are successively repeated three times for each condition. The experimental results on the degradation characteristics of 2G HTS wires are described as follows: The degradation characteristics of 2G HTS wires are dependent on the type of stabilizer layer and the magnitude of applied breakdown voltage. The Ic and index number of 2G HTS wires are more degraded as the applied breakdown voltage increases. The degradation characteristics of specimen degraded by DC breakdown voltage are similar to those of specimen degraded by AC breakdown voltage. The degradation characteristics of specimen 1 stabilized by stainless steel are the most superior among the sample wires, while those of sample 3 stabilized by copper are the most vulnerable among the sample wires with respect to the breakdown voltage test. The degradation of 2G HTS wires is dependent on the hardness and electrical conductivity of a stabilizer material. ACKNOWLEDGMENT. (c) Fig. 6. Corss sectional view of 2G HTS wires by using SEM when AC and DC voltage of 100kV is applied. (a) specimen 1. (b) specimen 2. (c) specimen 3. kinetic energies of electrons are similar with each other for AC and DC voltages because the drift velocities of electrons for AC and DC are similar each other. Also, the degradation characteristics of 2G HTS wires are dependent on the magnitude of breakdown voltage and stabilizer material. In this paper, the stabilizer hardness for specimen 1, 2, and 3 is measured as 220, 110, and 80H.V(this unit is hardness constant), respectively. It is found that 2G HTS wires are better protected from the electrical breakdown voltage, when the stabilizer is made with a robust material. Also, the electrical conductivity of specimen 1, 2, and 3 are measured as 1.35x10⁶S/m, 1.5x10⁷S/m, and 5.95x10⁷S/m, It is inferred that the high electrical conductivity of copper causes a relatively large current in the superconductor and it may generate heat or local. This research was supported by Basic Science Research Program through the National Research Foundation of Korea(NRF) funded by the Ministry of Education(2014R 1A1A2058454) REFERENCES [1] [2]. [3] [4]. I. Sauers, “High voltage studies of dielectric materials for HTS power equipment,” IEEE Trans. Appl. Supercond., vol. 9, no. 6, pp 922-931, 2002. Jeong Il Heo, Jonggi Hong, Seokho Nam, Seyong Choi, and Hyoungku Kang, “Design of Current Leads for a High Voltage Superconducting Apparatus,” IEEE Trans. Appl. Supercond., vol. 23, Article #. 4800805, 2013. Y. Iwasa, Case Study on Superconducting Magnets: Design and Operational Issues, Plenum Press, pp. 306-307, 1994 Jong O Kang, Onyou Lee, Seungmin Bang, Junil Kim, Hongseok Lee, Jonggi Hong, Seokho Nam, and Hyoungku Kang, “Degradation Characteristics of Superconducting Wires according to with respect to Electrical Breakdown Tests,” IEEE Trans. Appl. Supercond., vol. 25, No.3, Article #. 8800804, 2015..
(5)
수치
관련 문서
