금융정보시스템의 장애관리를 위한 장애요인변수 추출에 관한 연구 369
KIPS Tr. Software and Data Eng.
A Study on Extraction of Defect Causal Variables for Defect Management in Financial Information System
Tae-Hong Kang
†․Sung-Yul Rhew
††ABSTRACT
Finance Information System is critical national infrastructure. Therefore it is important to select variables of defect causal factor for the system defect management effectively. We research and analyze detected errors in A Company’s Finance Information System for three years. In the result of research and analysis, we have selected 9 variables of defect factor: the trading volume, the fluctuation of KOSDAQ index, and the number of public announcements, etc. Then we have assumed that these variables affect real system errors and analyzed correlation between the hypothesis and the detected system errors. After analyzing, we have extracted the trading volume, the number of orders and fills, changing tasks, and the fluctuations of NASDAQ index as valid variables of defect factor. These variables are proposed for failure prediction model as the variables to manage defects in the finance information system afterward.
Keywords : Financial Information System, Defect Causal Variables
금융정보시스템의 장애관리를 위한 장애요인변수 추출에 관한 연구
강 태 홍
†․류 성 열
††요 약
금융정보시스템은 국가나 사회의 중요한 인프라로서 실효성 있는 장애관리를 위해서는 장애요인변수의 선택이 매우 중요하다. 본 연구에서 는 A사의 3년 간 금융정보시스템에서 발생한 장애를 조사·분석하였다. 조사·분석 결과, 거래량, KOSDAQ 지수의 등락, 공시건수 등 9개의 변 수가 채택되어, 이 장애요인 변수들이 실제 장애를 유발한다는 가설을 세우고, 실제 발생한 장애와의 상관관계를 분석하였다. 분석 결과, 거래 량, 주문/체결건수, 변경업무, 나스닥 지수의 등락이 유효한 장애요인 변수로서 채택되었다. 따라서 본 연구에서는 이 변수들을 금융정보시스템 의 장애관리를 위한 장애모델변수로서 장애예측 모델에 활용할 수 있도록 제안한다.
키워드 : 금융정보시스템, 장애요인변수
1. 서 론 1)
금융정보시스템은 국가적으로나 사회적으로 매우 중요한 인프라임에도 불구하고 효과적인 장애관리가 이루지지 않 으므로, 그로 인한 손실이 매우 막대하다[1]. 금융업계의 경 우, 금융 위험(Risk)에 대한 연구는 매우 활발하게 진행되 고 있으나[2], 금융정보시스템의 위험에 대한 관리는 사후처 리에 집중되어 있고[3], 특히 소프트웨어는 그 특성 상 사전 점검이 어려워 프로세스 품질확보나 테스트의 강화를 통한
†정 회 원 : 숭실대학교 컴퓨터학과 박사수료
††종신회원 : 숭실대학교 컴퓨터학부 교수 논문접수 : 2012년 10월 31일
수 정 일 : 1차 2012년 12월 24일, 2차 2013년 2월 14일 심사완료 : 2013년 2월 14일
* Corresponding Author : Tae-Hong Kang([email protected])
가동 전 결함 추출에 주력한다. 따라서 금융정보시스템에 대한 장애예측이나 예보를 통한 예방적 조치가 더욱 중요 하며, 이를 위해서는 장애를 사전에 인지할 수 있는 요인변 수의 선택이 매우 중요하다. 본 연구의 궁극적인 목표는 장 애를 포함한 과거 장애 데이터를 기반으로 위험관리를 위 한 개념적 장애예방모델을 설계함으로써 장애로 인한 위험 을 예방 혹은 미리 대비함으로 장애로 인한 손실을 최소화 하는 것이다.
본 연구의 금융정보시스템은 증권 및 파생시장의 매매체 결시스템과 정보계 시스템, 그리고 이와 연결된 계정계와 업무계 시스템을 의미한다[4]. 또한 BCP 시스템과 방화벽 등 부대시설도 포함되었다.
1장은 서론으로 본 연구의 배경과 금융정보시스템의 범위 를 기술하였고, 2장은 관련 연구로 장애의 정의와 결함 모
http://dx.doi.org/10.3745/KTSDE.2013.2.6.369
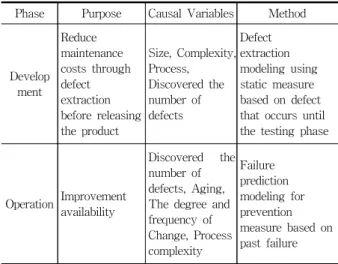
Phase Purpose Causal Variables Method
Develop ment
Reduce maintenance costs through defect extraction before releasing the product
Size, Complexity, Process,
Discovered the number of defects
Defect extraction modeling using static measure based on defect that occurs until the testing phase
Operation Improvement availability
Discovered the number of defects, Aging, The degree and frequency of Change, Process complexity
Failure prediction modeling for prevention measure based on past failure Table 1. The Characteristics of Conceptual Failure Model in
the Development Phase and the Operation Phase
Fig. 1. Traditional Approach of Defect Modeling
델에 대한 기존 연구를 소개하였다. 3장은 과거 금융정보시 스템에서 발생한 장애의 현황을 정리·분석하였으며, 4장은 장애와 각 요인 변수들 간의 상관관계 분석과 가설 검증을 통하여 장애요인 변수들 검증하였고, 마지막으로 5장은 연 구의 결과와 향후 연구에 대하여 기술하였다.2. 관련 연구
2.1 장애의 정의
장애에 대한 정의는 정보시스템 운영지침[5]과 IEEE의 정의[6]를 준용하였다. 이 기준에 따른 장애의 종류로는 첫 째, 결함(Defect)으로 결과물이 불완전하거나 결핍된 것으로, 요구 또는 규격을 만족시키지 못하여 대체되어야 할 필요가 있는 것을 의미한다. 즉, 정보시스템에 대한 포괄적인 비정 상(Anomaly)을 결함 혹은 장애라 한다. 둘째, 문제 (Problem)는 실패나 고장으로 발현되지는 않았으나, 시간의 경과나 조건의 충족 여부에 따라 실패나 고장으로 발전할 수 있는 장애를 의미한다. 셋째, 실패(Failure)는 고객의 불 편을 초래하였거나 불만을 야기한 장애이다. 넷째, 고장 (Fault)은 실패보다 심각한 것으로 고객에게 직접적인 손실 을 입힌 경우와 시장의 중단을 초래한 경우로 나눌 수 있다.
2.2 개발단계의 장애개념모델
소프트웨어에 내재되어 장애로 이어질 수 있는 결함을 예측 하고자 하는 전통적인 방법은 Fig. 1과 같이 Static Measure에 의한 추정방법이다. 그러나 이 모델들은 장애를 분석하고 최소 화하고자 하는 의사결정에 도움이 되지 않는다[7].
소프트웨어 개발 생명주기 상의 모델은 출시(Release) 전 통합테스트나 시스템테스트 시에 제한된 자원을 효율적으로 이용하여 효율적으로 소프트웨어의 품질을 높이고, 출시 후 유지보수 비용을 낮추기 위함이다. Allen P. Nikora[8]는 Todd L. Graves[7]와 같이 전통적인 결함 예측모델방법을 사 용하면서, 이전 연구에서 부족하였던 결함(fault)에 대한 표준 을 정하고, 자동으로 측정할 수 있는 Framework을 개발하였 다. Martin Neil[9]은 소프트웨어 개발 생명주기에 Bayesian Network을 적용하는 것이 전통적인 접근 방법보다 효율적임
을 보였으며, Jean Jacques Gras[10]는 Bayesian Network을 이용하여 개발 및 테스트 단계에서 적용할 수 있는 결함모델 을 개발하였다. A. Gunes Kore[11]는 Static Measure(Code Size, Coupling, Cohesion, Inheritance, Complexity)와 Class Level에서 수집된 결함 데이터를 이용하여, 소프트웨어의 품 질을 높인다. Yuming Zhou[12]는 결함의 건수를 예측하거나, 결함을 가질 수 있는 모듈을 예측하는 방법과 달리, 결함으로 인한 영향 정도(Severity of Impact)를 고려하였다. Pietro Abate[13]은 컴포넌트 간 의존도를 분석함으로써 Error나 Down Time을 줄이는 방법을 제시하였고, Tracy Hall[14]은 2000년 ~ 2010년까지 11년 간 발간된 208개의 Fault 예측 연 구를 체계적으로 검토하여 기준에 적합한 방법론적 정보를 제공하는 36개의 정성적, 정량적 결과를 종합하였다. 이와 같 이 개발단계의 모델들은 주로 Static Measure를 이용하여 결 함을 추출하는 모델링에 역점을 두고 있다.
2.3 운용단계의 장애개념모델
Todd L. Graves[7]는 시간이 지남에 따라 소프트웨어 코 드도 노화(Aging)하거나 부식(Decay)된다고 정의한다. 노화 의 정도는 일정 기간에 Code에 존재하는 Fault의 수를 Count함으로써 측정한다. Gunther A. Hoffman[15]은 예방 적 조치(Preventive Measure)를 통해서 가용성을 향상시키 기 위하여 실패를 모델링하고 예측하는 방법을 제안하고 평 가하였다. Bibi[16]는 결함을 측정하는 알고리즘에 대한 연 구로서, 결함 수를 측정하는 문제에 대하여 Machine Learning 접근법을 적용한 것이다. Ahmed E. Hassan[17]은 Code 자체보다는 Code를 변경하는 프로세스에 기초한 Complexity Metrics을 제안하였고, Le Truong Giang[18]은 기존의 다른 Fault Prediction Model과 달리 Web Application Domain의 특성을 반영한 예측 모델을 제안한 다. 이와 같이 운용단계의 모델들은 주로 예방적 조치를 통 한 실패 예측 모델링에 역점을 두고 있다. Table 1은 개발 단계와 운용단계의 장애개념모델의 특징을 정리하였다.
KIPS Tr. Software and Data Eng.
Classification Cases Percentage Percentage (Subtotal)
Requirement Definition
Missing
requirements 2 2.7%
Inaccurate 9.5%
requirement
definition 5 6.8%
Design
Inaccurate IF
design 2 2.7%
14.9%
Errors of
IF/Timing 1 1.4%
Errors of default
setting values 5 6.8%
Errors in
variable types 3 4.1%
Implementation
Errors of logic
implementation 24 32.4%
64.9%
Errors of
variable values 1 1.4%
Errors of data
processing 11 14.9%
Errors of data
initialization 2 2.7%
Errors of
calculations 5 6.8%
Errors of using variables/functio
ns 5 6.8%
Testing Errors of test
range 1 1.4% 1.4%
Operation
Errors of file
copy/move 3 4.1%
Errors of 9.5%
application
copy/move 4 5.4%
Total 74 100.0% 100.0%
Table 3. Failure Occurrence Status on the Software Development Life-Cycle
Attribute A B C D E F G Total Percentage (%)
HW 150 95 71 55 30 134 535 67.1
NW 12 1 3 7 23 2.9
SSW 17 5 3 11 1 2 39 4.9
Supplementary
Installation 2 4 1 56 63 7.9
Data Errors 11 1 5 17 2.1
Shortage of
Capacity 6 7 5 18 2.3
Operational
Errors 12 7 3 22 2.8
Development
Errors 39 24 8 3 74 9.3
Unknown 3 2 1 6 0.8
Total 252 141 96 77 30 143 58 797 100.0 Table 2. Failure Occurrence Status of Each Domain
3. 장애현황 분석
3.1 자료 수집 및 분석 방법
본 연구를 위하여 2008년부터 2010년 까지 3년 동안 금융 업계의 IT 전문회사인 A사의 장애 데이터와 기록들을 수집 하였다. 수집된 장애 데이터는 유가증권시장, 코스닥시장, 지 수선물시장과 옵션시장 등 4개 시장시스템과 가격 정보를 처리하는 시세 정보 시스템, 계정 계 시스템과 업무 계 시 스템, 그리고 부대설비 등을 포함한 기반시설에서 발생한 장애 데이터들이다. 또한 거래량, 지수, 주문/체결 건수, 공 시건수, 환율, 나스닥 지수, 유가, 매경 뉴스 건수 등 시장과 관련된 자료는 시장운영을 담당하고 있는 K사를 통하여 수 집하였고 데이터의 상관도 분석은 SPSS 12를 이용하였다.
상관분석을 위한 상관계수는 SPSS에서 제공하는 Pearson의 상관계수이다. 금융회사나 기관마다 장애의 기준이 매우 다 르므로 여기서 정한 분석의 대상은 IEEE에서, 분류 방법은 정보시스템 장애관리 지침에 따라 분류하였고 통제 불가능 한 요인은 제외하였다.
3.2 도메인 별 장애발생 현황
각 도메인 별 장애발생 현황 Table 2에서 나타난 바와 같이 각 도메인에서 발생한 장애의 대부분은 하드웨어 장애 이다. 그러나 제조 기술의 발전에 따라 시스템 중단으로 이 어지는 하드웨어 장애는 상대적으로 많지 않고, 오히려 소 프트웨어에 의한 장애가 서비스의 중단으로 이어지는 경우 가 많다. 반면 데이터오류, 용량부족, 운용오류, 코딩오류로 인한 장애는 전체의 16.5%이나, 이로 인한 손해배상이나 고 객의 불만 등 영향 정도(Severity of Impact)는 대단히 크 다. 그러므로 소프트웨어 개발단계에서의 품질관리와 운영 단계에서의 시스템 변경에 따른 결함관리가 매우 중요하다.
또한 이러한 장애의 영향 정도와 장애의 빈도는 Domain에 따라 큰 차이가 있음을 알 수 있다. 금융정보시스템은 서론
에서 기술한 바와 같이 여러 Domain으로 구성되는데, A Domain은 계정 계 시스템, 즉, 거래의 모든 기록을 포함하 는 원장을 의미하며, B Domain은 시장의 매매체결시스템을, C Domain은 정보 계 시스템을, D Domain은 인증시스템을, E Domain은 보안침해방지시스템을, F Domain은 BCP 시스 템을, G Domain은 방화벽 등의 부대 시스템을 의미한다.
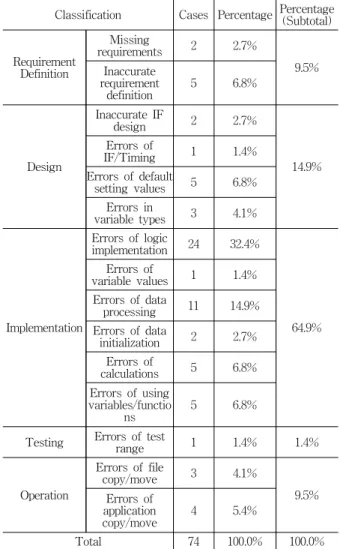
3.3 SDLC상의 장애현황
소프트웨어개발생명주기 상에서의 결함 74건에 대하여 상 세히 분석한 결과는 Table 3과 같다.
응용프로그램의 장애는 개발이나 유지보수 등 변경작업으 로 인한 SDLC 상의 오류에서 그 요인을 찾을 수 있다. 그 러나 다른 장애들에 대해서는 제조나 프로세스 상의 오류로 짐작할 뿐, 사실 상 그 요인을 찾기가 쉽지 않으며 실제 장 애와의 상관관계를 연구한 사례도 알려져 있지 않다. 금융 시장은 응용프로그램 외에도 여러 가지 요인에 의하여 영향 을 받는 완전 자유경쟁시장으로서 이 시장을 운영하는 정보 시스템 역시 다양한 외부의 변화에 따라 영향을 받는다.
Causal Factor ID Hypothesis
The Trading Volume
H1-1 The increase of the trading volume has positive (+) effect on the frequency of failure of the financial information system.
H1-2 The increase of the trading volume has positive (+) effect on the degree of failure of the financial information system.
The Fluctuations of Stock Prices
H2-1 The fluctuations of stock prices have positive (+) effect on the frequency of failure of the financial information system.
H2-2 The fluctuations of stock prices have positive (+) effect on the degree of failure of the financial information system.
The Number of Public Announcements
H3-1 The number of public announcements has positive (+) effect on the frequency of failure of the financial information system.
H3-2 The number of public announcements has positive (+) effect on the degree of failure of the financial information system.
The Number of Orders and Conclusions
H4-1 The number of orders and conclusions has positive (+) effect on the frequency of failure of the financial information system.
H4-2 The number of orders and conclusions has positive (+) effect on the degree of failure of the financial information system.
The Number of Change Orders
H5-1 The number of change orders has positive (+) effect on the frequency of failure of the financial information system.
H5-2 The number of change orders has positive (+) effect on the degree of failure of the financial information system.
The Fluctuations of the Won-Dollar Exchange Rate
H6-1 The fluctuations of the Won-Dollar exchange rate have positive (+) effect on the frequency of failure of the financial information system.
H6-2 The fluctuations of the Won-Dollar exchange rate have positive (+) effect on the degree of failure of the financial information system.
The Fluctuations of NASDAQ Index
H7-1 The fluctuations of NASDAQ index have positive (+) effect on the frequency of failure of the financial information system.
H7-2 The fluctuations of NASDAQ index have positive (+) effect on the degree of failure of the financial information system.
The Fluctuations of Oil Prices
H8-1 The fluctuations of oil prices have positive (+) effect on the frequency of failure of the financial information system.
H8-2 The fluctuations of oil prices have positive (+) effect on the degree of failure of the financial information system.
The Number of MK News
H9-1 The number of MK news have positive (+) effect on the frequency of failure of the financial information system.
H9-2 The number of MK news have positive (+) effect on the degree of failure of the financial information system.
Table 4. Hypothesis about Causal Factors of Defects
4. 장애요인변수의 추출 및 가설 검증
4.1 장애요인변수
금융업계에서는 정보시스템이 소프트웨어 개발 상의 결함 이나 시스템 결함 외에 다른 외부적 요인들에 의하여 영향 을 받는 것으로 알려져 있다. 이러한 장애요인 변수의 채택 을 위하여 업계에 근무한 경력 5년 이상의 전문가 48명을 대상으로 설문조사를 실시하여 상위 50%내에 속한 요인 9 개의 변수를 채택하였다. 선택된 장애요인 변수는 거래량, 주문/체결 건수, 지수의 등락 정도, 변경 업무 건수, 다우 지 수, 원 달러 환율, 유가 등이며, 이들 요인들은 모두 수집이 가능한 정보들이다. 이러한 요인들이 정보시스템의 장애와
연관성이 있는 지를 검증하는 것은 금융정보시스템의 안정 적 운용에 매우 중요하다. 따라서 이러한 장애요인 변수들 과 장애의 발생빈도, 그리고 장애로 인한 영향 정도에 대한 상관관계를 분석하고 검증하였다. 분석 대상이 된 요인 변 수들은 1) 거래량 2) 지수의 등락 3) 공시건수 4) 주문/체결 건수 5) 변경업무건수 6) 원 달러 환율 7) 나스닥 지수등락 8)유가등락 9) 경제신문의 뉴스건수 등이다.
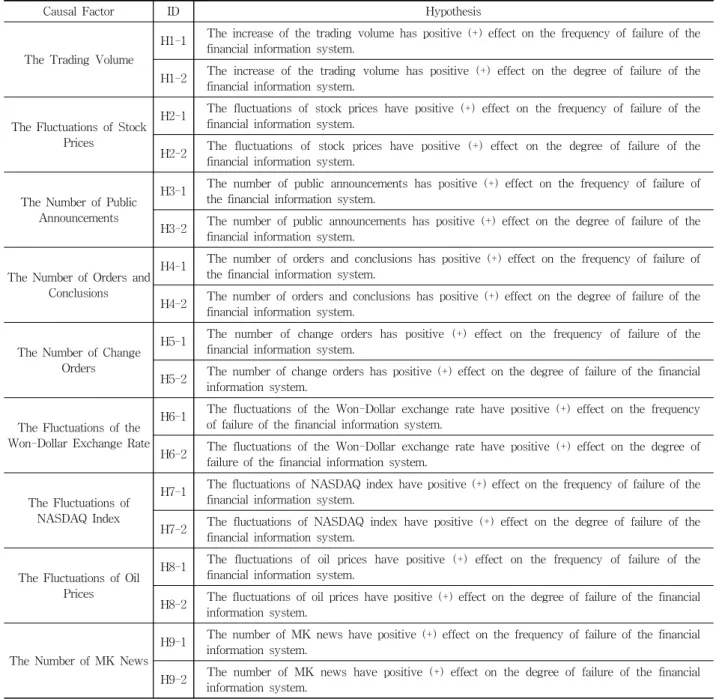
1) 장애요인 변수에 대한 연구가설
장애요인 변수를 정하기 위하여 상관관계 계산과 이를 이 용한 검증이 필요하므로, 이를 위하여 Table 4과 같이 각 요인들에 대한 가설을 설정한다.
KIPS Tr. Software and Data Eng.
Grade Criterion Weighted
Value
1 Impact on market operation 57
2 Causing the loss of customers’ images
and costs 27
3 Interrupt or delay of customer service 11 4 Causing customer inconvenience or
dissatisfaction 5
5 Failure Occurrence
Not included
6 Problems
7 Operational Independent Failure (Holidays, Devices, etc.)
Table 5. The Weighted Value of Each Defect Grade using AHP
귀무가설: H0 :
ρ
= 0검정 통계량:
t는 귀무 가설 하에서 자유도 (n-2)인 t
분포를 따른다.H0
기각 역:1) H1:
ρ
< 0 일 때 t < - tn-2,1-α2) H1:
ρ
> 0 일 때 t > tn-2,1-α3) H1:
ρ
= 0 일 때 |t| > tn-2,1-α/2(Equation 1)
Classification
The Frequency of Failure The Effect Degree of Failure Significance
Probability
Correlation
Coefficient t value Significance Probability
Correlation Coefficient t value
The Trading Volume
Futures Market 0.820 - - 0.195 - -
Securities Market 0.172 - - 0.039 0.345 2.143
KOSDAQ Market 0.018 0.393 2.492 0.001 0.550 3.839
Options Market 0.82 - - 0.111 - -
The Fluctuations of Stock Prices
Futures Market 0.242 - - 0.192 - -
Securities Market 0.744 - - 0.773 - -
KOSDAQ Market 0.959 - - 0.806 - -
The Number of Public Announcements
Securities Market 0.474 - - 0.265 - -
KOSDAQ Market 0.518 - - 0.255 - -
The Number of Orders and Conclusions
Securities Market 0.488 - - 0.081 0.295 1.8
KOSDAQ Market 0.278 - - 0.0 0.580 4.151
Derivatives Market 0.873 - - 0.099 0.279 1.694
The Number of Change Orders 0.926 - - 0.022 0.380 2.395
The Fluctuations of the Won-Dollar
Exchange Rate 0.226 - - 0.252 - -
The Fluctuations of NASDAQ Index 0.009 -0.431 -2.785 0.273 - -
The Fluctuations of Oil Prices 0.954 - - 0.309 - -
The Number of MK News 0.390 - - 0.312 - -
Table 6. Correlation Analysis Result of 95% Significance Probability
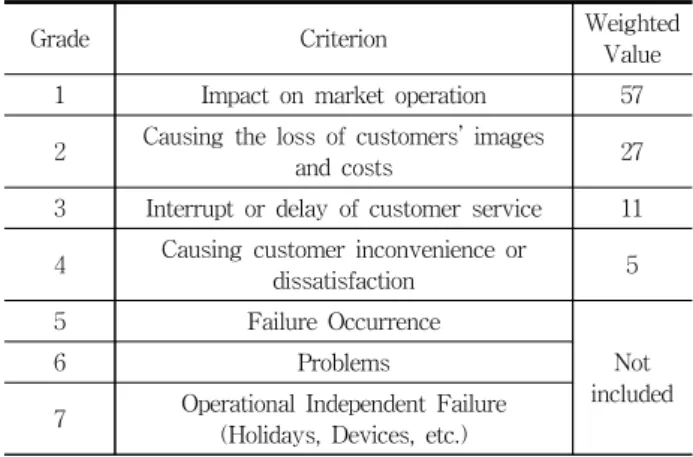
2) 요인 변수의 정의와 척도본 연구의 종속변수인 금융정보시스템의 장애는 첫째, 단 위척도인 장애발생 빈도수와 둘째, 장애의 영향 정도 (Severity of Impact)를 상대적으로 나타내는 순위척도로서 장애영향 정도를 가중치로 나타내었다(Table 5). 가중치는 AHP(Analytic Hierarchy Process)를 이용한 전문가 설문을 실시하여 그 가운데 일치 계수(Rate)가 0.1 이하로 일관성이 검증된 46명의 설문 결과를 사용하였다.
4.2 장애와 요인변수 간 상관도 분석
가설 H1-1의 거래량이란, 4개 시장, 즉, 유가증권시장, 코 스닥시장, 선물시장, 옵션시장의 거래량을 합산한 것이다. 시 장 전체의 월별 거래량과 장애발생 건수, 그리고 장애영향 정도를 고려한 상관도이다. 먼저 4개 시장 전체의 월 별 거 래량과 장애발생건수와의 상관계수는 유의확률 0.032에서 r
= 0.357이다. 통계학에서 표본상관계수 r은 모집단상관계수
ρ
의 점 추정량으로 사용된다. 상관계수ρ
의 검정은 (Equation 1)과 같다.검정통계를 통한 귀무 가설 H0의 채택 여부를 결정하기 위하여 t 값을 구하는 과정은 (Equation 2)와 같다.
ID Hypothesis Acceptance H1-1
H1-2
The increase of the trading volume has positive (+) effect on the frequency of failure of the financial information system.
The increase of the trading volume has positive (+) effect on the degree of failure of the financial information system.
Partly Accepted Partly Accepted
H4-1 H4-2
The number of orders and conclusions has positive (+) effect on the frequency of failure of the financial information system.
The number of orders and conclusions has positive (+) effect on the degree of failure of the financial information system.
Rejected Partly Accepted
H5-1 H5-2
The number of change orders has positive (+) effect on the frequency of failure of the financial information system.
The number of change orders has positive (+) effect on the degree of failure of the financial information system.
Rejected Accepted
H7-1 H7-2
The fluctuations of NASDAQ index has positive (+) effect on the frequency of failure of the financial information system.
The fluctuations of NASDAQ index has positive (+) effect on the degree of failure of the financial information system.
Accepted(-)*
Rejected
* : Accepted as the negative(-) of the correlation
Table 7. Hypothesis Verification Results
(Equation 2)
귀무 가설 : H0:
ρ
= 0, 즉, 모집단상관계수ρ
는 상관관계 가 없다는 귀무 가설에서ρ
> 0일 때 t > tn-2,1-α이어야 한 다. 즉, 2.228 > 1.684이므로 귀무 가설 H0는 기각할 수 있 다. 즉, 전체 시장의 거래량은 장애에 정(+)의 영향을 준다 고 할 수 있다. 개별 시장에 대하여 유가증권시장과 코스닥 시장의 거래량과 장애건수와의 상관계수인 r 값은 각각 0.232, 0.393이고, t 값도 각각 1.390, 2.492으로 나타나므로 코스닥시장에 대해서는 유의확률 98%에서 귀무 가설을 기 각할 수 있다.가설 H1-2에서 거래량과 영향 정도의 상관계수를 구하 면, 선물시장, 유가증권시장, 코스닥시장, 그리고 옵션시장의 거래량과 영향 정도의 상관계수는 유의확률이 각각 p=0.195, 0.039, 0.001, 0.111에서 r=0.221, 0.345, 0.550, 0.270이다. 유의 확률 95%를 기준으로 하므로 유가증권시장과 코스닥시장의 거래량은 유의확률 95%에서 귀무 가설을 기각할 수 있다.
이와 같은 방법으로 각 요인들에 대한 유의확률, 상관계수, t값을 구하면 Table 6과 같다.
4.3 가설 검증에 대한 소론
Table 6을 기초로 가설들을 검증한 결과는 Table 7과 같 다. 부분 수용은 전체 시장보다는 개별 시장과의 상관관계 가 있는 것으로 검증된 경우이다. 또한 나스닥 지수 등락의 경우, 가설에서는 정(+)의 관계가 있다고 가정하였으나, 결 과는 반대로 부(-)의 관계로 나타났다. 이는 지수등락에 대 한 가설 H2가 장애와는 상관관계가 없는 것으로 나타난 것 과 관련이 있을 것으로 추측되나, 정확한 원인에 대해서는 추가적인 연구가 필요하다. 검증 결과 거래량, 주문체결건수,
변경업무 건수, 나스닥 지수의 등락이 금융정보시스템의 장 애에 영향을 끼치는 장애요인변수임을 확인할 수 있다. 이 요인들은 장애개념모델의 요인변수로 사용될 수 있으며, 추 후 장애예측모델에도 활용될 수 있다.
기존 연구들은 소프트웨어 출시(Release) 전 통합테스트 나 시스템테스트 시에 제한된 자원을 효율적으로 이용하여 소프트웨어의 품질을 높이고, 출시 후 유지보수 비용을 낮 추기 위하여, 소프트웨어에 내재되는 크기나 복잡도 혹은 테스트 결과 등을 이용하여 결함을 많이 내포하고 있을 가 능성이 있는 모듈을 예측한다. 운용단계에서는 정보시스템 의 가용성 향상을 위하여 주로 예방적 조치를 통하여 장애 나 소프트웨어에 내재된 결함을 예측하는 방법들을 제안한 다. 이러한 연구들은 대부분이 소프트웨어 자체가 품고 있 는 결함에 초점을 맞추고 있다. 그러나 본 연구에서는 관점 을 달리하여 정보시스템의 장애발생에 영향을 주는 것으로 예상되는 요인을 선택하였고, 이를 가설 검증을 통하여 일 부 요인들이 정보시스템의 장애와 상관관계가 있음을 증명 하였다. 이러한 장애요인 변수들은 추후 장애예측을 위한 종합적인 모델 설정 시 기존의 장애유발 요인과는 다른 요 인으로서 활용될 수 있으므로 장애예측의 정확도를 높이는 데 기여한다.
5. 결론 및 향후 연구
국가적으로나 사회적으로 Business Critical한 금융정보시 스템의 효과적인 위험관리를 위해서는 요인변수의 측정이 가장 중요한 요소이다. 금융정보시스템의 요인변수로 거래 량, 지수등락, 공시건수, 주문/체결 건수, 변경업무건수, 환 율, 나스닥 지수, 유가, 그리고 뉴스건수를 선택하여 상관분 석과 가설검증을 실시하였으며, 그 결과, 거래량, 주문/체결
KIPS Tr. Software and Data Eng.
건수, 변경업무 건수는 장애의 빈도 수나 영향 정도와 정(+) 의 상관관계가, 나스닥 지수의 등락은 장애의 빈도 수와 부 (-)의 상관관계가 있음이 밝혀졌다. 그러므로 이 요인변수들 은 금융정보시스템의 장애개념모델을 위한 지표로 활용될 수 있다. 또한 기존의 선행 연구들은 정보시스템의 하드웨 어나 소프트웨어에 개발 당시부터 내재되어 있는 장애를 예 측하거나 장애발생확률을 모델화하는 연구였으나, 본 연구 에서는 하드웨어나 소프트웨어를 포함한 금융정보시스템의 특성요인 변수를 추출하여 장애에 관련한 상관관계를 분석 하고 연구하여 가설검증을 통하여 상관관계가 있음을 증명 하였다. 그 결과 첫째, 거래량은 장애의 빈도수와 영향 정도 에 모두 상관관계가 있는 것으로 밝혀져, 거래량이 많을수 록 장애의 가능성이 증가하는 것이 증명되었고, 둘째, 주문/
체결 건수와 변경업무 건수는 장애의 영향 정도와 상관관계 가 있음을 증명하였다. 특히 일반적으로 생각하는 것과는 달리 주문/체결 건수가 변경업무 건수보다 높은 상관관계를 보이는데 이는 금융정보시스템의 위험관리를 위하여 주문/
체결 건수에 대한 모니터링이 필요함을 나타낸다.
향후 연구과제로 금융정보시스템에 치명적인 위험을 유발 할 수 있는 대외적 요인들인 정치·사회·경제적 사건·사고의 영향력에 관한 연구가 필요하며, 이를 기존의 결함 추출 방 법과 장애예측연구와 결합하여 범 국가적인 장애예측모델과 장애 대책 매뉴얼을 구축하여 금융정보시스템의 효과적인 위험관리에 대처하여야 한다.
참 고 문 헌
[1] National IT Industry Promotion Agency (NIPA), SW Engineering White Book, NIPA, 2011, pp.5-6.
[2] S.K. Oh, Risk Management Theory, Kyungmoon Publishers, 1999.
[3] H.S. Park, “Recent Domestic Bank’s Risk Management and Future Works”, The Bank of Korea, Finance Systems Review, Vol.7, pp.85-95, 2002.
[4] T.H. Kang, S.Y. Rhew, “A Proposal for Improvement and Current Situation of Risk Management of Financial Information System”, Information Systems Review, Vol.14, No.2, pp.103-115, 2012.
[5] Telecom m unication Technology Association(TTA), Information System Management Guides, TTA, 2007.
[6] IEEE, IEEE Std 1044-2009, Standard Classification for Software Anomalies, IEEE, 2009.
[7] Todd L. Graves, Alan F. Karr, J.S. Marron, Harvey Siy,
“Predicting Fault Incidence Using Software Change History”, IEEE Transactions on Software Engineering, Vol.26, No.7, July, 2000.
[8] Allen P. Nikora, John C. Munson, “Developing Fault Predictors
for Evolving Software Systems”, Proceedings of the 9th International Metrics Symposium(METRICS’03), IEEE, 2003.
[9] Martin Neil, Norman Fenton, “Improved Software Defect Prediction”, Agena Ltd and Queen Mary, University of London, 2004.
[10] Jean Jacques Gras, “End-to-End Defect Modeling”, IEEE Software Published by the IEEE Computer Society, 2004 [11] A. Gunes Kore, Hongfang Lie, “Building Effective
Defect-Prediction Models in Practice”, University of Maryland, Baltimore County, 2005.
[12] Yuming Zhou, “Empirical Analysis of Object-Oriented Design Metrics for Predicting High and Low Severity Faults”, IEEE Transactions on Software Engineering, Vol.32, No.10, Oct., 2006.
[13] Pietro Abate, Roberto Di Cosmo, “Predicting Upgrade Failure Using Dependency Analysis”, IEEE, 2011.
[14] Tracy Hall, Sarah Beecham, David Bowes, David Gray, Steve Counsell, “Systematic Literature Review on Fault Prediction Performance in Software Engineering”, IEEE Transactions of Software Engineering, 2011.
[15] Gunther A. Hoffman, Felix Salfner, Miroslaw Malek,
“Advanced Failure Prediction in Complex Software Systems”, Humbolt Univ, Berlin, Dep of Computer Science, Computer Architecture and Communication Group, 10099 Berlin, Germany, April, 2004.
[16] Bibi S., Tsounakas G., Stamelos I., Vlahavas I., “Software Defect Prediction Using Regression via Classification”, IEEE, 2006.
[17] Ahmed E. Hassan, “Predicting Faults Using the Complexity of Code Changes”, Software Analysis and Intelligence Lab.
School of Computing, Queen’s Univ, Canada. IEEE, 2009.
[18] Le Truong Giang, Dongwon Kang, Doo-Hwan Bae,
“Software Fault Prediction Models for Web Applications”, KAIST, Daejeon, Korea, 2010 34th Annual IEEE Computer Software and Applications Conference Workshops
강 태 홍
e-mail : [email protected] 1984년 숭실대학교 전산과(학사) 1987년 숭실대학교 전산과(석사)
2011년 숭실대학교 컴퓨터학과(박사수료)
관심분야 : 정보시스템 위험 및 장애 관리,
정보시스템 위험 및 장애 분석,
모델링
류 성 열