산업혁명에 따른 고용구조 변화 데이터 분석
김 재 영* · 김 현 수**
목 차
요약 1. 서론 2. 이론적 배경 3. 산업 유형 분류
4. 국가별 산업별 고용 구조 변화
4.1. OECD 국가의 고용구조 변화 4.2. 고용구조 변화 요인 5. 토의 및 결론
참고문헌 Abstract
요약
ㄴ
최근 제4차 산업혁명 시대가 도래함에 따라서 산업구조와 고용구조가 크게 변화될 것이라는 전망이 발표되고 있다.
특히 인공지능의 발전이 자동화를 촉진하여 제조업의 일자리는 감소하고, 인간 고유 능력 중심의 서비스 일자리 중심으로 재편될 것이라는 분석이 많다. 본 연구는 이 같은 이론적 분석에 의한 추세 전망 모델을 기초 검증하기 위해 수행되었다.
제4차 산업혁명으로 인한 고용구조 변화에 대한 통찰력을 획득하기 위해 지난 수십 년간의 고용구조 변화를 국가별, 시대별로 분석하였다. 이러한 데이터 분석을 통하여 고용구조 변화 모델에 대한 일차적 검증을 수행하였다. 기존 연구자가 예측한 U자 형태의 모델로 이동하고 있는지에 대한 실증적 분석을 하였으며, 향후의 전망에 대한 기초 분석도 제시하였다. 분석결과, U자형 모델로의 고용구조 변화는 실제 데이터로 확인되고 있으며, 이러한 U자화 추세는 제4차 산업혁명시대에 더욱 가속화될 것으로 전망되었다. 향후 보다 정밀한 데이터 분석에 의한 모델 검증이 필요하며, 고용구조 변화에 대한 심층 연구도 필요하다.
표제어: 제4차 산업혁명, 고용구조, 산업구조, 자동화, 서비스산업
접수일 (2017년 7월 12일), 수정일(1차: 2017년 9월 7일), 게재확정일(2017년 9월 21일)
* 재이컨설팅, [email protected]
** 교신저자, 국민대 경영대학 경영학부 교수, [email protected]
1. 서론
최근 제4차 산업혁명 시대가 도래함에 따라 전 산업의 고용 구조가 변화할 것이라는 전망이 다양한 관점에서 발표되고 있다. Lee(2016)는 제4차 산업혁 명을 이대로 맞이한다면 실업자가 30%에 도달하여 사회의 불안을 야기할 것이며, 양극화가 심화될 것 으로 예측하였으며, 실업자에 대한 수당이 증가함에 따라 세금이 늘어나게 되고, 결국 취업자의 부담이 가중되어 사회의 갈등이 유발될 것이라고 전망하였 다. 따라서 향후의 일자리 구조를 보다 정확하게 예 측하고 사회적 갈등이 최소화되도록 산업정책을 구 사할 필요가 있다.
본 연구는 산업정책 변화를 위한 기초 작업으로 서 향후 산업구조와 일자리 구조의 변화 방향에 대 한 실증적 연구로서 수행하였다. 고용구조 변화와 관련된 이론적 배경을 살펴보고, 이를 기초 검증하 였다. 선진국을 중심으로 지난 수십년간의 고용구조 변화를 분석하여 향후의 방향성을 예측하는 모델 구 축을 시도하였다. 특히 제4차 산업혁명시대는 초연 결화 초지능화 시대이므로, 인간의 일자리가 양적으 로나 질적으로 크게 변화될 것이다. 따라서 초지능 화되고 초연결화된 기계가 대체하기 어려운 인간의 일자리를 늘리는 방향으로 고용정책과 산업정책을 구사할 필요가 있는데, 이러한 방향성을 실제 데이 터를 사용하여 검증하고자 한다.
아래에서 기존 관련 연구를 정리하고, 제3장에서 지능화된 기계로의 대체 가능성을 중심으로 일자리 유형을 분류하고, 분류된 유형에 의해 선진국들의 지난 수십 년간의 고용 데이터를 분석한 후 추세 모 델을 도출하여 향후의 방향으로 제시하였다.
2. 이론적 배경
고용구조의 변화를 예측하는 기존의 연구들은 제4
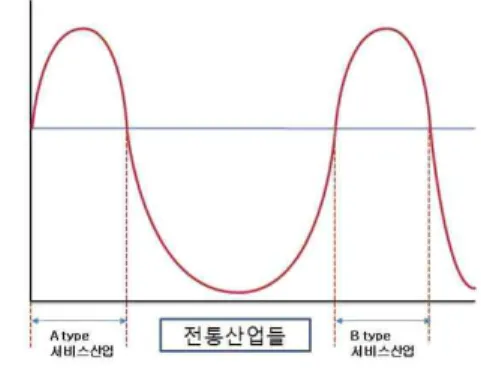
차 산업혁명이 진행될수록 고용구조가 U자 형태를 띄게 될 것이라는 결과를 담고 있다. 즉 지능화된 기계가 대체하기 어려운 인간 고유의 능력을 중심으 로 일자리 구조가 변화될 것이라고 분석하고 있다.
Kim(2016)는 <Fig. 2-1>과 같이 미용사, 예술가 등 기계가 대체하기 힘든 상호작용이 많은 고유한 인적 역량을 제공하는 A Type 산업의 고용 비중이 증가 하고, 또한 인간의 지혜와 협동역량을 요구하는 B Type 산업의 고용 비중이 증가하며, 이외의 산업군 은 대부분 기계가 대체하여 고용이 감소할 것으로 전망하였다.
Fig. 2-1 New Employment Structure Model (Kim, 2016)
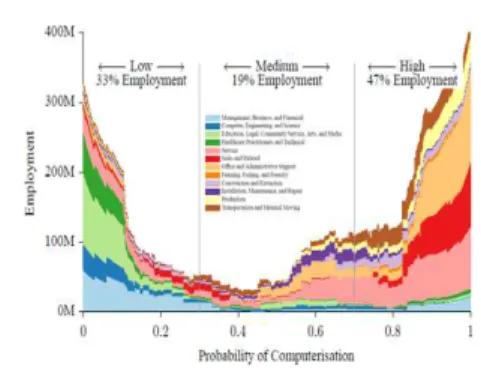
Frey and Osborne(2013)은 기술과 컴퓨터의 연산 능력의 향상 등으로 인하여 사무직 및 행정직 등 저 숙련직이 감소하는 등 산업 구조가 변화할 것으로 예측하였으며, 컴퓨터화로 대체될 가능성이 높은 산 업군을 2010년의 직업 데이터를 사용하여 <Fig. 2-2>
과 같이 분석하였다.
Fig. 2-2 New Employment Structure Model ((Frey and Osborne(2013))
또한, Autor and Dorn(2013)은 1980년부터 2005년 사이의 미국 고용 및 임금의 분석을 통하여 저 숙련 서비스 직종의 성장과 양극화에 대하여 분석하였으 며, 기술에 따른 고용의 변화를 <Fig. 2-3>와 같이 분석하였다.
Fig. 2-3 Employment Change by Technology (Autor and Dorn(2013))
결국 Kim(2016)과 Frey and Osborne(2013) 및 Autor and Dorn(2013)이 전망한 미래의 일자리 구조 는 대체적으로 일치하고 있으며, 미래의 전체 고용 구조가 U자형으로 변화한다고 전망하고 있는 것이 다. 즉 오랜 기간 진화된 인간의 고유 역량 중심으 로 인간의 일자리가 재편되며, 초지능화된 기계가 인간을 도와 기계와 인간의 협업시대가 성숙된다는
것이다.
아래에서 산업유형을 인간 고유 역량을 기준으로 A type과 B type의 두 가지 유형으로 분류하고 지난 수십 년간 주요 선진국의 고용변화 데이터를 통해 전반적인 추세 분석을 수행한다.
3. 산업 유형 분류
제4차 산업혁명으로 인한 고용구조 변화와 관련 한 통찰력을 획득하기 위해 지난 수십 년간의 고용 구조 변화를 OECD의 산업분류 체계를 기준으로 국 가별로 분석하기 위해 먼저 산업 유형을 분류하였 다.
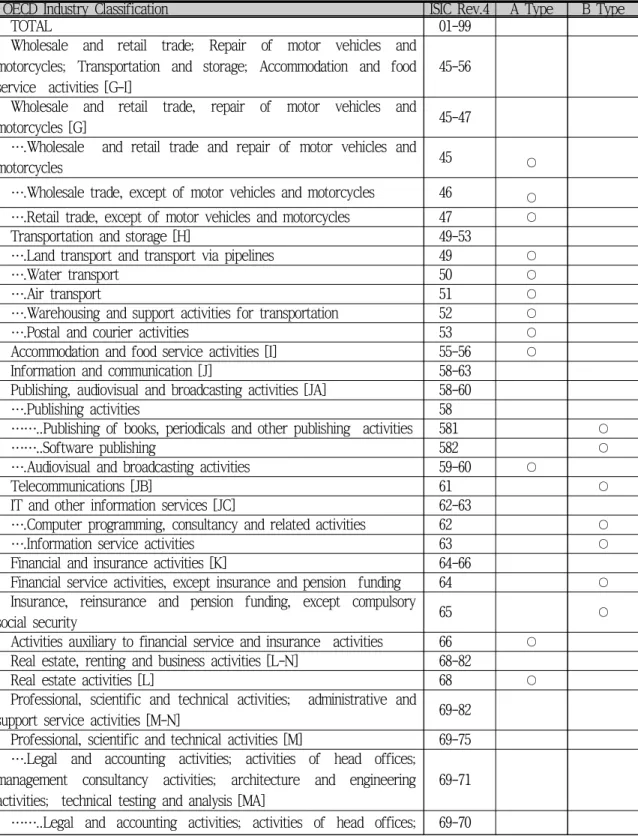
Kim(2016)이 정의한 신산업 구조모델을 기준으로 오랜 기간 진화된 인간의 신체적 고유역량을 많이 사용하는 A Type의 산업, 즉 미용사, 간호사, 문화 예술가 등 기계가 대체하기 어려운 일자리들과, 호 모사피엔스의 핵심역량인 협동역량과 고도의 지식을 주로 사용하는 B Type의 일자리들로 유형을 분류하 였다. 아래 <Tab. 3-1>과 같이 OECD의 관련 산업 유형을 A type 과 B type 으로 분류하였다. 하나의 분류코드를 가진 산업에는 여러 유형의 일자리들이 공존하기 때문에, 하나의 산업 분류에 하나의 타입 을 확정적으로 부여하기는 어렵다. 그러나 본 연구 의 목적이 전반적인 추세 분석에 있으므로, 다수를 차지하는 유형을 파악하여 그에 해당하는 타입을 해 당 산업의 유형으로 부여하였다. 예를 들어 Air transport와 같은 산업의 경우 항공기 조종사와 같이 B Type에 해당하는 직종도 존재하나, 대부분의 인력 이 스튜어디스와 같이 신체적 고유역량을 많이 사용 하는 A Type에 해당하기 때문에 결과적으로 A Type으로 분류하는 등 우세한 타입을 기준으로 분 류하였다.
Tab. 3-1 Job Type Classification based on OECD Industry Classification
OECD Industry Classification ISIC Rev.4 A Type B Type
TOTAL 01-99
Wholesale and retail trade; Repair of motor vehicles and motorcycles; Transportation and storage; Accommodation and food service activities [G-I]
45-56
Wholesale and retail trade, repair of motor vehicles and
motorcycles [G] 45-47
….Wholesale and retail trade and repair of motor vehicles and
motorcycles 45 ○
….Wholesale trade, except of motor vehicles and motorcycles 46 ○
….Retail trade, except of motor vehicles and motorcycles 47 ○
Transportation and storage [H] 49-53
….Land transport and transport via pipelines 49 ○
….Water transport 50 ○
….Air transport 51 ○
….Warehousing and support activities for transportation 52 ○
….Postal and courier activities 53 ○
Accommodation and food service activities [I] 55-56 ○
Information and communication [J] 58-63
Publishing, audiovisual and broadcasting activities [JA] 58-60
….Publishing activities 58
……..Publishing of books, periodicals and other publishing activities 581 ○
……..Software publishing 582 ○
….Audiovisual and broadcasting activities 59-60 ○
Telecommunications [JB] 61 ○
IT and other information services [JC] 62-63
….Computer programming, consultancy and related activities 62 ○
….Information service activities 63 ○
Financial and insurance activities [K] 64-66
Financial service activities, except insurance and pension funding 64 ○ Insurance, reinsurance and pension funding, except compulsory
social security 65 ○
Activities auxiliary to financial service and insurance activities 66 ○ Real estate, renting and business activities [L-N] 68-82
Real estate activities [L] 68 ○
Professional, scientific and technical activities; administrative and
support service activities [M-N] 69-82
Professional, scientific and technical activities [M] 69-75
….Legal and accounting activities; activities of head offices;
management consultancy activities; architecture and engineering activities; technical testing and analysis [MA]
69-71
……..Legal and accounting activities; activities of head offices; 69-70
출처: OECD STAN, 2017, https://stats.oecd.org 재구성 management consultancy
……….Legal and accounting activities 69 ○
……….Activities of head offices; management consultancy activities 70 ○
……..Architectural and engineering activities; technical testing and
analysis 71 ○
….Scientific research and development [MB] 72 ○
….Advertising and market research; other professional, scientific
and technical activities; veterinary activities [MC] 73-75
……..Advertising and market research 73 ○
……..Other professional, scientific and technical activities;
veterinary activities 74-75
……....Other professional, scientific and technical activities 74 ○
……....Veterinary activities 75 ○
Administrative and support service activities [N] 77-82
Rental and leasing activities 77 ○
Employment activities 78 ○
Travel agency, tour operator, reservation service and related
activities 79 ○
Security and investigation activities; services to buildings and landscape activities; office administrative, office support and other business support activities
80-82 ○
Community, social and personal services [O-U] 84-99 Public administration and defence; compulsory social security;
education; human health and social work activities [O-Q] 84-88 Public administration and defence; compulsory social security [O] 84 ○
Education [P] 85 ○
Human health and social work activities [Q] 86-88
….Human health activities [QA] 86 ○
….Residential care and social work activities [QB] 87-88 ○ Arts, entertainment, repair of household goods and other services
[R-U] 90-99
Arts, entertainment and recreation [R] 90-93
….Creative, arts and entertainment activities; libraries, archives,
museums and other cultural activities; gambling and betting activities 90-92 ○
….Sports activities and amusement and recreation activities 93 ○
Other service activities [S] 94-96
….Activities of membership organizations 94 ○
….Repair of computers and personal and household goods 95 ○
….Other personal service activities 96 ○
….Activities of households as employers; undifferentiated activities
of households for own use [T] 97-98 ○
Activities of extraterritorial organizations and bodies [U] 99 ○
위와 같은 저자들의 타입 유형 분류는 각 산업과 직업의 전통적인 모습에 기반한 것으로서, 과학기술 의 발전과 사회 수요의 변화에 따라 각 산업과 직업 의 형태가 계속 변화될 것이다. 특히 A Type 일자리 가 과학기술 발전과 산업의 혁신에 따라 B Type 일 자리로 변화되는 경우가 많을 것이다. 예를 들어, 전 통적인 교육 산업은 교수자와 학습자 간의 상호작용 이 중요한 요소이므로 A Type 일자리로 분류되어 있는데, 사회의 요구와 과학기술의 활용으로 B Type 일자리로 변화되고 있는 중이다. 다른 많은 산업들 도 이와 같은 변화의 과정 중에 있으므로, 미래의 일자리는 B Type이 크게 증가할 것이다. 본 연구에 서 분석하는 데이터는 과거 수십년간의 데이터이므 로, 이 시점을 기준으로 고용구조 변화 데이터를 분 석하면 아래와 같다.
4. 국가별 산업별 고용 구조 변화
국가별 OECD의 SNA08, ISIC REV.4 version of STAN의 2017년 4월 기준의 데이터를 중심으로 하여 EMPN Number of person engaged(Total employment)를 기준으로 1980년부터 2015년까지의 (3차 산업혁명 시대에 해당) 고용구조의 변화를 분석 하였다. 이는 OECD가 전세계의 경제문제에 공동으 로 대응하기 위하여 만들어진 기구이기 때문에, OECD에서 조사한 결과가 고용구조 변화의 모습을 확인하는 설명력이 높다고 할 수 있다. A Type 산업 과 B Type 산업은 <Tab. 3-1>에서 정의한 기준에 따라 분석하였으며, 제조업은 OECD의 산업분류체계 중 Manufacturing[C](10-33)을 기준으로 분석하였다.
4.1. OECD 국가의 고용구조 변화
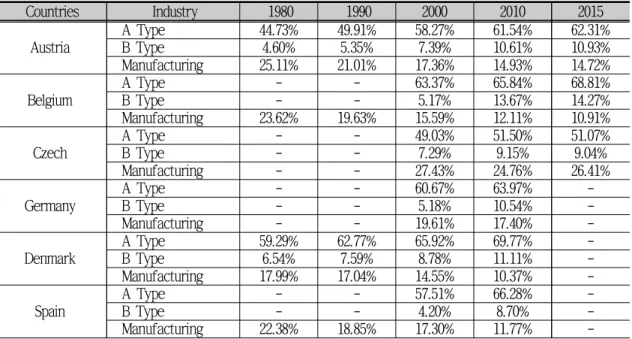
제4차 산업혁명으로 인한 고용구조 변화에 대한 통찰력을 획득하기 위해 지난 1980년부터 2015년까 지의 고용구조를 분석하였으며, 조사된 모든 국가의 산업별 고용 비중은 <Tab. 4-1>과 같이 분석되었다.
Tab. 4-1 Employment Share by Industry in OECD Countries
Countries Industry 1980 1990 2000 2010 2015
Austria
A Type 44.73% 49.91% 58.27% 61.54% 62.31%
B Type 4.60% 5.35% 7.39% 10.61% 10.93%
Manufacturing 25.11% 21.01% 17.36% 14.93% 14.72%
Belgium
A Type - - 63.37% 65.84% 68.81%
B Type - - 5.17% 13.67% 14.27%
Manufacturing 23.62% 19.63% 15.59% 12.11% 10.91%
Czech
A Type - - 49.03% 51.50% 51.07%
B Type - - 7.29% 9.15% 9.04%
Manufacturing - - 27.43% 24.76% 26.41%
Germany
A Type - - 60.67% 63.97% -
B Type - - 5.18% 10.54% -
Manufacturing - - 19.61% 17.40% -
Denmark
A Type 59.29% 62.77% 65.92% 69.77% -
B Type 6.54% 7.59% 8.78% 11.11% -
Manufacturing 17.99% 17.04% 14.55% 10.37% - Spain
A Type - - 57.51% 66.28% -
B Type - - 4.20% 8.70% -
Manufacturing 22.38% 18.85% 17.30% 11.77% -
출처: OECD STAN, 2017, https://stats.oecd.org 재구성
분석된 결과 중 수치로 명시하지 않은 부분은 해 당 년도에 모든 산업에 대한 조사가 이루어지지 않 아 본 연구에서는 제외하였다.
고용 비중의 변화가 1% 미만인 멕시코와 룩셈부 르크의 B type은 고용구조가 변화되었다고 보기 어 렵기에 제외하고, 국가별로 각 유형별 고용의 증가
와 감소 상황을 요약한 결과는 <Tab. 4-2>과 같다.
Finland
A Type 48.99% 55.07% 58.48% 61.98% -
B Type 4.49% 6.28% 6.59% 10.47% -
Manufacturing 23.79% 19.33% 19.15% 14.69% - France
A Type 40.60% 59.60% 65.70% 67.71% -
B Type 1.83% 6.50% 10.08% 11.37% -
Manufacturing 21.35% 16.94% 13.62% 10.43% - Greece
A Type - - 58.73% 63.72% -
B Type - - 3.79% 8.14% -
Manufacturing - - 10.41% 9.15% -
Italy
A Type - - 58.19% 60.38% -
B Type - - 4.59% 10.18% -
Manufacturing - - 19.87% 16.82% -
A Type - - 55.20% 57.27% -
Luxembourg B Type - - 10.52% 10.40%
Manufacturing - - 12.89% 9.15%
Mexico
A Type - - - 38.34% 39.11%
B Type - - - 2.69% 2.75%
Manufacturing - - - 10.74% 10.79%
Netherlands
A Type 56.62% 60.05% 66.07% 69.73% 70.88%
B Type 5.00% 5.73% 6.35% 5.94% 5.20%
Manufacturing 17.49% 14.86% 11.56% 9.10% 8.72%
Norway
A Type 59.26% 64.73% 68.38% 69.16% -
B Type 4.54% 5.55% 4.54% 9.05% -
Manufacturing 18.08% 13.11% 11.85% 9.52% - Portugal
A Type - - 49.25% 57.38% -
B Type - - 2.91% 6.53% -
Manufacturing - - 20.40% 14.93% -
Slovak
A Type - - 52.61% 56.41% 56.69%
B Type - - 6.95% 8.55% 9.15%
Manufacturing - - 24.47% 21.27% 21.64%
Slovenia
A Type - - 44.68% 49.45% -
B Type - - 4.54% 11.47% -
Manufacturing - - 27.23% 20.35% -
Sweden
A Type - - 58.08% 65.74% -
B Type - - 5.70% 11.32% -
Manufacturing - - 17.16% 13.49% -
Tab. 4-2 Changes in Employment Structure by Industry by Countries
출처: OECD STAN, 2017, https://stats.oecd.org 재구성
총 18개의 대상 국가를 분석한 결과 네덜란드의 B Type을 제외하고는 산업별 고용구조가 U자형으로 변화함을 파악할 수 있다. 1980년부터 2015년까지의 산업별 고용구조 변화를 살펴보면 A Type 산업은 평균적으로 약 15% 이상 증가한 것으로 분석되며, B Type 산업의 경우 평균적으로 약 5% 이상 증가한 것으로 분석된다. 또한 제조업은 평균적으로 10% 가 량 감소한 것으로 나타나고 있다. 앞서 언급한 바와 같이, 본 연구에서 저자들이 A Type과 B Type을 분 류한 기준은 각 산업과 직무의 전통적인 일자리 모 델에 기준한 것이므로, 최근의 과학기술 발전 상황 을 반영하면 A Type 일자리는 실제보다 크게 나타 난 것이고, B Type 일자리는 실제보다 작은 수치로 나타난 것으로 볼 수 있다. 이와 같은 전체적인 상 황을 반영하면, 제3차 산업혁명 시대의 고용구조 변
화는 뚜렷한 U자형 모델로 변화해 왔음을 확인할 수 있다.
4.2. 고용구조 변화 요인
제4차 산업혁명시대의 고용구조 변화 방향을 추 정하기 위해, 제3차 산업혁명 시대에 고용구조 변화 를 촉진시킨 요인에 대해 분석하였다. 제3차 산업혁 명은 정보기술(IT)로 인한 산업혁명이었으므로, 정보 기술의 이용 확산 상황을 분석하면, 일자리 구조 변 화와의 상관관계를 파악할 수 있다.
제3차 산업혁명기간 중 많은 산업과 기업에서 PC 를 이용한 직무가 늘어났으며, 직무에 PC를 일상적 으로 사용하는 사람들의 비중 또한 <Tab 4-3>와 같 이 본 연구에서 분석한 국가 중 조사가 시행되지 않 은 국가를 제외하면, 호주를 제외한 모든 국가에서 대부분 크게 증가하고 있다.
Tab. 4-3 Persons employed regularly using a computer in their work
출처: OECD STAN, 2017, https://stats.oecd.org 재구성 Countries A Type B Type Manufact
uring Australia Increase Increase Decrease
Belgium Increase Increase Decrease Czech Increase Increase Decrease Denmark Increase Increase Decrease Finland Increase Increase Decrease France Increase Increase Decrease Germany Increase Increase Decrease Greece Increase Increase Decrease Italy Increase Increase Decrease Luxembourg Increase - Decrease
Mexico - - -
Netherlands Increase Decrease Decrease Norway Increase Increase Decrease Portugal Increase Increase Decrease Slovak Increase Increase Decrease Decrease Increase
Increase Slovenia
Increase Decrease Increase
Spain
Sweden Increase Increase Decrease
Countries 2005 2010 2015 Austria 52.32% 51.13% -
Belgium - 68.17% -
Czech - 39.81% 44.83%
Denmark - - 71.33%
Finland - 70.83% 76.13%
France - 54.74% 60.98%
Germany 56.69% 61.42% - Greece 23.94% 40.34% 44.31%
Italy - 42.59% 47.23%
Netherlands - 64.17% 66.92%
Norway 58.63% 66.99% 71.50%
Portugal - 36.44% 41.49%
Slovak 36.45% 44.38% 48.63%
Slovenia 47.96% 52.16% 54.84%
Spain - 55.02% 58.30%
Sweden - 70.72% -
또한 기업 내 생산, 물류, 회계, 재고, 구매 등의 경영과 관련된 프로세스를 통합하여 연계해주는 ERP의 도입으로 인하여 의사결정을 빠르게 할 수 있는 환경이 마련되었다[Laudon & Laudon,2006]. 본 연구에서 분석한 국가 중 조사가 시행되지 않은 국 가를 제외하면, <Tab. 4-4>와 같으며, 모든 국가가 ERP 도입률이 증가하였으며, 이로 인하여 고용구조 가 변화하였음을 짐작해볼 수 있다.
Tab. 4-4 Businesses using ERP (Enterprise Resource Planning) software
출처: OECD STAN, 2017, https://stats.oecd.org 재구성
이처럼 PC와 ERP를 이용한 업무의 비중이 늘어 남에 따라서 산업의 많은 영역이 자동화 되었다고 볼 수 있으며, 자동화가 3차 산업혁명 시대의 고용 구조 변화의 요인으로 작용하였다고 할 수 있다.
또한, 연결성 강화가 고용구조의 변화요인으로 작 용하였다고 볼 수 있다. 인터넷 보급 이후 수많은 개인 및 기업이 인터넷을 이용한 업무 처리가 활성 화되었다. 예를 들어, 과거에는 특정 분야 조사를 위
하여, 사람이 직접 이동하거나, 전화를 통하여 일일 이 확인하는 등의 방법을 이용하였지만, 연결화로 인하여 많은 정보를 손쉬운 방법으로 얻게 되었다.
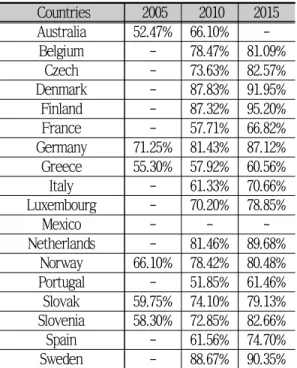
<Tab. 4-5>와 같이 웹사이트 또는 홈페이지를 이용 하는 비즈니스가, 본 연구에서 분석한 국가 중 조사 가 시행되지 않은 국가를 제외한 모든 국가에서 증 가세를 띄고 있다.
Tab. 4-5 Businesses with a website or homepage
출처: OECD STAN, 2017, https://stats.oecd.org 재구성
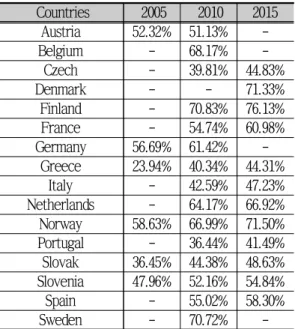
또한 이같은 기업의 웹사이트를 확인할 수 있도 록 인터넷 연결이 가능한 PC를 사용하는 사람의 비 율도 <Tab. 4-6>과 같이 본 연구에서 분석한 국가 중 조사가 시행되지 않은 국가를 제외한 모든 국가 에서 증가세를 띄고 있음을 통하여 확인할 수 있다.
Countries 2005 2010 2015 Australia 52.47% 66.10% -
Belgium - 78.47% 81.09%
Czech - 73.63% 82.57%
Denmark - 87.83% 91.95%
Finland - 87.32% 95.20%
France - 57.71% 66.82%
Germany 71.25% 81.43% 87.12%
Greece 55.30% 57.92% 60.56%
Italy - 61.33% 70.66%
Luxembourg - 70.20% 78.85%
Mexico - - -
Netherlands - 81.46% 89.68%
Norway 66.10% 78.42% 80.48%
Portugal - 51.85% 61.46%
Slovak 59.75% 74.10% 79.13%
Slovenia 58.30% 72.85% 82.66%
Spain - 61.56% 74.70%
Sweden - 88.67% 90.35%
Countries 2005 2010 2015 Austria - 24.93% 41.12%
Belgium - 40.12% 50.00%
Czech - 20.57% 30.25%
Denmark - 28.66% 46.52%
Finland - 27.72% 36.51%
France - 24.14% 39.32%
Germany - 28.58% 56.48%
Greece - 35.93% 36.52%
Italy - 21.88% 35.92%
Luxembourg - 21.18% 38.73%
Netherlands - 21.80% 44.75%
Norway - 19.08% 31.81%
Portugal - 26.01% 43.84%
Slovak - 17.25% 30.40%
Slovenia - 20.91% 32.90%
Spain - 21.90% 35.17%
Sweden - 35.49% -
Tab. 4-6 Persons employed using computer with Internet access
출처: OECD STAN, 2017, https://stats.oecd.org 재구성
이처럼 많은 개인 및 기업의 연결성이 강화됨에 따라, 개인과 기업의 생산성이 높아지고, 일상적인 업무가 고도화되어 B Type 의 일자리가 증가되었다 고 볼 수 있다. 또한 생산성이 높은 개인과 기업을 지원하기 위해 인적 서비스의 수요가 높아지면서 A 타입 일자리도 증가하였다고 볼 수 있다.
이와 같이, 제3차 산업혁명시대에는 정보기술 확 산으로 인한 자동화 촉진과 연결화 증대가 전체 고 용구조를 U자형으로 변화시키는 주된 요인이었다고 할 수 있다.
5. 토의 및 결론
제4장에서 살펴본 바와 같이 제3차 산업혁명 시 대에 고용구조가 U자형으로 변화한 요인은 자동화 와 연결화로 볼 수 있는데, 제4차 산업혁명시대에 이 추세가 가속화될지, 또는 다른 형태로 변화할지
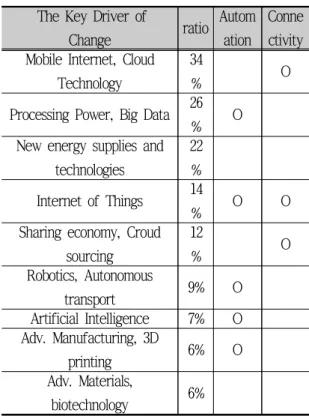
에 대해 본 장에서 토의한다. World Economic Forum(2016b)은 지난 1, 2, 3차 산업혁명은 자동화와 연결화의 진보와 관련이 있다고 분석하였으며, 제4 차 산업혁명시대에는 변화가 극대화 될 것으로 분석 하였다. 인공지능 등을 통한 극단적인 자동화를 예 로 들며, 자동화가 가능한 폭을 크게 넓혀서 현재 사람만 할 수 있다고 생각되는 업무의 상당수가 자 동화 될 것으로 전망하였다. 또한, 국제적이며 즉각 적인 연결화를 통해 새로운 사업 모델이 창출될 것 이라 전망하였다. 제4차 산업혁명으로 인한 기술적 주요 변화 동인을 정의하였으며, 이를 연결화와 자 동화로 Mapping 하면 <Tab. 5-1>과 같다.
Tab. 5-1 The key driver of change in the Fourth Industrial Revolution
출처: World Economic Forum(2016a), The Future of Jobs 재구성
이외에도 Ministry of Science, ICT and Future Countries 2005 2010 2015
Austria 34.87% 42.23% 51.59%
Belgium - 55.34% -
Czech - 31.83% 37.06%
Denmark - 64.32% 71.33%
Finland - 64.11% 70.11%
France - 44.34% 53.48%
Germany 38.40% 48.78% 52.04%
Greece 23.94% 33.70% 38.35%
Italy - 33.22% 41.12%
Luxembourg - 53.51% 44.49%
Netherlands - 58.01% 61.41%
Norway 50.17% 62.76% 66.51%
Portugal - 29.96% 36.12%
Slovak 24.86% 33.02% 39.43%
Slovenia 35.75% 42.96% 48.39%
Spain - 44.12% 49.13%
Sweden - 62.99% 72.09% The Key Driver of
Change ratio Autom ation
Conne ctivity Mobile Internet, Cloud
Technology
34
% O
Processing Power, Big Data 26
% O
New energy supplies and technologies
22
% Internet of Things 14
% O O
Sharing economy, Croud sourcing
12
% O
Robotics, Autonomous
transport 9% O
Artificial Intelligence 7% O Adv. Manufacturing, 3D
printing 6% O
Adv. Materials,
biotechnology 6%
Planning(2016)과 Korcham (2017)은 자동화로 단순, 반복 업무를 로봇과 인공지능이 수행하는 등 변화가 더욱 커질 것으로 예측하였다. 또한, KSA(2016)와 Lee(2016)는 연결화로 인터넷과 인공지능이 결합한 형태의 초연결 시대로 변화할 것으로 예측하였다.
이처럼 많은 연구에서 자동화, 연결화가 제4차 산 업혁명시대에 가속화 될 것으로 예측하고 있으므로, 제3차 산업혁명시대의 고용구조 변화추세는 제4차 산업혁명시대에는 더욱 강화될 것으로 전망할 수 있 다. 즉 제3차 산업혁명시대에 고용구조가 U자형으로 변화한 것보다 제4차 산업혁명 시대에는 더욱 빠르 게 U자형으로 변화할 것으로 전망된다.
향후 본 연구의 한계였던, 제한된 데이터로 인한 분석의 한계를 극복하고, OECD 산업분류 중 세분류 를 기준으로 고용구조의 변화에 대한 상세 조사 분 석이 필요하다. 또한 고용구조 변화 촉진 요인에 대 한 보다 과학적인 후속 연구가 필요하다.
Reference
[1] Arntz, M., T. Gregory and U. Zierahn (2016), The Risk of Automation for Jobs in OECD Countries: A Comparative Analysis, OECD Social, Employment and Migration Working Papers, No. 189, OECD Publishing, Paris.
[2] Autor, D.H. and Dorn, D.(2013). The Growth of Low-Skill Service Jobs and the Polarization of the US Labor Market, American Economic Review, Vol.103, No.5, pp.1553-1597
[3] Frey and Osborne. (2013). The Future of Employment, Oxford Martin Programme on Technology and Employment
[4] Katz, L. F. and Margo, R. A.(2013), Technical change and the relative demand for skilled labor: The united states in historical perspective, National Bureau of
Economic Research, 18752.
[5] Kim, Hyunsoo. (2016). A Structural Change to Service-Centered Economy by the 4th Industrial Revolution: U-Model Industry and Employment Structure, Service Korea Initiative Special Conference, The Society of Service Science, April 2016, pp.43-54 (김현수. (2016). 4차혁명과 서비스 중심경제로의 구조변화: U모델 산업 및 고용구조로 의 전환, 서비스강국코리아 특별 세미나 자료집, 2016.4.28., pp. 43-54)
[6] Korcham. (2017). Influence of the Fourth Industrial Revolution and Policy Trends (대한상공회의소.
(2017), 4차 산업혁명 영향과 정책동향)
[7] KSA. (2016). Standardization linkage strategy of fusion technology leading the fourth industrial revolution, (한국표준협회. (2016). 4차 산업혁명을 이끄는 융복합 기술의 표준화 연계 전략)
[8] Laudon, Kenneth C. & Laudon, Jane P.(2006) Management Information Systems: Organization and Technology(10th ed.). Macmillan Publishing Company, Inc.
[9] Lee, Gwang-hyeong. (2016). Two Track Industry Strategy and Two Job Changes, Service Korea Initiative Special Conference, The Society of Service Science, April 2016, pp.31-40 (이광형, Two Track 산업 전략과 2대 일자리 변화, 서비스강국코리아 특 별 세미나 자료집, 2016.4.28., pp31-40)
[10] Ministry of Science, ICT and Future Planning.
(2016). Intelligent Information Society in Response to the Fourth Industrial Revolution (미래창조과학 부, (2016), 제4차 산업혁명에 대응한 지능정보사회 중장기 종합대책)
[11] OECD STAN(2017), https://stats.oecd.org
[12] World Economic Forum (2016a). The Future of Jobs [13] World Economic Forum. (2016b). Extreme
automation and connectivity: The global, regional,
and investment implications of the Fourth Industrial Revolution
JeaYoung Kim([email protected])
JeaYoung Kim is a Business Consultant at jConsulting in Seoul, Korea. He received his Master’s degree in Information and Communication from the Konkuk University.
Currently he is pursuing the doctoral degree in Service Management at the Kookmin University.
Hyunsoo Kim([email protected])
Hyunsoo Kim is a Professor of Service Management at Kookmin University in Seoul, Korea. He majored in nuclear engineering at Seoul National Univeristy and acquired Master’s degree in management science from the Korea Advanced Institute of Science and Technology, and received his Ph.D. degree at the University of Florida with business administration major. Currently he serves as the chairman of the Society of Service Science, and the chairman of the Korea Research Institute of Service Industry as well as the Co-chairperson of Service Science National Forum.
Based on those experiences and knowledge on Service industry and academia, he devotes himself to the researches on Service Science and Service innovation.
An Analysis of Change in the Employment Structure Data Caused by the Industrial Revolution
JeaYoung Kim* · Hyunsoo Kim**
ABSTRACT
ㄴ
It is anticipated that the employment structure of the whole industry will change drastically as the Fourth Industrial Revolution era arrives. Particularly, there are numerous reseraches that the development of artifical intelligence will promote automation causing jobs in manufacturing industry to decrease; thus, the economy will be reorganized with service-centered jobs, which heavily depend on human ability. This study was conducted to verify the trend-forecasting model based on the theoretical analysis. We analyzed the change in employment structure over the past decades in each country and period to gain insights from the changes in the employment structure caused by the Fourth Industrial Revoltion. The results of this study are as follows: First, we investigaed whether the current economy is moving along the U-shaped model suggested by an existing researcher. As a result of the analysis, the data substantiated that the change of the employment structure is moving along the U-shaped model. It is also suggested that this U-shaped trend is expected to accelerate in the era of the Fourth Industrial Revolution. In the future, more accurate data analyses are needed to verify the model, and additional researches on the change in the employment structed is also needed.