1. Introduction
1) Purpose of the Study
The growth of a city is affected by the various endogenous and exogenous factors. Among those factors, industrial structure of a city is closely related to the growth of the city. As an exogenous
factor, the change of national economic structure also affects the growth of the city. However, the magnitude of such national economic effect depends on the industrial structure of the city; if a city is specialized in industrial sectors that have not been competitive in a national level, the city will be more affected by the national decline in those sectors. Therefore, examining how the changes in national industrial structure have influenced the
* Professor, Department of Geography Education, Cheongju University
Employment Growth and Industrial Change in Cheongju, 1985-2005:
An Analysis Using a Shift-Share Model
Hak-Hoon Kim*
Abstract: The population and employment of Cheongju have increased rapidly since the 1970s. This study examines the industrial employment change of Cheongju City and performs a shift-share analysis for the employment growth. The data used in this study are mainly from the 1985, 2000 and 2005 Census of Population and Housing. This study first explained the population change and industrial structure of Cheongju, then reviewed the development of shift-share models. Location quotients and specialization coefficients resulted from this study revealed the diversifying tendency in the urban industrial structure.
Shift-share analysis employing the modified Arcelus model elucidated the favorable industrial mix and the competitiveness of industrial sectors. As a whole, Cheongju has advantageous industrial structure in comparison with that of the nation. All sectors of Cheongju except several services sectors grew faster than those of the nation and showed positive competitive effects. It is suggested to utilize more disaggregated industrial data in more fractured subperiod in order to pinpoint the competitive industries.
Keywords: industrial structure, employment growth, shift-share model, competitiveness,
diversification
city and which sectors have led the city to growth and decline helps to illuminate the economic factors in urban growth. In order to study the economic factors in the growth of a city, we need to find the industrial sectors that are much related to the growth and decline of a city.
Most research in the topics of urban industrial structure has focused on the specialized urban functions and the differences in the industrial structure among cities. However, the evolution of urban characteristics in North America during the last few decades has already exhibited the diversifying and converging tendency in industrial structure among cities (Marshall, 1989; Kim, 1993).
In other words, the differences in the industrial structure among cities tend to diminish and the urban economies become more alike over time as the urban industrial structure become more diversified. Economic restructuring patterns since the 1960s seem to have contributed to reduce the specialization level in urban economic bases.
In relation to such topics as urban industrial structure and its changing characteristics, this study will examine two themes in the case of Cheongju City. The first theme pertains to the changes in the industrial structure of Cheongju City, and the second theme pertains to the application of a modified shift-share model to analyze the sectoral employment growth in Cheongju City.
2) Data and Methodology
This study examines the employment growth and industrial structural changes of Cheongju City, the seat of Choongchungbuk-do provincial government. Cheongju City is a typical case that has experienced rapid growth of the population
since the 1970s, and the industrial structure of the city has been much affected by the economic restructuring of South Korea.
This study first explains the population change and industrial structure of Cheongju using the population census data of South Korea. Then this study reviews the development of shift-share models and applies a shift-share model to analyze the changes in sectoral employment structure of Cheongju City.
The data for this study are mainly from the Census of Population and Housing of Korea compiled in 1985, 2000 and 2005. For the city level like Cheongju, the 2000 and 2005 census compiled the employment data in the system of 21 industrial sectors by the standard industrial classification, while the 1985 census compiled the employment data in the system of 9 industrial sectors. Thus the comparative analysis of industrial structure between 1985 and 2005 adopted the classification by the 9 industrial sectors. There was a shift-share analysis performed by Kim (2004) for Cheongju using the 1985 and 2000 data. However its contribution was limited because the census data with detailed industrial classification for a city such as the 21 sector classification were not available before 2000.
Although the data for the economic activities compiled in the census are based on the 10%
sample, those are valuable employment data collected from the residents of the statistical area.
On the other hand, the establishment survey that is
conducted every year compiles employment data
based on the establishment, which cannot fully
reflect the residence of the employees and
sometimes omit the self-employed farmers and
itinerant merchants.
2. Industrial Structure of Cheongju City
1) Population Growth
The population of Cheongju has increased rapidly since the 1970s. Table 1 and Figure 1 shows that its population in 1970 was 143,944, but the population in 2010 became 662,102, that is more than 4 times increase. Though the
administrative area of Cheongju City had been increased until 1990, the population has continued to increase after 1990 when its population reached about 500,000. Also the change of population density since 1970 shows the consistent pattern of population concentration into Cheongju. As is the population increase, the number of household has increased. However the average size of household has decreased steadily as is the national pattern.
The average household size of Cheongju was 2.77 in 2010, which is almost same as the nation’s that
Figure 1. Changes in population and household of Cheongju Table 1. Changes in population and household of Cheongju
Year 1970 1975 1980 1985 1990 1995 2000 2005 2010
143,944 192,734 252,985 350,175 497,429 520,046 586,700 642,805 666,924
26,667 38,743 52,898 83,981 117,378 155,989 179,676 217,941 241,058
5.40 4.97 4.78 4.17 4.24 3.33 3.27 2.95 2.77
84.98 84.98 84.98 114.82 153.55 153.55 153.55 153.55 153.55
1,694 2,268 2,977 3,050 3,240 3,387 3,821 4,186 4,343
Population (A) Household
(B) A/B
Area (km
2) Population Density (person/km
2)
Data: Statistics Korea, Census of Population and Housing, each year.
was 2.76 in 2010.
The background of such rapid population increase in Cheongju is as follows. (1) Cheongju has been a seat of a provincial government for a long time. (2) The Cheongju Industrial Complex was constructed during the 1970s. (3) Two express highways (Kyungbu expressway opened in 1970 and Joongbu expressway opened in 1987) connect Cheongju to Seoul to the north and to Busan to the south. (4) Four universities in Cheongju City
accommodate about 45,000 students. (5) Ochang Science Industrial Complex and Osong Health Science Complex constructed during the last decade are located in the adjacent Cheongwon County.
2) Industrial Structure
Industrial structure of Cheongju was examined using the 2005 Population and Housing Census.
* Utilities denote electricity, gas and water supply.
Data: Statistics Korea, 2005 Census of Population and Housing.
Table 2. Employment composition of Cheongju, 2005
Industry
Agriculture & Forestry 8,304 3.42 0.33
Fishing 10 0.00 0.01
Mining 139 0.06 0.54
Manufacturing 61,704 25.43 1.29
Utilities* 947 0.39 0.87
Construction 22,124 9.12 1.22
Trade 34,151 14.08 0.94
Accommodations & Restaurants 18,037 7.43 0.96
Transportation 10,205 4.21 0.91
Telecommunication 2,695 1.11 0.95
Finance and Insurance 8,125 3.35 1.02
Real Estates 5,012 2.07 0.86
Business Services 10,534 4.34 0.75
Public Administration 10,547 4.35 1.13
Education Services 22,600 9.32 1.38
Health & Social Services 10,778 4.44 1.23
Entertainment & Cultural Services 4,412 1.82 0.89
Repair and Personal Services 11,225 4.63 1.05
Household Services 795 0.33 1.22
International & Foreign Institutions 24 0.01 0.21
Unclassified 229 0.09 0.30
Total 242,597 100.00
Employment % LQ
Table 2 shows the employment composition of 20 industrial sectors of Cheongju in 2005, according to the 8
threvision of Korea Standard Industrial Classification. The industrial sector that employed the largest number is Manufacturing, which comprises 25.43%. The location quotient (LQ)
1)of manufacturing is 1.29, which implies Cheongju is relatively specialized in manufacturing. Especially, the Cheongju Industrial Complex is very important in manufacturing industry of Cheongju. As seen in Table 3, in 2008 the Cheongju Industrial Complex contained 12.1% of the total manufacturing establishments in Cheongju City, but hired 76% of the total manufacturing employees in Cheongju City. This is because there are large firms employing many workers in the Cheongju Industrial Complex.
The trade sector including wholesale and retail shows the second largest percentage (14.08%). In general, the trade function takes fundamental and largest portion in the service sector of most cities.
This is why the LQ of the trade sector of Cheongju is lower than 1. On the other hand, education services sector shows the third largest percentage (9.32%) and the highest LQ (1.38), which implies that the nickname of Cheongju, so-called
“educational city” is appropriate. As Cheongju is a provincial seat and the largest city in Choongbuk Province, public administration and health and
social services show high LQs (1.13 and 1.23).
Among services sectors, business services sector showed the lowest LQ (0.75), which implies Cheongju is short of business-related professional services.
3) Changes in Industrial Structure
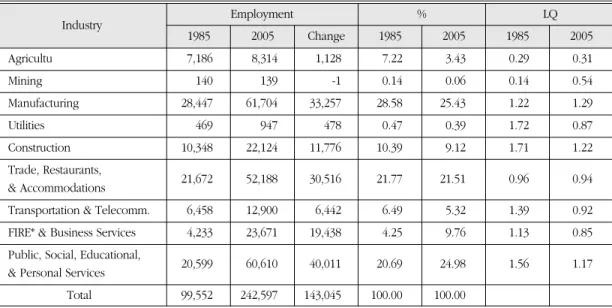
In order to find out the changes in industrial structure of Cheongju, employment data by industrial sectors compiled in the Population and Housing Census were compared. Table 4 shows that the changes in employment composition of 9 industrial sectors in Cheongju between 1985 and 2000. The total employment in Cheongju in 1985 was 99,552, and that in 2005 became 242,597, which is about 2.5 times increase. For the same time span, the population of Cheongju increased less than 2 times.
Industrial sectors showing the relatively large increase in employment (increase more than 30,000) are manufacturing, trade, restaurants and accommodations, and public, social, educational and personal services. The percentage of finance, insurance, real estate and business services increased from 4.25 in 1985 to 9.76 in 2005. In addition, the percentage of public, social, educational and personal services increased from 20.69% in 1985 to 24.98% in 2005, whereas Data: City of Cheongju, 2009, Statistical Yearbook.
Table 3. Cheongju Industrial Complex in manufacturing of Cheongju, 2008
Cheongju (A) 2,290 30,445
Cheongju Industrial Complex (B) 278 23,129
Percentage (B/A) 12.1% 76.0%
manufacturing establishments
Area manufacturing employees
manufacturing sector decreased from 28.58% to 25.43%. Such rapid increase of services sectors reflects the typical “services economy” trend.
In regard of the location quotients, 6 sectors showed LQ higher than 1 in 1985 while 3 sectors showed LQ higher than 1 in 2005. Among those sectors, only manufacturing sector showed the increase in LQ from 1.22 to 1.29. These changes in LQs seem to reflect the diversifying tendency in industrial structure of Cheongju, which indicates that the industrial structure of Cheongju become more similar to that of the nation.
The diversifying tendency can be verified by the coefficient of specialization
2). The coefficient of specialization of Cheongju for 1985 was 0.194 and that for 2005 was 0.111. This change indicates the industrial structure of Cheongju became more diversified than before.
3. Shift-Share Models
The shift-share models were formulated to provide a quantitative explanation of regional growth rates in sectoral employment compared to the national growth rates. In order to analyze the relationship between industrial structure and regional growth, many scholars have contributed to the development of the shift-share technique as a sophisticated analytical tool over several decades.
After Creamer (1942) initiated the shift-share analysis in order to explain the regional changes in the U.S. manufacturing, Dunn (1960) and others (Perloff, Dunn, Lampard and Muth, 1960) developed the classical shift-share model. Though there has been long-standing criticism of the shift- share analysis (Richardson, 1978a, 1978b), the technique has been popular with urban and
* FIRE denotes finance, insurance, and real estate.
Data: Statistics Korea, 1985 and 2005 Census of Population and Housing.
Table 4. Changes in industrial structure of Cheongju, 1985-2005
Agricultu 7,186 8,314 1,128 7.22 3.43 0.29 0.31
Mining 140 139 -1 0.14 0.06 0.14 0.54
Manufacturing 28,447 61,704 33,257 28.58 25.43 1.22 1.29
Utilities 469 947 478 0.47 0.39 1.72 0.87
Construction 10,348 22,124 11,776 10.39 9.12 1.71 1.22
Trade, Restaurants,
& Accommodations 21,672 52,188 30,516 21.77 21.51 0.96 0.94
Transportation & Telecomm. 6,458 12,900 6,442 6.49 5.32 1.39 0.92 FIRE* & Business Services 4,233 23,671 19,438 4.25 9.76 1.13 0.85 Public, Social, Educational,
& Personal Services 20,599 60,610 40,011 20.69 24.98 1.56 1.17
Total 99,552 242,597 143,045 100.00 100.00
Employment
1985 2005 Change 1985 2005 1985 2005
Industry % LQ
regional planners as well as regional economists and economic geographers. The development of shift-share models was well summarized in Kim (1993: 358-361). The following are the replicated reviews and modifications of the shift-share models summarized by Kim.
1) Classical Shift-Share Model
Given regional employment data by industrial sectors at two points in time, the classical shift- share model decomposes the regional employment change, d, into three components: national growth component, g, industry-mix (or proportional) component, m, and competitive (or differential) component, c.
Letting E
ijbe employment in industrial sector i of region j in the base year of the analysis, E
ij* be employment in sector i of region j in the terminal year, r
00be the change rate in national total employment between the base year and the terminal year, r
i0be the change rate in national employment in sector i, and r
ijbe the change rate in employment in sector i of region j, the traditional shift-share equation may be written as follows:
d
ij= g
ij+ m
ij+ c
ijwhere d
ij= E
ij* - E
ijg
ij= E
ijr
00m
ij= E
ij(r
i0- r
00) c
ij= E
ij(r
ij- r
i0).
In this equation, the national growth effect, g
ij, reflects the change in regional employment which would occur when the regional sector grows at the
same rate as the overall national employment. The industry-mix effect, m
ij, measures the amount of employment change attributable to the relative importance of the sector in the overall national economy. The competitive effect, c
ij, is the difference between the actual change in sectoral employment and the expected change that the region will experience when each regional industrial sector grows at the national rate of the same sector. The sum of the industry-mix and the competitive components, m
ij+ c
ij, is called the net shift.
If each of the shift-share components is summed over all sectors, the resulted sign of each component may indicate the direction of regional change compared to the national change. A positive industry-mix effect indicates that the region has a favorable growth mix of industries on balance (Plane, 1988: 267), and a positive competitive effect indicates that the region competes well on the whole (Herzog and Olson, 1977: 443).
There are two sources leading to the imperfection of this classical shift-share model: the weights on the base year and the interwoven effects between industry-mix and competitive components (Herzog and Olson, 1977: 443-444).
Since growth rates of all components in this model
are weighted by base year employment levels,
changes in regional industrial structure over the
study period cannot be reflected. Also, the
industry-mix and competitive effects are
interdependent because of technical linkages
among supplying sectors and induced multiplier
effects on service sectors (MacKay, 1968). Other
problems of this model can be the inaccuracy of
the model in the projection application and the
sensitivity of the model to the degree of industrial disaggregation.
2) Esteban-Marquillas Model
In an effort to solve the problem of interwoven effects of the competitive component, Esteban- Marquillas (1972) attempted to modify the classical shift-share model by introducing the concept of homothetic employment, Eˆ
ij, and separating the competitive effect, c
ij, into a pure competitive effect, c'
ij, and an allocation effect, a
ij. Letting E
0jbe total employment in region j in the base year, and E
i0and E
00each be national employment in sector i and national total employment in the base year, Esteban-Marquillas’ model can be specified as follows:
d
ij= g
ij+ m
ij+ c'
ij+ a
ijwhere Eˆ
ij= E
0j(E
i0/ E
00) c'
ij= Eˆ
ij(r
ij- r
i0) a
ij= (E
ij- Eˆ
ij)(r
ij- r
i0).
Homothetic employment, Eˆ
ij, is defined as “the employment that sector i of region j would have if the structure of the employment in such a region were equal to the national structure” (Esteban- Marquillas, 1972: 251). However, Herzog and Olson (1977) found that this refinement created another weighting problem. Since homothetic employment also refers to the base year, the allocation effect comprising the specialization component, (E
ij- Eˆ
ij), and the competitive advantage component, (r
ij- r
i0), does not give a reliable sign of change when the regional employment structure changes between the base
year and the terminal year.
3) Arcelus Model
In another effort to resolve the entangled effects in the competitive component, Arcelus (1984) further extended the shift-share model by subdividing the traditional competitive effect, c
ij, into the regional growth effect, Rg
ij, and the regional industry-mix effect, Rm
ij. Employing the homothetic employment concept of the Esteban- Marquillas model, he formulated the following model:
d
ij= g
ij+ m
ij+ Rg
ij+ Rm
ijwhere Rg
ij= Eˆ
ij(r
0j- r
00) +(E
ij- Eˆ
ij)(r
0j- r
00) Rm
ij= Eˆ
ij[(r
ij- r
0j) - (r
i0- r
00)] +
(E
ij- Eˆ
ij)[(r
ij- r
0j) - (r
i0- r
00)].
In this model, the regional growth effect, Rg
ij, which is the difference in total growth rates between region j and the nation, attempts to capture the component of the regional employment change in sector i which is attributable to the total growth of region j. The regional industry-mix effect, Rm
ij, which is the difference in sector i’s competitiveness between region j and the nation, attempts to measure that component of the regional employment change which is attributable to the regional industry mix.
In other words, the regional industry-mix effect
explains whether sector i enjoys a competitive
advantage in region j (Arcelus, 1984: 6).
4) Other Shift-Share Models
Berzeg (1978) formulated a stochastic linear model based on analysis of variance (ANOVA) so as to statistically test predictive hypotheses on the shift-share identity. His model can be specified as follows:
r
ij= a + b
i+ e
ijwhere a is an estimate of the national growth rate, r
00, and b
iis an estimate of the industry-mix rate, (r
i0- r
00). The competitive rate, (r
ij- r
i0), is estimated by a random error term, e
ij. As seen in the specification of the equation, growth rates instead of employment numbers are estimated in this model. This linear model can be transformed so as to estimate Arcelus’ extension model (Knudsen and Barff, 1991: 427).
The stochastic properties of these ANOVA-based models make it possible to test hypotheses for prediction and policy formulation. In spite of this advantage, the limitations of the ANOVA-based models are mainly due to the operational difficulties (Knudesen and Barff, 1991: 430). The stochastic shift-share models require system closure for the data set; if a study is concerned with a region of a nation, then all regions of the nation must be included in the data set.
Barff and Knight (1988) developed a dynamic shift-share approach in order to solve the problem of weights of the classical shift-share model. Since the classical static approach uses employment structure of the base year to calculate changes over to the terminal year, it cannot explain continuous changes in regional total employment and industrial mix over the time period. This problem
was eliminated by using the annual employment data which enable to adjust the shift-share components annually for changes in industrial structure (Barff and Knight, 1988). Since annual employment data based on the establishment survey are now available, the task of calculating annual shift-share components has become easier.
However the problem of such establishment-based data is that they cannot fully reflect the residence of the employees.
Rigby and Anderson (1993) extended the shift- share model by adopting output effect and labor productivity effect. Since significant increase of labor productivity may lead to decrease in employment level, Rigby and Anderson separated output and productivity effects on employment level.
4. Shift-Share Analysis of Employment Growth
In order to examine the effects of the national
economic structure on changes in employment
structure of Cheongju and the sectoral
competitiveness of Cheongju, this study employed
a shift-share model modified from the Arcelus
model. Other shift-share models than the Arcelus
model were not appropriate for this study since the
ANOVA-based model requires system closure for
the data set and the dynamic shift-share model
requires annual employment data. However
Arcelus’ original model was specified using the
homothetic employment terms that create
additional problem of weights as seen in the
Esteban-Marquillas model. Thus this study adopted
a shift-share model that eliminated the homothetic employment terms from Arcelus' model. The model is as follows:
d
ij= g
ij+ m
ij+ Rg
ij+ Rm
ijwhere Rg
ij= E
ij(r
0j- r
00)
Rm
ij= E
ij[(r
ij- r
0j) - (r
i0- r
00)]
This model does not include the misleading homothetic employment terms, so the utility of this model is enhanced by simpler calculation and easier interpretation of the terms: regional growth effect (Rg
ij) and regional industry-mix effect (Rm
ij).
The data set consists of employment data of 9 industrial sectors for Cheongju and the nation compiled from the 1985 and 2005 Census of Population and Housing. Additionally, the data set composed of employment data of 21 industrial
sectors for Cheongju and the nation compiled from the 2000 and 2005 Census of Population and Housing was analyzed in order to explain more specific employment growth effects. For the 1985 Census, the city-level employment data are available only in the industrial classification system of 9 sectors.
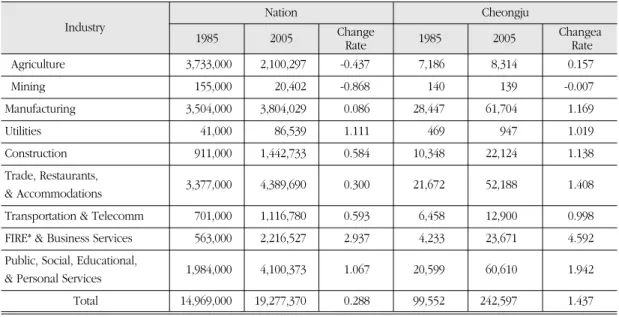
Table 5 shows changes in sectoral employment of the nation and Cheongju from 1985 to 2005. The total employment of Cheongju increased with the change rate of 1.437 which is much higher than 0.288 of the national change. Also the employment of Cheongju in all industrial sectors except utilities sector increased with the rates higher than those of the nation. Industrial sectors of Cheongju showing higher change rates than 1.437 are FIRE & business services and public, social, educational, & personal services. Especially, FIRE & business services shows the highest change rate, 4.592, that is much
* FIRE denotes finance, insurance, and real estate.
Data: Statistics Korea, 1985 and 2005 Census of Population and Housing.
Table 5. Changes in sectoral employment of nation and Cheongju, 1985-2005
Agriculture 3,733,000 2,100,297 -0.437 7,186 8,314 0.157
Mining 155,000 20,402 -0.868 140 139 -0.007
Manufacturing 3,504,000 3,804,029 0.086 28,447 61,704 1.169
Utilities 41,000 86,539 1.111 469 947 1.019
Construction 911,000 1,442,733 0.584 10,348 22,124 1.138
Trade, Restaurants,
& Accommodations 3,377,000 4,389,690 0.300 21,672 52,188 1.408 Transportation & Telecomm 701,000 1,116,780 0.593 6,458 12,900 0.998 FIRE* & Business Services 563,000 2,216,527 2.937 4,233 23,671 4.592 Public, Social, Educational,
& Personal Services 1,984,000 4,100,373 1.067 20,599 60,610 1.942
Total 14,969,000 19,277,370 0.288 99,552 242,597 1.437
Nation
1985 2005 1985 2005
Industry
Cheongju Change
Rate
Changea
Rate
higher than 2.937 of the same sector of the nation.
For the nation, industrial sectors showing change rates higher than 0.288, that is the national average, are all service sectors, and agriculture, mining, and manufacturing sectors show change rates lower than the national average. For the nation, agriculture and mining sectors lost employment, while agriculture sector of Cheongju gained employment and mining sector of Cheongju lost only one person. These changes in Cheongju are mainly due to the expansions of the administrative boundary of Cheongju in 1987 and 1990, which embraced the population in countryside of Cheongwon County.
Table 6 summarizes the results of shift-share analysis of employment growth between 1985 and 2005 in Cheongju. The total employment change between 1985 and 2005 was 143,045 and the
change can be divided into three components:
national growth effect, industry-mix effect, and competitive effect. The national growth effect (g
ij) can be explained as follows. The national growth rate (0.288) between 1985 and 2005 induced the employment growth in each sectors with the same rate, and the total growth effect resulted in the employment increase of 28,653.
In regard of the industry-mix effect (m
ij), agriculture, mining, and manufacturing sectors showed negative effects, because the growth rates of those sectors of the nation were lower (or slower) than the national average growth rate (0.288). However, since all other sectors showed positive effects, which means that the growth rates of those sectors of the nation were higher (or faster) than the national average, the total industry- mix effect resulted in 21,814. This means that as a
* d = g + m + c
** Rg = regional growth effect
*** Rm = regional industry-mix effect)
Table 6. Shift-share analysis of employment growth in Cheongju, 1985-2005
Agriculture 1,128 2,068 -5,211 4,271 8,257 -3,986 -940
Mining -1 40 -162 121 161 -40 -41
Manufacturing 33,257 8,188 -5,752 30,821 32,688 -1,866 25,069
Utilities 478 135 386 -43 539 -582 343
Construction 11,776 2,978 3,062 5,736 11,891 -6,154 8,798
Trade, Restaurants,
& Accommodations 30,516 6,238 261 24,017 24,903 -886 24,278
Transportation & Telecomm. 6,442 1,859 1,972 2,612 7,421 -4,809 4,583 FIRE & Business Services 19,438 1,218 11,214 7,006 4,864 2,142 18,220 Public, Social, Educational,
& Personal Services 40,011 5,929 16,045 18,038 23,670 -5,632 34,082
Total 143,045 28,653 21,814 92,578 114,392 -21,814 114,392
Change (d)*
National growth effect (g)
Industry- mix effect (m)
Industry Competitive effect
Total (c) Rg** Rm***
Net
shift
(m+c)
whole Cheongju has advantageous industrial structure in comparison with the industrial structure of the nation.
For the competitive effect (c
ij), only utilities sector showed negative effect because its growth rate in Cheongju (1.019) was lower than that of the nation (1.111). Since all other sectors of Cheongju grew faster than those of the nation, they were competitive enough to result in the total employment increase of 92,578. Most competitive sector in terms of the effect is manufacturing which showed the competitive effect of 30,821.
The competitive effect can be divided into two components: regional growth effect and regional industry-mix effect. The regional growth effect (Rg
ij) reflects the difference in total growth rates between Cheongju (1.437) and the nation (0.288), and the employments of all sectors in Cheongju increase with the same rate (1.149). This regional growth effect resulted in 114,392.
The regional industry-mix effect (Rm
ij) reflects the difference in competitiveness of each sector between Cheongju and the nation. After removing the national sectoral competitiveness from the sectoral competitiveness of Cheongju, only one sector (finance, insurance, real estate, and business services) showed purely positive effect (2,142). The total regional industry-mix effect ended with - 21,814. Thus the fact that the competitive effect showed positive number (92,578) is mainly due to the total employment of Cheongju growing faster than the national total employment.
The net shift is the sum of industry-mix effect and competitive effect, and reflects the advantageous position in industrial structure of a region in comparison with that of a nation.
Though agriculture and mining showed negative
effects in the net shift, all other sectors displayed positive net shifts. Especially public, social, educational, and personal services sector shows highest effect of the net shift (34,082).
In order to explain the shift-share effects in more disaggregated industrial sectors and more recent subperiod, this study analyzed employment data of 21 industrial sectors for Cheongju and the nation compiled from the 2000 and 2005 Census of Population and Housing using the same shift-share model as specified before. Table 7 shows the results of shift-share analysis of employment growth between 2000 and 2005 in Cheongju.
As seen in Table 7, the total employment change between 2000 and 2005 was 26,518 and the change is attributed to the national growth effect of 9,615, the industry-mix effect of 2,764, and the competitive effect of 14,139. The competitive effect is entirely attributable to the regional growth effect (Rg) that is 16,903, since the regional industry-mix effect (Rm) shows negative number. This high regional growth effect in the competitive component reflects the difference in the total growth rates between Cheongju (0.123) and the nation (0.044), which is 0.079.
Though the total regional industry-mix effect (Rm) resulted in negative effect, such sectors as agriculture, manufacturing, business services, health and social services show high positive regional industry-mix effects. These sectors are considered to be purely competitive because their regional industry-mix effects were calculated by subtracting the national sectoral competitiveness from the sectoral competitiveness of Cheongju.
The net shifts of such sectors as agriculture,
manufacturing, construction, business services,
education services, health and social services are
relatively high. In agriculture, the employment of Cheongju increased from 6,819 to 8,304 between 2000 and 2005, while the national employment declined. Also in manufacturing, the employment of Cheongju increased from 56,552 to 61,704 between 2000 and 2005, while the national employment decreased. Thus agriculture and manufacturing sectors are considered to be competitive in spite of the negative industry-mix effects. Contrarily, business services and health &
social services shows highly positive effects in all shift-share components, and construction sector show positive effects in all shift-share components except the regional industry-mix effect.
Education services sector shows high positive effect in the net shift, but negative effect in the regional industry-mix component. This is because, while the employment of that sector grew from 20,497 to 22,600 between 2000 and 2005, its growth rate (0.103) was lower than that of the Table 7. Shift-share analysis of employment growth in Cheongju, 2000-2005
Agriculture & Forestry 1,485 303 -1,165 2,346 533 1,813 1,182
Fishing -44 2 -13 -33 4 -37 -46
Mining -55 9 -45 -19 15 -34 -64
Manufacturing 5,152 2,516 -4,231 6,867 4,424 2,443 2,636
Utilities 107 37 -13 83 66 17 70
Construction 2,784 861 452 1,472 1,513 -41 1,923
Trade 1,799 1,440 -1,473 1,833 2,531 -698 359
Accommodations & Restaurants 524 779 705 -960 1,370 -2,330 -255
Transportation 227 444 -360 143 781 -637 -217
Telecommunication 129 114 -97 112 201 -89 15
Finance and Insurance -873 400 -1,074 -199 704 -903 -1,273
Real Estates 1,067 176 1,361 -470 309 -778 891
Business Services 3,847 298 2,322 1,228 523 705 3,549
Public Administration 783 434 246 102 764 -662 349
Education Services 2,103 912 2,423 -1,232 1,603 -2,836 1,191
Health & Social Services 5,295 244 3,122 1,929 429 1,501 5,051
Entertainment & Cultural Services 790 161 468 161 283 -122 629
epair and Personal Services 1,072 452 322 298 794 -496 620
Household Services 75 32 -223 266 56 209 43
International & Foreign Institutions 23 0 0 23 0 23 23
Unclassified 228 0 39 189 0 189 228
Total 26,518 9,615 2,764 14,139 16,903 -2,764 16,903
Change (d)*
National growth effect (g)
Industry- mix effect (m)
Industry Competitive effect
Total (c) Rg Rm
Net
shift
(m+c)
nation (0.163). Though the location quotient (LQ) of the education services sector was highest (1.38) among all sectors of Cheongju in 2005 as seen in Table 2, the LQ of that sector was higher (1.56) in 2000. This implies that the position of Cheongju as an “educational city” was weakened.
Finance and insurance sector shows negative net shift and its employment decreased from 8,998 to 8,125 between 2000 and 2005, while finance, insurance, real estate, and business services showed highly positive effects in all shift-share components between 1985 and 2005. Even the national employment of finance and insurance sector decreased between 2000 and 2005, which resulted in the negative industry-mix effect.
By way of the breakdown of industrial sectors in detail and shorter time span of the study, the shift- share analysis can show different patterns of the employment growth effects. Therefore, more disaggregated industrial classification and more fractured subperiod are encouraged for a shift- share analysis.
5. Conclusions
In regard of the change of the urban industrial structure, this study examined the industrial employment change of Cheongju City and performed the shift-share analysis for the employment growth. The data used in this study are mainly from the 1985, 2000 and 2005 Population and Housing Census. Since these data are based on the residence, not the establishment, they are useful to analyze the industrial structure of a city that reflects its residents’ characteristics.
The population of Cheongju has increased rapidly since the 1970s. The reasons of such population increase are the construction of Cheongju Industrial Complex, the opening of Kyungbu and Joongbu expressways, four universities in Cheongju City, and the construction of Ochang Science Industrial Complex and Osong Health Science Complex during the last decade.
The industrial sector that employed the largest number is manufacturing, which comprises 25.43%
in 2005, and the Cheongju Industrial Complex hired 76.0% of the total manufacturing employment in Cheongju. The analysis of location quotient (LQ) revealed that the education services sector of Cheongju shows the highest LQ, which implies that the nickname of Cheongju, so-called
“educational city,” is appropriate.
Industrial sectors showing the relatively large increase in employment from 1985 to 2005 are manufacturing, trade, restaurants and accommodations, and public, social, educational and personal services. Finance, insurance, real estate, and business services showed the highest growth rate in both Cheongju and the nation.
The location quotients and the coefficients of specialization resulted from this study revealed the converging tendency toward the national average of the urban industrial structure by diversification, as mentioned by Marshall (1989: 134). The result indicates the industrial structure of Cheongju became more diversified than before. This phenomenon seems to be due to the spread of service economy in the postindustrial society.
The effects of the national economic structure on
changes in employment structure of Cheongju and
the sectoral competitiveness of Cheongju were
examined by employing a shift-share model
modified from the Arcelus model. The Shift-share model elucidated the pure competitiveness of each industrial sector by subdividing the competitive effect into the regional growth effect and regional industry-mix effect. As a whole, Cheongju has advantageous industrial structure in comparison with that of the nation. All sectors of Cheongju except the utilities sector grew faster than those of the nation and showed positive competitive effects.
The industrial sector showing the highest effect in the competitive component was manufacturing, which indicates that the manufacturing sector is still important for the employment growth of Cheongju.
The shift-share analysis employing more disaggregated industrial sectors and more recent subperiod showed different patterns of industrial growth components. Such sectors as agriculture, manufacturing, business services, health and social services show high positive regional industry-mix effects. Education services sector shows high positive effect in the net shift, but its growth rate is lower than that of the nation. This implies that the position of Cheongju as an “educational city” was recently weakened.
From this study, it is concluded that the shift- share analysis is useful to find out the competitive industry for the regional development, and it is suggested to utilize more disaggregated industrial data in more fractured subperiod in order to pinpoint the competitive or declining industries.
Notes
1) The location quotient (LQ) is a criterion that shows the specialization level of each industry by comparing the region’s industrial composition with the national industrial composition. The location quotient of i industry of a region (R), LQ
i, as follows:
LQ
i= =
2) The coefficient of specialization for a region (or a city), S, can be formulated as follows:
S=10
-2( ∑ |R
i– N
i|)
where R
iis the percentage which industrial sector i makes up in the total employment of a region and N
iis the percentage which industrial sector i makes up in the total employment of a nation (Florence et al., 1943;
Marshall, 1975; Hoover and Giarratani, 1984: 262-263).
Here, a coefficient of zero indicates perfect diversification and a coefficient of 1 (or 100 %) indicates perfect specialization.
References
Arcelus, Francisco J., 1984, “ An extension of shift-share analysis,” Growth and Change 15(1), pp.1-8.
Barff, R. A., and Knight III, P. L., 1988, “ Dynamic shift- share analysis,” Growth and Change 19(2), pp.1-10.
Berzeg, Korhan, 1978, “ The empirical content of shift-share analysis,” Journal of Regional Science 18(3), pp.463- 469.
City of Cheongju, 2009, Statistical Yearbook.
Creamer, Daniel, 1943, “ Shifts of manufacturing industries,”
Industrial Location and National Resources, National Resources Planning Board, Washington: U.S.
Government Printing Office, Chapter 4, pp.85-104.
n i=1
Regional employment in i industry Regional total employment National employment in i industry
National total employment R
iR R
iR
Dunn, E. S., 1960, “ A statistical and analytical technique for regional analysis,” Papers of the Regional Science Association 6, pp.97-112.
Esteban-Marquillas, J. M., 1972, “ A reinterpretation of shift- share analysis,” Regional and Urban Economics 2(3), pp.249-261.
Florence, P. S., Fritz, W. G. and Gilles, R. C., 1943,
“ Measures of industrial distribution,” Industrial Location and National Resources, National Resources Planning Board, Washington: U.S. Government Printing Office, Chapter 5, pp.105-124.
Herzog, H. W., and Olsen, R. J., 1977, “ Shift-share analysis revisited: The allocation effect and the stability of regional structure,” Journal of Regional Science 17(3), pp.441-454.
Hoover, Edgar M., and Giarratani, Frank, 1984, An Introduction to Regional Economics. (3rd ed.) New York: Knopf.
Kim, Hak-Hoon, 1993, “ Urban industrial structure and diversification: Converging trend among urban economies,” Journal of the Korean Geographical Society 28(4), pp.356-378.
Kim, Hak-Hoon, 2004, “ Industrial structural change and employment growth in Cheongju City: An application of shift-share model,” The Journal of Science and Arts 2, Cheongju Uiversity, pp.549-570 (in Korean).
Knudsen, D. C., and Barff, R., 1991, “ Shift-share analysis as a linear model,” Environment and Planning A 23, pp.421-431.
MacKay, D. I., 1968, “ Industrial structure and regional growth: A methodological problem,” Scottish Journal of Political Economy 15, pp.129-142.
Marshall, John U., 1975, “ City size, economic diversity, and functional type: The Canadian case,” Economic
Geography 51, pp.37-49.
Marshall, John U., 1989, The Structure of Urban Systems, Toronto: University of Toronto Press.
Parr, J. B.,1965, “ Specialization, diversification and regional development,” The Professional Geographer 17(6), pp.21-25.
Perloff, H. S., Dunn, E. S., Lampard, E. E., and Muth, R. F., Regions, Resources, and Economic Growth, Baltimore:
Johns Hopkins University Press, 1960.
Plane, D. A., 1989, “ Population migration and economic restructuring in the United States,” International Regional Science Review 12(3), pp.263-280.
Richardson, Harry W., 1978a, “ The state of regional economics: A survey article,” International Regional Science Review 3(1), pp.1-48.
Richardson, Harry W., 1978b, Regional and Urban Economics, Harmondsworth, England: Penguin Books.
Rigby, D. L., and Anderson, W. P., 1993, “ Employment change, growth, and productivity in Canadian manufacturing: An extension and application of shift- share analysis,” Canadian Journal of Regional Science 16(1), pp.69-88.
Statistics Korea, 2011, www.kosis.kr.
Correspondence: Hak-Hoon Kim, Department of Geography Education, Cheongju University, Cheongju, 360-764, Tel: +82-43-229-8598, e-mail:
[email protected]
교신: 김학훈, 360-764, 충북 청주시 상당구 내덕동 36, 청 주대학교 지리교육과, 전화: 043-229-8598, 이메일:
[email protected]
최초투고일 2011년 6월 25일
최종접수일 2011년 7월 26일
청주의 고용 성장과 산업 변화, 1985-2005:
변이할당모형에 의한 분석
김학훈*
요약`: 청주시는 1970년대부터 인구와 고용이 급성장하였다. 본 연구는 청주시의 산업별 고용변화를 조사하고 고용성장에 대한 변이 할당 분석을 시행하였다. 본 연구에서 사용한 자료는 주로 1985년, 2000년, 2005년의 인구 및 주택 총조사에서 얻은 청주시의 산업 별 고용자료이다. 본 연구는 먼저 청주의 인구 변화와 산업구조를 설명하고, 그 다음은 변이할당모형의 발달을 검토하였다. 본 연구에 서 얻은 청주의 산업별 입지계수와 특화계수의 변화를 통해서 도시산업구조의 다양화 추세를 알 수 있었다. 본 연구에 적용한 변이할 당모형은 Arcelus의 모형을 수정하여 사용하였으며, 분석 결과를 통해서 산업 부문별 경쟁력을 파악할 수 있었다. 청주는 국가 전체 와 비교하면 대체로 유리한 산업구조를 가지고 있다. 일부 서비스 부문을 제외한 모든 산업 부문에서 국가보다 빨리 성장하여 양(+)의 경쟁효과를 보였다. 변이할당분석에서 세분된 산업분류와 짧게 나누어진 분석기간을 사용하면 경쟁력 있는 산업을 더 정확하게 찾을 수 있다.
주요어