ABSTRACT
Objective: This study was conducted to estimate the incidence of cardiovascular disease
(CVD) independently from low-density lipoprotein (LDL) cholesterol according to triglyceride (TG) levels in young adults.
Methods: Subjects aged 30–49 years with data from routine health check-ups provided by
the National Health Insurance Service during 2009 were selected. The primary outcome was incident CVD, defined as a composite of ischemic heart disease and ischemic stroke during the follow-up period from 2009 to 2018.
Results: The mean age of study subjects (n=1,823,537) was 40.1±5.7 years, and the median
follow-up period was 8.3 years. The quartiles of serum TG levels at the baseline were calculated: Q1, <74 mg/dL; Q2, 74–108 mg/dL; Q3, 109–166 mg/dL; and Q4: >166 mg/dL.
The highest quartile of TG levels (Q4) had a significantly higher risk of the primary outcome than Q1 (hazard ratio [HR], 2.40 [95% confidence interval; CI, 2.33–2.47]). Q2 and Q3 also experienced the primary outcome more frequently than Q1 (HR, 1.37 [95% CI, 1.33–1.42]
and HR, 1.80 [95% CI, 1.75–1.86], respectively). Even after adjustment for age, sex, obesity, alcohol drinking amount, smoking, LDL cholesterol, diabetes mellitus, hypertension, lipid- lowering medication use, and family history of CVD, there was a significant dose-response relationship between TG quartiles and the risk of the primary outcome (HR per quartile, 1.13 [95% CI, 1.12–1.14]).
Conclusion: In conclusion, in the Korean population aged 30–49 years, high TG levels
independently increased future CVD risk in both men and women.
Keywords:
Cardiovascular diseases; Triglycerides; Insurance claims analysis
INTRODUCTION
Conflicting data have been reported regarding whether plasma triglyceride (TG) levels increase the risk of cardiovascular disease (CVD) and mortality independently from low- density lipoprotein (LDL) cholesterol.
1,2Although TG-lowering therapy failed to improve
Original Article
Received: Oct 27, 2020 Revised: Dec 2, 2020 Accepted: Dec 9, 2020 Correspondence to Min Kyong Moon
Division of Endocrinology, Department of Internal Medicine, Seoul Metropolitan Government Boramae Medical Center, 20 Boramae-ro 5-gil, Dongjak-gu, Seoul 07061, Korea.
E-mail: [email protected]
Copyright © 2021 The Korean Society of Lipid and Atherosclerosis.
This is an Open Access article distributed under the terms of the Creative Commons Attribution Non-Commercial License (https://
creativecommons.org/licenses/by-nc/4.0/) which permits unrestricted non-commercial use, distribution, and reproduction in any medium, provided the original work is properly cited.
ORCID iDs Bo Kyung Koo
https://orcid.org/0000-0002-6489-2656 Min Kyong Moon
https://orcid.org/0000-0002-5460-2846 Funding
The current study was funded by the Korean Society of Lipid and Atherosclerosis (KSoLA) 2019 and supported by the NHIS (NHIS-2020- 4-101).
Conflict of Interest
The authors have no conflicts of interest to declare.
Bo Kyung Koo ,
1,2SangHyun Park,
3Kyung-Do Han,
3Min Kyong Moon
1,21Department of Internal Medicine, Seoul National University College of Medicine, Seoul, Korea
2 Division of Endocrinology, Department of Internal Medicine, Seoul Metropolitan Government Boramae Medical Center, Seoul, Korea
3Department of Medical Statistics, College of Medicine, The Catholic University of Korea, Seoul, Korea
Hypertriglyceridemia Is an Independent Risk Factor for
Cardiovascular Diseases in Korean Adults Aged 30–49 Years:
a Nationwide Population-Based Study
Author Contributions
Conceptualization: Koo BK, Moon MK; Data curation: Park S, Han KD; Formal analysis:
Park S, Han KD; Funding acquisition: Koo BK;
Investigation: Koo BK, Park S, Han KD, Moon MK; Methodology: Koo BK, Park S, Han KD;
Project administration: Moon MK; Resources:
Han KD; Software: Han KD; Supervision: Moon MK; Writing - original draft: Koo BK; Writing - review & editing: Koo BK, Moon MK.
cardiovascular mortality,
3-5it reduced the event rate of myocardial infarction (MI) and reperfusion therapy.
3,4In addition, it brought an additional benefit to statins for protection against CVD in patients with diabetes who had hypertriglyceridemia.
5Ethnic differences in plasma TG levels have been reported, and the Korean population shows higher fasting plasma TG levels than Caucasian populations.
6However, sparse data have been reported on the effect of hypertriglyceridemia on CVD risk in the Korean population.
Only a single-center general health checkup—based study showed that plasma TG level 150 mg/dL or more increased the risk of CVD during 3 years of follow-up.
7However, as all adults aged ≥20 years were included in that study (mean age, 48 years),
7their findings cannot be extrapolated to a specific age group such as young adults. Age is a strong independent risk factors for CVD, and lipid levels are dependent on age and sex in both the Korean population
8and Caucasian populations.
9Considering the importance of the economic activity of young adults, as well as the effect of metabolic disorders in young adulthood on later life for each individual,
10we focused on adults aged 30–49 years.
The National Health Insurance Service (NHIS) in Korea was initiated in 1977 and achieved universal coverage of the population by 1989. The NHIS covers the claims of 97% of the population in Korea; those of the remaining 3% of the population are covered by the Medical Aid Program. Accordingly, the NHIS database contains information on almost a full range of demographic and socioeconomic data, as well as insurance claims (including prescribed medications and procedures) for the Korean population of approximately 50 million.
11The present study was performed to estimate the incidence of CVD according to TG level in the entire population of adults aged 30–49 years in South Korea using the NHIS database from 2009 to 2018.
MATERIALS AND METHODS
1. Data collection
We used the NHIS database between January 1, 2009 and December 31, 2009. After de- identification, the NHIS provided data including age, sex, diagnosis, date of hospital visits, drug prescriptions received during inpatient and outpatient visits, hospital admissions, medical procedures, and emergency department visits. Drug information included the brand name, generic name, prescription date, and duration and route of administration. Diagnoses were coded according to the International Classification of Disease (10th revision; ICD-10).
As the NHIS offers national health examination programs biennially, the database also included body measurements, laboratory results, and additional information on smoking status, alcohol drinking habits, and menopausal status from self-reported questionnaires.
12The dates of death of the participants in routine health check-ups provided by the NHIS were retrieved from National Death Registry by the Korea National Statistical Office. The study was approved by the Boramae Medical Center Institutional Review Board (IRB No.07-2020-033).
2. Study subjects
Adults aged 30–49 years who underwent routine health check-ups provided by the NHIS
during 2009 were selected for the analysis (n=1,920,731). After the exclusion of individuals
with insufficient data on clinical parameters including lipid profile (n=77,239), a previous
history of ischemic stroke or ischemic heart disease (IHD) (n=15,476), or a follow-up duration
less than 1 year (n=4,479), 1,823,537 subjects were included.
Serum TG levels were retrieved from the health check-up database provided by the NHIS, and hypertriglyceridemia was defined as TG ≥150 mg/dL.
13The quartiles of serum TG level were also calculated, with Q1 and Q4 being the lowest and highest quartiles of TG levels, respectively.
Hypertension was defined as a blood pressure ≥140/90 mmHg or use of an antihypertensive medication under ICD-10 codes I10–13 and I15. Cases of diabetes mellitus were defined as subjects who were users of anti-diabetic medications, including insulin, under ICD-10 codes E11–14 at the point of the survey or had 8-hour fasting plasma glucose levels that were ≥126 mg/dL. Dyslipidemia was defined as total cholesterol ≥240 mg/dL or use of cholesterol- lowering agents under the ICD-10 code E78.
Based on the self-reported questionnaire, participants were classified according to their alcohol drinking habits into 3 groups: non-drinkers, mild drinkers (daily alcohol intake
<30 g/day), and heavy drinkers (daily alcohol intake ≥30 g/day). Smoking history and family history of CVD were also assessed by self-reported questionnaires.
3. Study outcomes
The primary outcome was incident ischemic CVD, defined as a composite of IHD and ischemic stroke, during the follow-up period from 2009 to 2018. The secondary outcomes were MI and overall mortality, as well as each composite outcome of IHD and ischemic stroke. IHD and MI were diagnosed using hospitalization with the primary diagnostic ICD-10 codes I20–25 and I21–22, respectively.
14Ischemic stroke was defined as hospitalization under ICD-10 codes I63–64 and having brain imaging such as computed tomography and magnetic resonance imaging during the admission. A previous history of IHD and MI was diagnosed using the codes I20–25 and I21–22, with more than 1 diagnosis during admission or at outpatient clinics, respectively.
14The wash-out period for defining incident cases was 2002–2008.
4. Statistical analysis
All data were analyzed using SAS version 9.3 (SAS Institute Inc., Cary, NC, USA) and R version 3.1.2 (The R Foundation for Statistical Computing, Vienna, Austria, http://www.R- project.org). To compare subjects' clinical characteristics according to the primary outcome, the Mood median test or analysis of variance for continuous variables and the chi-square test for categorical variables were used. The hazard ratio (HR) and 95% confidence interval (CI) for primary outcomes were calculated by multivariable Cox proportional hazards regression analysis. The variables incorporated in the Cox proportional hazards regression analysis were selected based on well-known factors affecting TG levels and CVD.
1,2,5,15The HR of primary outcomes according to each quartile of serum TG level was compared to the lowest quartile, and trends in the HR according to the quartile of serum TG levels were also investigated.
Since male sex and the presence of diabetes are major factors determining TG levels,
16,17stratified analyses according to sex and diabetes status were performed. p-values <0.05 were considered to indicate statistical significance.
RESULTS
1. Baseline characteristics
The mean age of the study subjects (n=1,823,537) was 40.1±5.7 years, and the median follow-
up period was 8.3 years (interquartile range, 8.1–8.5 years). The quartiles of serum TG levels
at the baseline were calculated (Q1, <74 mg/dL; Q2, 74–108 mg/dL; Q3, 109–166 mg/dL; Q4,
>166 mg/dL). In both sexes, mean age, body mass index (BMI), and LDL cholesterol levels increased as TG levels increased (p<0.001 for all; Table 1). Significant positive associations were also found between TG quartiles and current smoking, alcohol drinking amount, and family history of CVD (p<0.001 for all; Table 1).
During the follow-up period, the primary outcome was detected in 39,657 subjects (IHD, 33,509 cases; ischemic stroke, 7,292 cases; Supplementary Tables 1 and 2), and overall mortality was found in 17,030 subjects. Subjects with the primary outcome were significantly older (42.9±5.0 years vs. 40.0±5.7 years; p<0.001) and male-predominant (71.8% vs. 61.5%;
p<0.001) compared to those without the primary outcome. They had higher prevalence of obesity (44.1% vs. 32.1%), diabetes mellitus (11.8% vs. 4.5%), and current smoking (42.8% vs. 32.6%; Supplementary Table 1). Although use of lipid-lowering agents was more common in subjects with the primary outcome, those subjects had significantly higher total cholesterol, TG, and LDL cholesterol levels and lower high-density lipoprotein cholesterol levels than subjects without the primary outcome (p<0.001 for all; Supplementary Table 1).
2. Incidence of CVD and mortality according to TG levels
In crude analysis, the highest quartile of TG levels (Q4) had a significantly higher risk of the primary outcome than Q1 (HR, 2.40 [95% CI, 2.33–2.47]; p<0.001). In addition, Q2 and Q3 also experienced the primary outcome more frequently than Q1 (HR, 1.37 [95% CI, 1.33–1.42]; and HR, 1.80 [95% CI, 1.75–1.86], respectively; Table 2). Even after adjustment for age, sex, obesity, alcohol drinking amount, smoking, LDL cholesterol, diabetes mellitus,
Table 1. Baseline characteristics according to TG levelsCharacteristics Men Women
Q1 Q2 Q3 Q4 p for
trend Q1 Q2 Q3 Q4 p for
trend Median TGs (mg/dL)* 60 (51–67) 91 (82–100) 134 (121–149) 233 (194–305) <0.001 56 (47–65) 88 (80–98) 129 (118–144) 210 (184–262) <0.001
Age (yr) 38.7±5.8 39.1±5.8 39.4±5.7 39.7±5.5 <0.001 40.4±5.5 41.5±5.4 42.1±5.2 42.5±5.2 <0.001
Body mass index (kg/m2) 22.7±2.7 23.5±2.9 24.4±3.0 25.5±3.0 <0.001 21.8±2.7 22.7±3.0 23.7±3.3 24.82±3.58 <0.001 Current cigarette smoker 70,561 (42.4) 117,935 (47.5) 163,476 (50.9) 222,469 (57.0) <0.001 7,510 (2.6) 7,358 (3.5) 5,900 (4.5) 3,920 (5.9) <0.001
Alcohol drinking history <0.001 <0.001
None 52,608 (31.6) 72,999 (29.4) 87,696 (27.3) 91,036 (23.3) 194,335 (67.4) 143,445 (68.4) 91,774 (69.2) 46,990 (70.1) Mild (<30 g/day) 97,154 (58.4) 146,681 (59.1) 189,957 (59.1) 227,470 (58.3) 91,661 (31.8) 63,949 (30.5) 38,863 (29.3) 18,660 (27.8) Heavy (≥30 g/day) 16,602 (10.0) 28,492 (11.5) 43,536 (13.6) 71,559 (18.4) 2,432 (0.8) 2,343 (1.1) 1,920 (1.5) 1,375 (2.1) Hypertension 16,814 (10.1) 32,320 (13.0) 54,618 (17.0) 93,599 (24.0) <0.001 17,569 (6.1) 19,970 (9.5) 18,424 (13.9) 13,910 (20.8) <0.001 Diabetes mellitus 4,291 (2.6) 8,759 (3.5) 16,096 (5.0) 35,871 (9.2) <0.001 3,297 (1.1) 4,502 (2.2) 5,370 (4.1) 6,043 (9.0) <0.001 Lipid medication 1,943 (1.2) 4,486 (1.8) 8,918 (2.8) 17,290 (4.4) <0.001 2,275 (0.8) 3,310 (1.6) 3,719 (2.8) 3,531 (5.3) <0.001 Total cholesterol (mg/dL) 178.7±33.7 188.8±33.9 197.9±40.2 210.7±41.6 <0.001 179.2±34.6 189.5±36.8 198.4±38.3 209.3±43.3 <0.001 LDL cholesterol (mg/dL) 113.9±193.4 120.7±168.2 124.6±154.3 116.3±167.4 <0.001 107.9±144.5 114.1±105.1 118.3±95.9 118.3±132.1 <0.001 HDL cholesterol (mg/dL) 59.2±23.7 55.5±19.7 52.99±29.0 49.3±35.0 <0.001 63.5±19.1 60.0±25.9 57.5±31.6 60.3±74.2 <0.001
Serum creatinine (mg/dL) 1.3±1.7 1.3±1.7 1.3±1.7 1.3±1.7 0.834 0.9±1.0 0.9±0.9 0.9±1.0 1.0±1.2 <0.001
Aspartate aminotransferase
(IU/L)* 19 (15–26) 22 (16–30) 25 (19–36) 32 (23–46) <0.001 14 (11–18) 15 (12–20) 16 (13–22) 19 (14–28) <0.001 Alanine aminotransferase
(IU/L)* 22 (19–27) 23 (19–28) 24 (20–29) 26 (22–34) <0.001 19 (16–22) 19 (16–23) 20 (17–24) 21 (18–26) <0.001
Family history of CVD <0.001 <0.001
No 104,550 (62.8) 154,192 (62.1) 198,732 (61.9) 241,000 (61.8) 168,287 (58.4) 117,777 (56.2) 74,443 (56.2) 38,254 (57.1) Yes 12,855 (7.7) 20,292 (8.2) 27,697 (8.6) 34,524 (8.9) 24,569 (8.5) 19,105 (9.1) 12,400 (9.4) 6,422 (9.6) Unknown 48,959 (29.4) 73,688 (29.7) 94,760 (29.5) 114,541 (29.4) 95,572 (33.1) 72,855 (34.7) 45,714 (34.5) 22,349 (33.3) Values are presented as mean±standard deviation or number (%).
To compare the clinical characteristics according to TG quartiles, the Mood median test or analysis of variance for continuous variables and the χ2 test for categorical variables were used.
TG, triglyceride; Q, quartile; IQR, interquartile range; LDL, low-density lipoprotein; HDL, high-density lipoprotein; CVD, cardiovascular disease.
*Geometric mean (95% confidence interval).
hypertension, lipid-lowering medication use, and family history of CVD, there was a significant dose-response relationship between TG quartiles and the risk of the primary outcome (HR per quartile, 1.13 [95% CI, 1.12–1.14]; p<0.001; model 2 in Table 2). In that model, Q4 had a 1.45 times higher risk of the primary outcome than Q1 (HR, 1.45 [95% CI, 1.40–1.50]; p<0.001). Q4 also had a significantly higher risk of each composite endpoint than Q1 (for IHD: HR, 1.47 [95% CI, 1.41–1.52]; p<0.001; for ischemic stroke: HR, 1.45 [95% CI, 1.40–1.50]; p<0.001; and for MI risk: HR, 1.97 [95% CI, 1.80–2.17]; p<0.001). Interestingly, even in Q2, the risks of the primary outcome, IHD, and MI were significantly higher than in Q1 (HR, 1.15 [95% CI, 1.1–1.19], 1.17 [95% CI, 1.12–1.21], and 1.24 [95% CI, 1.12–1.37], respectively). There was no difference in overall mortality according to quartile (Table 2).
The sex-stratified analysis also showed similar trends in the risk of outcomes according to TG levels except for overall mortality (Table 2). In men, Q3 and Q4 showed a significantly lower risk of mortality than Q1 in the fully adjusted model (HR, 0.91 [95% CI, 0.86–0.97], p=0.011;
HR, 0.87 [95% CI, 0.82–0.92], p=0.001, respectively); by contrast, in women, Q3 and Q4 had a higher risk of mortality than Q1 (HR, 1.15 [95% CI, 1.05–1.25], p=0.001; HR, 1.31 [95% CI, 1.19–1.45], p<0.001, respectively; model 2 in Table 2).
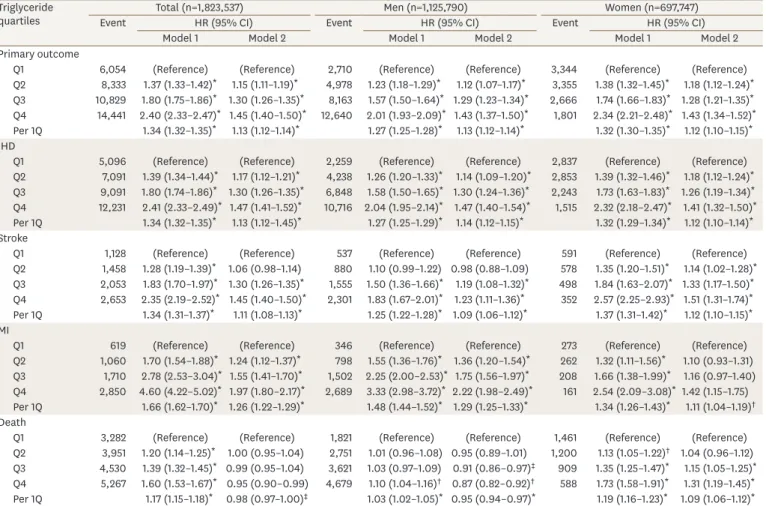
Table 2. Incidence of CVD or mortality according to triglyceride levels Triglyceride
quartiles Total (n=1,823,537) Men (n=1,125,790) Women (n=697,747)
Event HR (95% CI) Event HR (95% CI) Event HR (95% CI)
Model 1 Model 2 Model 1 Model 2 Model 1 Model 2
Primary outcome
Q1 6,054 (Reference) (Reference) 2,710 (Reference) (Reference) 3,344 (Reference) (Reference)
Q2 8,333 1.37 (1.33–1.42)* 1.15 (1.11–1.19)* 4,978 1.23 (1.18–1.29)* 1.12 (1.07–1.17)* 3,355 1.38 (1.32–1.45)* 1.18 (1.12–1.24)* Q3 10,829 1.80 (1.75–1.86)* 1.30 (1.26–1.35)* 8,163 1.57 (1.50–1.64)* 1.29 (1.23–1.34)* 2,666 1.74 (1.66–1.83)* 1.28 (1.21–1.35)* Q4 14,441 2.40 (2.33–2.47)* 1.45 (1.40–1.50)* 12,640 2.01 (1.93–2.09)* 1.43 (1.37–1.50)* 1,801 2.34 (2.21–2.48)* 1.43 (1.34–1.52)* Per 1Q 1.34 (1.32–1.35)* 1.13 (1.12–1.14)* 1.27 (1.25–1.28)* 1.13 (1.12–1.14)* 1.32 (1.30–1.35)* 1.12 (1.10–1.15)* IHD
Q1 5,096 (Reference) (Reference) 2,259 (Reference) (Reference) 2,837 (Reference) (Reference)
Q2 7,091 1.39 (1.34–1.44)* 1.17 (1.12–1.21)* 4,238 1.26 (1.20–1.33)* 1.14 (1.09–1.20)* 2,853 1.39 (1.32–1.46)* 1.18 (1.12–1.24)* Q3 9,091 1.80 (1.74–1.86)* 1.30 (1.26–1.35)* 6,848 1.58 (1.50–1.65)* 1.30 (1.24–1.36)* 2,243 1.73 (1.63–1.83)* 1.26 (1.19–1.34)* Q4 12,231 2.41 (2.33–2.49)* 1.47 (1.41–1.52)* 10,716 2.04 (1.95–2.14)* 1.47 (1.40–1.54)* 1,515 2.32 (2.18–2.47)* 1.41 (1.32–1.50)* Per 1Q 1.34 (1.32–1.35)* 1.13 (1.12–1.45)* 1.27 (1.25–1.29)* 1.14 (1.12–1.15)* 1.32 (1.29–1.34)* 1.12 (1.10–1.14)* Stroke
Q1 1,128 (Reference) (Reference) 537 (Reference) (Reference) 591 (Reference) (Reference)
Q2 1,458 1.28 (1.19–1.39)* 1.06 (0.98–1.14) 880 1.10 (0.99–1.22) 0.98 (0.88–1.09) 578 1.35 (1.20–1.51)* 1.14 (1.02–1.28)* Q3 2,053 1.83 (1.70–1.97)* 1.30 (1.26–1.35)* 1,555 1.50 (1.36–1.66)* 1.19 (1.08–1.32)* 498 1.84 (1.63–2.07)* 1.33 (1.17–1.50)* Q4 2,653 2.35 (2.19–2.52)* 1.45 (1.40–1.50)* 2,301 1.83 (1.67–2.01)* 1.23 (1.11–1.36)* 352 2.57 (2.25–2.93)* 1.51 (1.31–1.74)* Per 1Q 1.34 (1.31–1.37)* 1.11 (1.08–1.13)* 1.25 (1.22–1.28)* 1.09 (1.06–1.12)* 1.37 (1.31–1.42)* 1.12 (1.10–1.15)* MI
Q1 619 (Reference) (Reference) 346 (Reference) (Reference) 273 (Reference) (Reference)
Q2 1,060 1.70 (1.54–1.88)* 1.24 (1.12–1.37)* 798 1.55 (1.36–1.76)* 1.36 (1.20–1.54)* 262 1.32 (1.11–1.56)* 1.10 (0.93–1.31) Q3 1,710 2.78 (2.53–3.04)* 1.55 (1.41–1.70)* 1,502 2.25 (2.00–2.53)* 1.75 (1.56–1.97)* 208 1.66 (1.38–1.99)* 1.16 (0.97–1.40) Q4 2,850 4.60 (4.22–5.02)* 1.97 (1.80–2.17)* 2,689 3.33 (2.98–3.72)* 2.22 (1.98–2.49)* 161 2.54 (2.09–3.08)* 1.42 (1.15–1.75) Per 1Q 1.66 (1.62–1.70)* 1.26 (1.22–1.29)* 1.48 (1.44–1.52)* 1.29 (1.25–1.33)* 1.34 (1.26–1.43)* 1.11 (1.04–1.19)† Death
Q1 3,282 (Reference) (Reference) 1,821 (Reference) (Reference) 1,461 (Reference) (Reference)
Q2 3,951 1.20 (1.14–1.25)* 1.00 (0.95–1.04) 2,751 1.01 (0.96–1.08) 0.95 (0.89–1.01) 1,200 1.13 (1.05–1.22)† 1.04 (0.96–1.12) Q3 4,530 1.39 (1.32–1.45)* 0.99 (0.95–1.04) 3,621 1.03 (0.97–1.09) 0.91 (0.86–0.97)‡ 909 1.35 (1.25–1.47)* 1.15 (1.05–1.25)* Q4 5,267 1.60 (1.53–1.67)* 0.95 (0.90–0.99) 4,679 1.10 (1.04–1.16)† 0.87 (0.82–0.92)† 588 1.73 (1.58–1.91)* 1.31 (1.19–1.45)* Per 1Q 1.17 (1.15–1.18)* 0.98 (0.97–1.00)‡ 1.03 (1.02–1.05)* 0.95 (0.94–0.97)* 1.19 (1.16–1.23)* 1.09 (1.06–1.12)* The primary outcome was incident ischemic CVD, defined as a composite of IHD and ischemic stroke during the follow-up period.
Data are shown as below: model 1, without adjustment; model 2, with adjustment for age, sex, obesity, smoking, alcohol drinking, low-density lipoprotein cholesterol, diabetes mellitus, hypertension, lipid-lowering medication use, and family history of CVD.
CVD, cardiovascular disease; HR, hazard ratio; CI, confidence interval; Q, quartile; IHD, ischemic heart disease; MI, myocardial infarction.
*p<0.001, †p<0.01, ‡p<0.05.
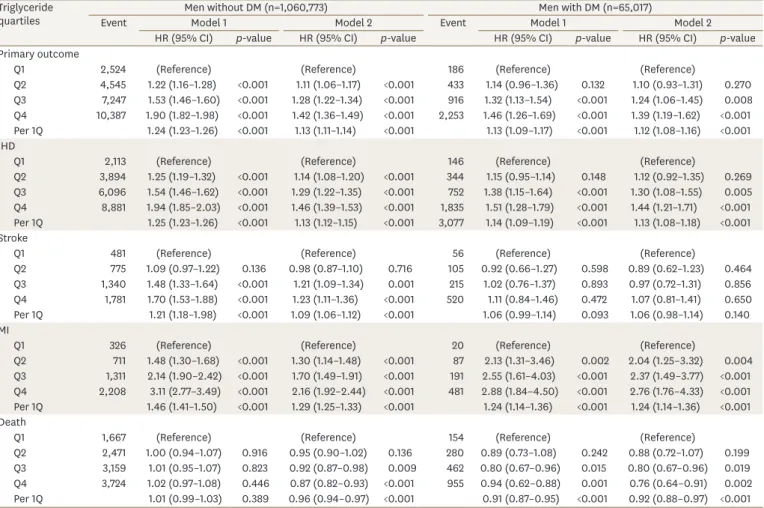
3. Incidence of CVD and mortality according to sex and diabetes mellitus As there was a significant difference between the sexes according to the primary outcome and the association between mortality and TG levels, we performed a stratified analysis according to sex. Since insulin resistance and hyperglyceridemia are well-known determinants of serum TG levels,
2subsequent stratification according to diabetes status was performed.
In men, an increasing trend of risk for IHD, stroke, and MI, as well as the primary outcome, according to increasing TG quartiles was found irrespective of diabetes status. However, in those with diabetes, there was no significant difference in stroke risk according to TG quartiles (HR per quartile, 1.06 [95% CI, 0.98–1.14]; Table 3), which corresponded to the findings for TG levels ≥150 mg/dL (HR for stroke, 1.05 [95% CI, 0.91–1.21]; Supplementary
Table 3). An inverse correlation between overall mortality and TG quartiles was also found inmen with and without diabetes (Table 3).
The finding of an increasing trend of risk of IHD and stroke according to TG in all women was maintained in the stratified analysis according to diabetes (Table 4). Unlike men, the HR of stroke for each 1-quartile increase in TG in women with diabetes was 1.41 (95% CI, 1.21–1.63), which was comparable to that in women who did not have diabetes (HR, 1.12; 95%
Table 3. Incidence of CVD or mortality according to triglyceride levels in men with and without DM Triglyceride
quartiles Men without DM (n=1,060,773) Men with DM (n=65,017)
Event Model 1 Model 2 Event Model 1 Model 2
HR (95% CI) p-value HR (95% CI) p-value HR (95% CI) p-value HR (95% CI) p-value
Primary outcome
Q1 2,524 (Reference) (Reference) 186 (Reference) (Reference)
Q2 4,545 1.22 (1.16–1.28) <0.001 1.11 (1.06–1.17) <0.001 433 1.14 (0.96–1.36) 0.132 1.10 (0.93–1.31) 0.270 Q3 7,247 1.53 (1.46–1.60) <0.001 1.28 (1.22–1.34) <0.001 916 1.32 (1.13–1.54) <0.001 1.24 (1.06–1.45) 0.008 Q4 10,387 1.90 (1.82–1.98) <0.001 1.42 (1.36–1.49) <0.001 2,253 1.46 (1.26–1.69) <0.001 1.39 (1.19–1.62) <0.001 Per 1Q 1.24 (1.23–1.26) <0.001 1.13 (1.11–1.14) <0.001 1.13 (1.09–1.17) <0.001 1.12 (1.08–1.16) <0.001 IHD
Q1 2,113 (Reference) (Reference) 146 (Reference) (Reference)
Q2 3,894 1.25 (1.19–1.32) <0.001 1.14 (1.08–1.20) <0.001 344 1.15 (0.95–1.14) 0.148 1.12 (0.92–1.35) 0.269 Q3 6,096 1.54 (1.46–1.62) <0.001 1.29 (1.22–1.35) <0.001 752 1.38 (1.15–1.64) <0.001 1.30 (1.08–1.55) 0.005 Q4 8,881 1.94 (1.85–2.03) <0.001 1.46 (1.39–1.53) <0.001 1,835 1.51 (1.28–1.79) <0.001 1.44 (1.21–1.71) <0.001 Per 1Q 1.25 (1.23–1.26) <0.001 1.13 (1.12–1.15) <0.001 3,077 1.14 (1.09–1.19) <0.001 1.13 (1.08–1.18) <0.001 Stroke
Q1 481 (Reference) (Reference) 56 (Reference) (Reference)
Q2 775 1.09 (0.97–1.22) 0.136 0.98 (0.87–1.10) 0.716 105 0.92 (0.66–1.27) 0.598 0.89 (0.62–1.23) 0.464 Q3 1,340 1.48 (1.33–1.64) <0.001 1.21 (1.09–1.34) 0.001 215 1.02 (0.76–1.37) 0.893 0.97 (0.72–1.31) 0.856 Q4 1,781 1.70 (1.53–1.88) <0.001 1.23 (1.11–1.36) <0.001 520 1.11 (0.84–1.46) 0.472 1.07 (0.81–1.41) 0.650 Per 1Q 1.21 (1.18–1.98) <0.001 1.09 (1.06–1.12) <0.001 1.06 (0.99–1.14) 0.093 1.06 (0.98–1.14) 0.140 MI
Q1 326 (Reference) (Reference) 20 (Reference) (Reference)
Q2 711 1.48 (1.30–1.68) <0.001 1.30 (1.14–1.48) <0.001 87 2.13 (1.31–3.46) 0.002 2.04 (1.25–3.32) 0.004 Q3 1,311 2.14 (1.90–2.42) <0.001 1.70 (1.49–1.91) <0.001 191 2.55 (1.61–4.03) <0.001 2.37 (1.49–3.77) <0.001 Q4 2,208 3.11 (2.77–3.49) <0.001 2.16 (1.92–2.44) <0.001 481 2.88 (1.84–4.50) <0.001 2.76 (1.76–4.33) <0.001 Per 1Q 1.46 (1.41–1.50) <0.001 1.29 (1.25–1.33) <0.001 1.24 (1.14–1.36) <0.001 1.24 (1.14–1.36) <0.001 Death
Q1 1,667 (Reference) (Reference) 154 (Reference) (Reference)
Q2 2,471 1.00 (0.94–1.07) 0.916 0.95 (0.90–1.02) 0.136 280 0.89 (0.73–1.08) 0.242 0.88 (0.72–1.07) 0.199 Q3 3,159 1.01 (0.95–1.07) 0.823 0.92 (0.87–0.98) 0.009 462 0.80 (0.67–0.96) 0.015 0.80 (0.67–0.96) 0.019 Q4 3,724 1.02 (0.97–1.08) 0.446 0.87 (0.82–0.93) <0.001 955 0.94 (0.62–0.88) 0.001 0.76 (0.64–0.91) 0.002 Per 1Q 1.01 (0.99–1.03) 0.389 0.96 (0.94–0.97) <0.001 0.91 (0.87–0.95) <0.001 0.92 (0.88–0.97) <0.001 The primary outcome was incident ischemic CVD, defined as a composite of IHD and ischemic stroke during the follow-up period.
Data are shown as below: model 1, without adjustment; model 2: with adjustment for age, obesity, smoking, alcohol drinking, low-density lipoprotein cholesterol, hypertension, lipid-lowering medication use, and family history of CVD.
CVD, cardiovascular disease; DM, diabetes mellitus; HR, hazard ratio; CI, confidence interval; Q, quartile; IHD, ischemic heart disease; MI, myocardial infarction.
CI, 1.07–1.18). In women with diabetes, MI and mortality during follow-up period were only found in 93 and 258 out of 19,121 subjects, respectively; there was no significant difference in MI or mortality events according to TG quartiles (Table 4).
Adopting TG ≥150 mg/dL as the hypertriglyceridemia cutoff confirmed that a TG level ≥150 mg/dL significantly increased the risk of IHD irrespective of sex and diabetes mellitus status (Supplementary Table 3).
DISCUSSION
Using a nationwide database of the Korean population aged 30–49 years, we found that as serum TG levels increased, the future risk of the primary outcome (a composite of IHD and ischemic stroke) significantly increased in both men and women, even after adjusting for important CVD risk factors including LDL cholesterol levels. The relationship between TG levels and mortality differed by sex. In women, mortality increased at higher TG levels; in contrast, an inverse relationship between TG level and mortality was found in men.
Table 4. Incidence of CVD or mortality according to triglyceride levels in women with and without DM Triglyceride
quartiles Women without DM (n=678,535) Women with DM (n=19,212)
Event Model 1 Model 2 Event Model 1 Model 2
HR (95% CI) p-value HR (95% CI) p-value HR (95% CI) p-value HR (95% CI) p-value
Primary outcome
Q1 3,248 (Reference) (Reference) 96 (Reference) (Reference)
Q2 3,177 1.36 (1.30–1.43) <0.001 1.17 (1.12–1.23) <0.001 178 1.36 (1.06–1.74) 0.015 1.24 (0.96–1.59) 0.097 Q3 2,407 1.67 (1.58–1.76) <0.001 1.26 (1.20–1.33) <0.001 259 1.67 (1.32–2.12) <0.001 1.46 (1.15–1.85) 0.002 Q4 1,455 2.11 (1.98–2.24) <0.001 1.40 (1.31–1.50) <0.001 346 1.99 (1.59–2.50) <0.001 1.66 (1.32–2.09) <0.001 Per 1Q 1.28 (1.26–1.31) <0.001 1.12 (1.10–1.14) <0.001 1.24 (1.16–1.32) <0.001 1.18 (1.10–1.26) <0.001 IHD
Q1 2,750 (Reference) (Reference) 87 (Reference) (Reference)
Q2 2,704 1.37 (1.30–1.44) <0.001 1.18 (1.12–1.24) <0.001 149 1.25 (0.96–1.55) 0.199 1.13 (0.87–1.48) 0.364 Q3 2,019 1.65 (1.56–1.75) <0.001 1.25 (1.18–1.32) <0.001 224 1.59 (1.24–2.04) <0.001 1.37 (1.07–1.76) 0.013 Q4 1,231 2.11 (1.97–2.25) <0.001 1.40 (1.30–1.50) <0.001 284 1.80 (1.41–2.29) <0.001 1.47 (1.15–1.88) 0.002 Per 1Q 1.28 (1.25–1.30) <0.001 1.14 (1.09–1.14) <0.001 1.21 (1.13–1.30) <0.001 1.14 (1.06–1.22) <0.001 Stroke
Q1 575 (reference) (Reference) 16 (Reference) (Reference)
Q2 543 1.31 (1.17–1.48) <0.001 1.13 (1.00–1.27) 0.047 35 1.60 (0.89–2.89) 0.120 1.49 (0.83–2.70) 0.186 Q3 449 1.75 (1.55–1.98) <0.001 1.31 (1.16–1.49) <0.001 49 1.88 (1.07–3.31) 0.028 1.72 (0.97–3.05) 0.061 Q4 260 2.12 (1.83–2.45) <0.001 1.37 (1.18–1.60) <0.001 92 3.15 (1.85–5.35) <0.001 2.83 (1.64–4.86) <0.001 Per 1Q 1.30 (1.24–1.35) <0.001 1.12 (1.07–1.18) <0.001 1.45 (1.25–1.67) <0.001 1.41 (1.21–1.63) <0.001 MI
Q1 266 (Reference) (Reference) 7 (Reference) (Reference)
Q2 241 1.26 (1.06–1.50) 0.010 1.07 (0.90–1.27) 0.463 21 2.19 (0.93–5.16) 0.072 1.99 (0.84–4.70) 0.116 Q3 178 1.50 (1.24–1.81) <0.001 1.10 (0.91–1.34) 0.324 30 2.63 (1.16–5.99) 0.021 2.29 (1.00–5.26) 0.051 Q4 126 2.22 (1.79–2.74) <0.001 1.40 (1.12–1.75) 0.003 35 2.73 (1.21–6.13) 0.016 2.22 (0.97–5.08) 0.058 Per 1Q 1.28 (1.20–1.37) <0.001 1.10 (1.03–1.18) 0.008 1.27 (1.04–1.55) 0.020 1.19 (0.97–1.46) 0.098 Death
Q1 1,421 (Reference) (Reference) 40 (Reference) (Reference)
Q2 1,146 1.12 (1.04–1.21) 0.004 1.04 (0.96–1.12) 0.374 54 0.98 (0.65–1.48) 0.947 0.97 (0.64–1.46) 0.886 Q3 839 1.32 (1.22–1.44) <0.001 1.15 (1.05–1.25) 0.002 70 1.07 (0.73–1.58) 0.722 1.05 (0.71–1.56) 0.817 Q4 494 1.63 (1.47–1.80) <0.001 1.32 (1.18–1.47) <0.001 94 1.28 (0.89–1.85) 0.190 1.21 (0.83–1.78) 0.327 Per 1Q 1.17 (1.13–1.21) <0.001 1.09 (1.05–1.12) <0.001 1.10 (0.98–1.23) 0.109 1.08 (0.96–1.22) 0.213 The primary outcome was incident ischemic CVD, defined as a composite of IHD and ischemic stroke during the follow-up period.
Data are shown as below: model 1, without adjustment; model 2, with adjustment for age, obesity, smoking, alcohol drinking, low-density lipoprotein cholesterol, hypertension, lipid-lowering medication use, and family history of CVD.
CVD, cardiovascular disease; DM, diabetes mellitus; HR, hazard ratio; CI, confidence interval; Q, quartile; IHD, ischemic heart disease; MI, myocardial infarction.
TG-rich lipoproteins can penetrate the arterial wall and are taken up by macrophages, which transform into foam cells.
18They result in endothelial dysfunction, increased expression of adhesion molecules in endothelial cells, and production of oxidized free fatty acids and inflammatory cytokines, which promote atherogenesis and thrombogenesis.
19Previous epidemiological studies have shown positive correlations between CVD risk and circulating TG levels,
1,2,7,20and our study confirmed that correlation in relatively young adults aged 30–49 years using a prospective nationwide database. However, conflicting data have been reported regarding whether TG levels independently increase CVD risk,
1,2,7,20which might be due to heterogeneity of the study populations. The effect of TG levels on CVD was more prominent in women,
20young adults (<50 years vs. ≥50 years),
20and those without other CVD risk factors.
7The current study selected a study population with narrow age range (30–49 years) and confirmed that TG was an independent risk factor for IHD and stroke in this population.
In addition, consistent findings were found for subjects with diabetes, although there was statistical attenuation due to a small number of stroke events in the subgroup analysis.
Interestingly, the relationship between TG levels and mortality differed according to sex in the current study. In women, an increasing trend for mortality was found as TG levels increased, which corroborates previous epidemiological studies.
20,21However, among men, an inverse relationship between TG levels and mortality was found in the present study. A recent meta-analysis of prospective studies on the effect of TG levels on overall mortality showed that increased TG levels, even in the range of 150–200 mg/dL, increased the risk of CVD mortality compared to TG levels <150 mg/dL
20; however, this relationship was not found in studies with less than 15 years of follow-up.
20A long-term prospective study with 22 years of follow-up confirmed that the effect of hypertriglyceridemia was more prominent after 5 years.
21Even though the Action to Control Cardiovascular Risk in Diabetes (ACCORD)- Lipid trial failed to show an additional benefit of fenofibrate to statin therapy,
5a beneficial reduction in CVD events was observed in an extended follow-up study (ACCORD Follow- On),
22which implies that TG levels might require a relatively long time to affect clinical outcomes. Studies with a follow-up duration of less than 5 years even showed an inverse association between TG and mortality in the population with IHD.
23,24Moreover, low TG levels are an independent risk factor for mortality within 1 year after acute CVD events.
25-27The median follow-up duration of the current study was 8.3 years, which might have affected the observed association between TG levels and mortality. In addition, adjustment for BMI might impact the association between TG levels and mortality. In the Korean population, mortality in those with a BMI <23 kg/m
2was higher than in the normal-weight group
28,29; this relationship was more prominent in men than in women,
29and the BMI with the lowest mortality was higher in men compared to women.
29,30Considering that the positive correlation between TG levels and BMI was more prominent in men in the current study, adjustment for BMI might reverse the relationship between TG levels and mortality in men.
More studies are needed to confirm the finding of an inverse correlation between TG levels and mortality in young men aged 30–49 years.
The major limitation of the current study is that the events during the following period
were assessed using claims data. Even though the sensitivity and positive predictive
values of claims data with identical definitions for CVD to those used in the current study
were reported to be as high as 90% in a previous validation study in Korea,
31the findings
might have been affected both by underestimation of the real incidence of CVD, especially
for ischemic stroke,
32and overestimation due to the low sensitivity of claims-based
definitions.
31,33In addition, clinical data during the follow-up period were not considered.
Furthermore, claims data provide limited information on disease severity, co-morbid conditions, past history, and specific treatment. Second, as there was no intervention for TG levels, the findings regarding the relationship between TG levels and clinical outcomes, especially mortality, cannot be explained. In addition to previous TG-lowering clinical trials to prove CVD benefits,
5the Pemafibrate to Reduce Cardiovascular Outcomes by Reducing Triglycerides in Patients with Diabetes study is ongoing to demonstrate the effect of a selective peroxisome proliferator-activated receptor alpha modulator on CVD outcomes, including all-cause mortality,
34which might provide insights into the effects of TG levels on mortality.
Third, we did not have cause-specific mortality data, which makes it more difficult to explain the observed inverse relationship between TG level sand overall mortality found in men.
In addition, we excluded subjects with previous history of stroke or IHD and those with
insufficient follow-up duration, which might have resulted in selection bias. Lastly, there was no consideration of multicollinearity between TG levels and covariates. Collinearity between BMI and TG levels might have influenced the sex difference in the association between TG levels and mortality. Nevertheless, the current study was based on nationwide claims data covering 97.0%
of the population in Korea, and the median follow-up duration reached 8.3 years. In addition to claims data, the current study incorporated baseline clinical characteristics, including biochemical data from health checkups, which could enable adjustments for CVD risk factors other than TG levels. Furthermore, the wash-out period was long (7 years), which might have reduced the risk of confounding from a previous history of CVD.
In conclusion, in the Korean population aged 30–49 years, high TG levels independently increased future CVD risk both in men and women. The sex difference in the relationship between TG levels and overall mortality found in the current study should be further investigated in diverse populations.
SUPPLEMENTARY MATERIALS
Supplementary Table 1
Baseline characteristics according to development of the primary outcome
Click here to viewSupplementary Table 2
Number at risk and event rate during the follow-up period
Click here to viewSupplementary Table 3
Incidence of CVD or mortality according to a triglyceride level cut-off of ≥150 mg/dL
Click here to viewREFERENCES
1. Faergeman O, Holme I, Fayyad R, Bhatia S, Grundy SM, Kastelein JJ, et al. Plasma triglycerides and cardiovascular events in the treating to new targets and incremental decrease in end-points through
aggressive lipid lowering trials of statins in patients with coronary artery disease. Am J Cardiol 2009;104:459-463.
PUBMED | CROSSREF
2. Criqui MH, Heiss G, Cohn R, Cowan LD, Suchindran CM, Bangdiwala S, et al. Plasma triglyceride level and mortality from coronary heart disease. N Engl J Med 1993;328:1220-1225.
PUBMED | CROSSREF
3. Frick MH, Elo O, Haapa K, Heinonen OP, Heinsalmi P, Helo P, et al. Helsinki Heart Study: primary- prevention trial with gemfibrozil in middle-aged men with dyslipidemia. Safety of treatment, changes in risk factors, and incidence of coronary heart disease. N Engl J Med 1987;317:1237-1245.
PUBMED | CROSSREF
4. Keech A, Simes RJ, Barter P, Best J, Scott R, Taskinen MR, et al. Effects of long-term fenofibrate therapy on cardiovascular events in 9795 people with type 2 diabetes mellitus (the FIELD study): randomised controlled trial. Lancet 2005;366:1849-1861.
PUBMED | CROSSREF
5. ACCORD Study GroupGinsberg HN, Elam MB, Lovato LC, Crouse JR 3rd, Leiter LA, et al. Effects of combination lipid therapy in type 2 diabetes mellitus. N Engl J Med 2010;362:1563-1574.
PUBMED | CROSSREF
6. Moon JH, Koo BK, Moon MK. Optimal high-density lipoprotein cholesterol cutoff for predicting cardiovascular disease: comparison of the Korean and US National Health and Nutrition Examination Surveys. J Clin Lipidol 2015;9:334-342.
PUBMED | CROSSREF
7. Kim EH, Lee JB, Kim SH, Jo MW, Hwang JY, Bae SJ, et al. Serum triglyceride levels and cardiovascular disease events in Koreans. Cardiology 2015;131:228-235.
PUBMED | CROSSREF
8. Lim S, Min SH, Lee JH, Kim LK, Lee DH, Lee JE, et al. Components of metabolic syndrome in Korean adults: a hospital-based cohort at Seoul National University Bundang Hospital. J Obes Metab Syndr 2019;28:118-128.
PUBMED | CROSSREF
9. Heitmann BL. The effects of gender and age on associations between blood lipid levels and obesity in Danish men and women aged 35–65 years. J Clin Epidemiol 1992;45:693-702.
PUBMED | CROSSREF
10. Yoon JW, Jung CH, Kim MK, Park HE, Park KS, Jang HC, et al. Influence of the definition of “metabolically healthy obesity” on the progression of coronary artery calcification. PLoS One 2017;12:e0178741.
PUBMED | CROSSREF
11. Koo BK, Lee CH, Yang BR, Hwang SS, Choi NK. The incidence and prevalence of diabetes mellitus and related atherosclerotic complications in Korea: a National Health Insurance Database Study. PLoS One 2014;9:e110650.
PUBMED | CROSSREF
12. Kwon S, Lee SR, Choi EK, Lee SH, Han KD, Lee SY, et al. Visit-to-visit variability of metabolic parameters and risk of heart failure: a nationwide population-based study. Int J Cardiol 2019;293:153-158.
PUBMED | CROSSREF
13. Expert Panel on Detection, Evaluation, and Treatment of High Blood Cholesterol in Adults. Executive summary of the third report of the national cholesterol education program (NCEP) expert panel on detection, evaluation, and treatment of high blood cholesterol in adults (Adult Treatment Panel III). JAMA 2001;285:2486-2497.
PUBMED | CROSSREF
14. Choi EK. Cardiovascular research using the Korean National Health Information Database. Korean Circ J 2020;50:754-772.
PUBMED | CROSSREF
15. Nordestgaard BG, Langsted A, Mora S, Kolovou G, Baum H, Bruckert E, et al. Fasting is not routinely required for determination of a lipid profile: clinical and laboratory implications including flagging at desirable concentration cut-points-a joint consensus statement from the European Atherosclerosis Society and European Federation of Clinical Chemistry and Laboratory Medicine. Eur Heart J 2016;37:1944-1958.
PUBMED | CROSSREF
16. Wang X, Magkos F, Mittendorfer B. Sex differences in lipid and lipoprotein metabolism: it's not just about sex hormones. J Clin Endocrinol Metab 2011;96:885-893.
PUBMED | CROSSREF
17. Bitzur R, Cohen H, Kamari Y, Shaish A, Harats D. Triglycerides and HDL cholesterol: stars or second leads in diabetes? Diabetes Care 2009;32 Suppl 2:S373-S377.
PUBMED | CROSSREF
18. Goldstein JL, Ho YK, Brown MS, Innerarity TL, Mahley RW. Cholesteryl ester accumulation in macrophages resulting from receptor-mediated uptake and degradation of hypercholesterolemic canine beta-very low density lipoproteins. J Biol Chem 1980;255:1839-1848.
PUBMED
19. Reiner Ž. Hypertriglyceridaemia and risk of coronary artery disease. Nat Rev Cardiol 2017;14:401-411.
PUBMED | CROSSREF
20. Liu J, Zeng FF, Liu ZM, Zhang CX, Ling WH, Chen YM. Effects of blood triglycerides on cardiovascular and all-cause mortality: a systematic review and meta-analysis of 61 prospective studies. Lipids Health Dis 2013;12:159.
PUBMED | CROSSREF
21. Klempfner R, Erez A, Sagit BZ, Goldenberg I, Fisman E, Kopel E, et al. Elevated triglyceride level is independently associated with increased all-cause mortality in patients with established coronary heart disease: twenty-two-year follow-up of the bezafibrate infarction prevention study and registry. Circ Cardiovasc Qual Outcomes 2016;9:100-108.
PUBMED | CROSSREF
22. Zhu L, Hayen A, Bell KJL. Legacy effect of fibrate add-on therapy in diabetic patients with dyslipidemia: a secondary analysis of the ACCORDION study. Cardiovasc Diabetol 2020;19:28.
PUBMED | CROSSREF
23. Xia TL, Li YM, Huang FY, Chai H, Huang BT, Li Q, et al. The triglyceride paradox in the mortality of coronary artery disease. Lipids Health Dis 2019;18:21.
PUBMED | CROSSREF
24. Cheng YT, Liu TJ, Lai HC, Lee WL, Ho HY, Su CS, et al. Lower serum triglyceride level is a risk factor for in-hospital and late major adverse events in patients with ST-segment elevation myocardial infarction treated with primary percutaneous coronary intervention- a cohort study. BMC Cardiovasc Disord 2014;14:143.
PUBMED | CROSSREF
25. Deng QW, Li S, Wang H, Lei L, Zhang HQ, Gu ZT, et al. The short-term prognostic value of the triglyceride- to-high-density lipoprotein cholesterol ratio in acute ischemic stroke. Aging Dis 2018;9:498-506.
PUBMED | CROSSREF
26. Cheng KH, Chu CS, Lin TH, Lee KT, Sheu SH, Lai WT. Lipid paradox in acute myocardial infarction-the association with 30-day in-hospital mortality. Crit Care Med 2015;43:1255-1264.
PUBMED | CROSSREF
27. Dziedzic T, Slowik A, Gryz EA, Szczudlik A. Lower serum triglyceride level is associated with increased stroke severity. Stroke 2004;35:e151-e152.
PUBMED | CROSSREF
28. Lee SH, Kim DH, Park JH, Kim S, Choi M, Kim H, et al. Association between body mass index and mortality in the Korean elderly: a nationwide cohort study. PLoS One 2018;13:e0207508.
PUBMED | CROSSREF
29. Jee SH, Sull JW, Park J, Lee SY, Ohrr H, Guallar E, et al. Body-mass index and mortality in Korean men and women. N Engl J Med 2006;355:779-787.
PUBMED | CROSSREF
30. Kim H, Yoon JL, Lee A, Jung Y, Kim MY, Cho JJ, et al. Prognostic effect of body mass index to mortality in Korean older persons. Geriatr Gerontol Int 2018;18:538-546.
PUBMED | CROSSREF
31. Park J, Kwon S, Choi EK, Choi Y, Lee E, Choe W, et al. Validation of diagnostic codes of major clinical outcomes in a National Health Insurance database. Int J Arrhythm 2019;20:1-7.
CROSSREF
32. Ono Y, Taneda Y, Takeshima T, Iwasaki K, Yasui A. Validity of claims diagnosis codes for cardiovascular diseases in diabetes patients in Japanese Administrative Database. Clin Epidemiol 2020;12:367-375.
PUBMED | CROSSREF
33. Kim JY, Kang K, Kang J, Koo J, Kim DH, Kim BJ, et al. Executive summary of stroke statistics in Korea 2018:
a report from the epidemiology research council of the Korean Stroke Society. J Stroke 2019;21:42-59.
PUBMED | CROSSREF
34. Pradhan AD, Paynter NP, Everett BM, Glynn RJ, Amarenco P, Elam M, et al. Rationale and design of the pemafibrate to reduce cardiovascular outcomes by reducing triglycerides in patients with diabetes (PROMINENT) study. Am Heart J 2018;206:80-93.
PUBMED | CROSSREF